3681
Evaluation of Accuracy of MR phase and R2* for susceptibility quantification1United Imaging of Healthcare America, Houston, TX, United States, 2Department of Radiology, Shanghai Institute of Medical Imaging, Zhongshan Hospital, Fundan University, Shanghai, People's Republic of China, 3Shanghai United Imaging of Healthcare, Shanghai, People's Republic of China
Synopsis
Computer simulation was performed to evaluate the relationship between a voxel's bulk susceptibility and its R2* or phase behavior. A virtual voxel with multi-dipole model was created, and the effects of dipole properties on the accuracy and consistency of R2* and phase on reflecting the voxel’s bulk susceptibility was investigated. Linearity is only observed at low bulk susceptibility regime, and phase is much more robust against various susceptibility dipole properties than R2*.
Purpose
Susceptibility is an important property of tissues that not only contribute to MR imaging contrast, but also can be quantified to reveal certain biological or pathological process, such as iron deposition, tissue hemorrhage and blood oxygenation level 1. In MRI, tissue susceptibility is routinely being quantified using R2, R2* or quantitative susceptibility mapping (QSM) 2,3, with the hypothesis that the intra-voxel signal dephasing or the voxel phase is linearly proportional to tissue’s bulk susceptibility. However, different tissues or pathology may have different composition of sub-voxel structures and properties, and it is possible that the accuracy and consistency of susceptibility quantification using R2* and phase (the basis for QSM calculation) be affected. Therefore it is our goal to investigate this issue using computer simulation.Methods
A multi-dipole model was developed to evaluate the behavior of R2* relaxation and phase under various conditions. The simulation was performed on a virtual 3D ‘voxel’ represented by a 128×128×128 matrix in a homogeneous magnetic field, with signal intensity being 1 and susceptibility being 0 ppm. The voxel signal was ‘on-resonant’ and thus would develop zero phase regardless of echo time (TE), and R2 was assumed to be 0 so that any signal decay is associated with R2* associated with the dipoles. The iron deposition was modeled as multiple spherical dipoles with different radii r and susceptibility values χ. The dipoles were randomly positioned (overlaps allowed) within the voxel grid creating a susceptibility distribution map, and the corresponding field map was generated using the Green’s function4. The signal intensity of the dipoles was also assumed to be 1, and the corresponding phase map could be calculated at arbitrary echo time (in ms). The voxel matrix was then complex summed to yield the normalized signal intensity (i.e. divided by 1283) and phase at various TEs, from which R2* and field offset ΔB were calculated. The field strength was assumed to be 3T, and the above procedure is shown in Fig.1.
The simulation parameters were as follows: dipoles radii ‘r’ was 1/32, 1/16 or 1/8 of the voxel size (or 4, 8 or 16 in terms of matrix grids), dipole quantity ‘n’ ranged from 50 to 400, dipole susceptibility ‘χ’ ranged from 0.25 to 5.00 ppm, and TE ranged from 0 to 10ms in step of 1ms. For a specific set of simulation parameters, Monte Carlo test with 100 ~ 65500 iterations were performed to reveal the effects of random dipole positioning, and the mean ± standard deviation from all iterations were calculated. A quantity of volume normalized bulk susceptibility, defined as X= nχr3, was used to represent the level of ‘iron concentration’ of the dipoles. No noise was added to the simulation as our purpose was to investigate the ideal relationship between R2*, ΔB and susceptibility. All simulations were implemented in MatLab (MathWorks, USA).
Results and Discussion
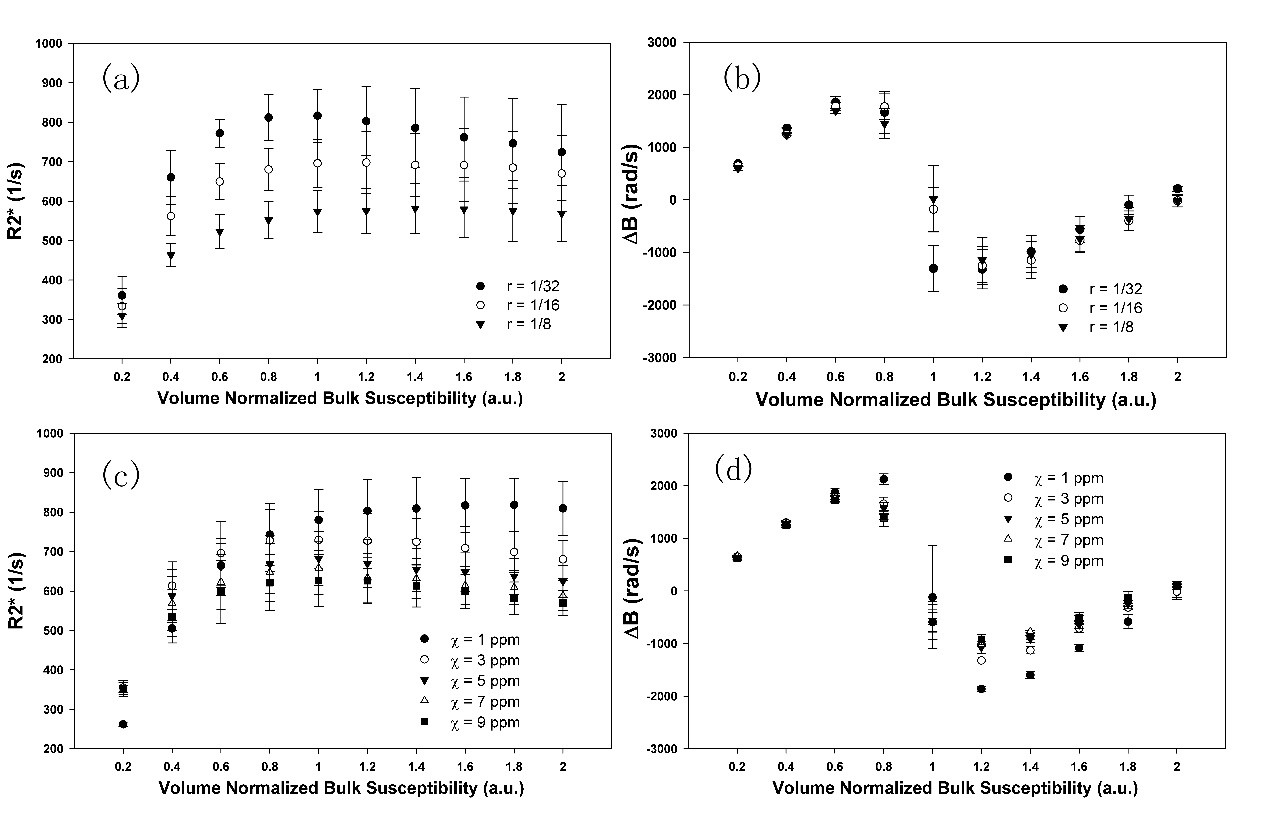
Firstly of all, neither R2* nor ΔB was linear within the whole tested range of bulk susceptibility. Only at relatively low bulk susceptibility range (i.e. X < 0.6) an approximate linearity could be assumed, and any attempt to estimate the true bulk susceptibility would fail beyond this linear regime, suggesting cautions for heavy iron deposited scenarios. Even within the low bulk susceptibility regime, the behavior of R2* strongly depended on the size and susceptibility of the dipoles (one way ANOVA p<0.001). The dipole size r most significantly affected the R2* values (Fig.2a) when bulk susceptibility remained the same. R2* value of smaller dipoles (i.e. 1/32) was more sensitive to bulk susceptibility changes than that of bigger dipoles. However, if the size of the dipole is unknown, which is normally the real life case of iron deposited tissues, the bulk susceptibility (and thus iron content) induced from R2* value would be likely underestimated, even though linear relationship could still be assumed. On the other hand, the dipole susceptibility c also affects R2* behavior, albeit to a milder extent (Fig.2c). Nevertheless, structures with stronger susceptibility within a voxel tend to reduce the voxel’s estimated bulk susceptibility via R2* quantification. In contrast, ΔB displayed a very consistent result across all combination of n, r and χ that yield the same bulk susceptibility (Fig. 2b & 2d). Within the low bulk susceptibility regime, ΔB yielded virtually the same correlation coefficient under all conditions, with very small variations (one way ANOVA p=0.99).
Therefore, our simulation suggested that ΔB, or signal phase and QSM, is in principle more reliable than R2* in estimating bulk susceptibility on the scale of voxels, regardless of the composition of sub-voxel susceptibility components.
Acknowledgements
No acknowledgement found.References
1. Wang Y, Liu T. Quantitative susceptibility mapping (QSM): Decoding MRI data for a tissue magnetic biomarker. Magn Reson Med 2014.
2. Sharma SD, Fischer R, Schoennagel BP, Nielsen P, Kooijman H, Yamamura J, Adam G, Bannas P, Hernando D, Reeder SB. MRI-based quantitative susceptibility mapping (QSM) and R2* mapping of liver iron overload: Comparison with SQUID-based biomagnetic liver susceptometry. Magn Reson Med 2016.
3. Wu B, Li W, Avram AV, Gho SM, Liu C. Fast and tissue-optimized mapping of magnetic susceptibility and T2* with multi-echo and multi-shot spirals. Neuroimage 2012;59(1):297-305.
4. Haacke EM, Liu S, Buch S, Zheng W, Wu D, Ye Y. Quantitative susceptibility mapping: current status and future directions. Magn Reson Imaging 2015;33(1):1-25.
Figures