3678
Phase processing for quantitative susceptibility mapping of regions with large susceptibility and lack of signal1Medical Physics Unit, McGill University, Montréal, QC, Canada, 2Biomedical Engineering, McGill University, Montréal, QC, Canada, 3Research Institute of the McGill University Health Centre, Montréal, QC, Canada
Synopsis
Phase unwrapping and background removal algorithms directly impact quantitative susceptibility maps. Phase processing techniques have been thoroughly studied for brain applications, but accuracy in the presence of large susceptibility and negligible signal, such as bone and air regions, is unknown. The performance of phase processing algorithms was evaluated quantitatively in simulations with a numerical head phantom and qualitatively in vivo in three head datasets. In these experiments, Laplacian-based unwrapping performed poorly. Accurate background removal remains an open question. Results suggest that Quality-Guided unwrapping should be preferred with background removal using Projection onto Dipole Fields.
PURPOSE
Phase processing impacts the accuracy of Quantitative Susceptibility Mapping (QSM)1. Phase unwrapping removes discontinuities due to the cyclic nature of phase, while background removal isolates local field variations. Different techniques have been proposed and applied, mostly in brain. There is strong interest in QSM for situations where large susceptibility variations (Δχ) are expected, such as outside of the brain, but the transfer of techniques from brain to regions with large Δχ and negligible signal remains an open question. This work compared the accuracy of unwrapping and background removal algorithms around regions with large Δχ and no signal, and evaluated their impact on the susceptibility estimated using the Iterative Phase Replacement (IPR) algorithm2.METHODS
For unwrapping, we compared 1) a Region-Growing (RG) method3,4, 2) a Continuous Laplacian algorithm (CL)4,5, and 3) our implementation of Quality-Guided (QG) unwrapping6,7. For background removal, we compared: 1) Laplacian Boundary Value (LBV)4,8, 2) Projection onto Dipole Fields (PDF)4,9, 3) Sophisticated Harmonic Artefact Reduction for Phase Data (SHARP)10, 4) Regularization Enabled Sophisticated Harmonic Artefact Reduction for Phase Data (RESHARP)11, and 5) 3D quadratic polynomial field removal, as previously proposed for large Δχ 2.
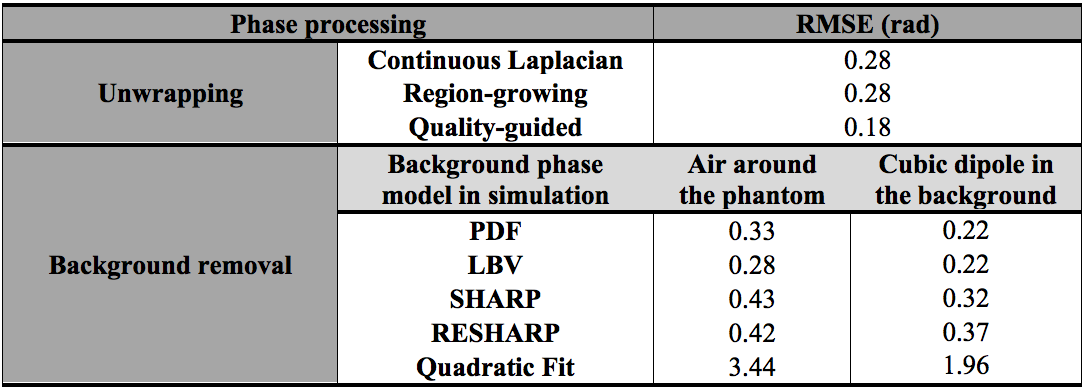
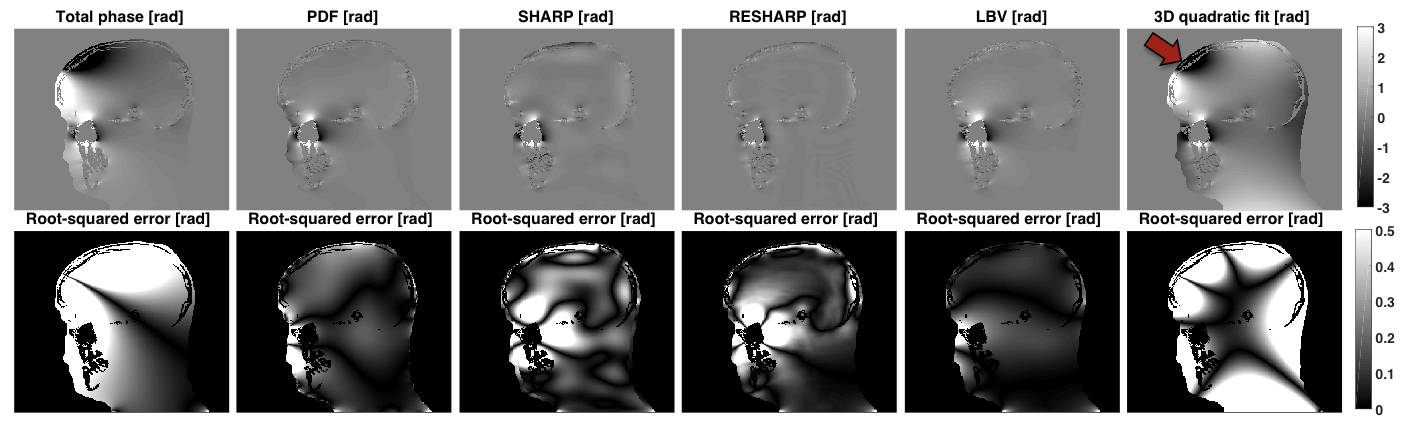
Simulations were performed in a numerical head phantom composed of soft tissue (0.001 ppm), air (9.4 ppm), and bone (-2.5 ppm). Significant background field perturbations at a short echo time (TE) were added 1) by simulating the entire phantom in air, and 2) by adding a cube of strong susceptibility in the background (300 ppm)12. The induced phase (3 T, TE=2.3 ms) was calculated2. The performance of each method was evaluated through the Root-Mean-Square Error (RMSE) from the true phase. A qualitative comparison was performed in vivo in three whole head datasets (3 T, TE1=2.3 ms, ΔTE=2.3 ms, 3 echoes). In all cases, air cavities and bone structures were included in the Region Of Interest (ROI) to preserve their phase perturbations.
Susceptibility maps were calculated using the IPR algorithm. A ROI defined in the maxillary sinus was used to evaluate the mean susceptibility in air.
RESULTS
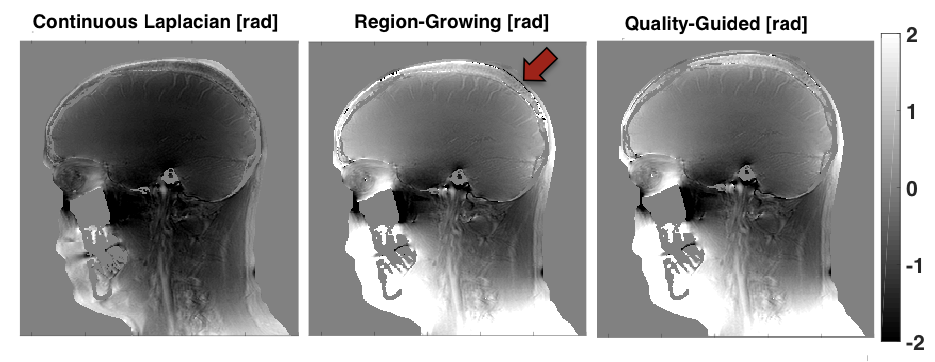
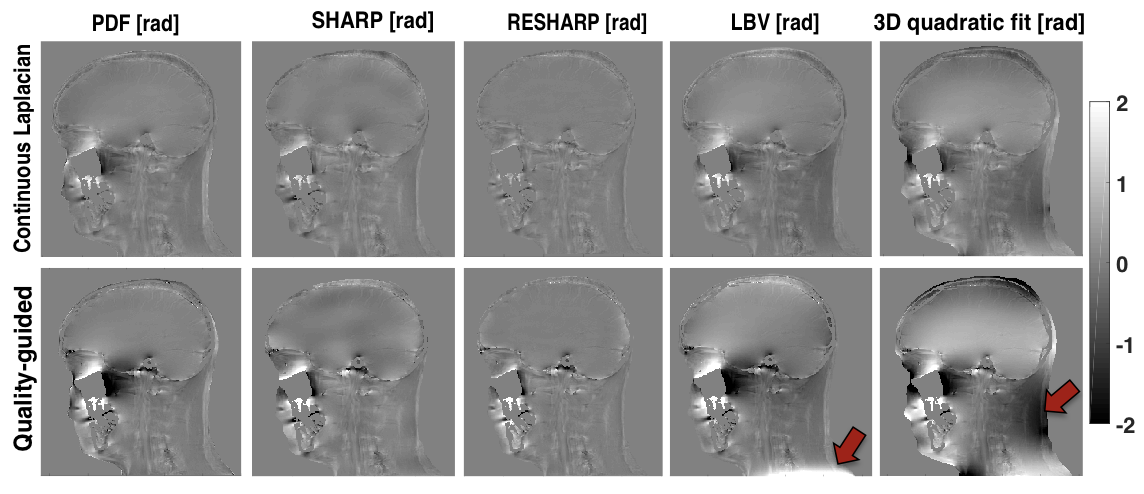
QG unwrapping was the most accurate in simulations (Table 1). CL was not appropriate, removing phase variations around air cavities needed to accurately recover their susceptibility with IPR. QG and RG resulted in similar errors around sinuses but errors were much larger with RG, as reflected by the RMSE. For background removal (Table 1 and Figure 1), PDF and LBV gave the most accurate results for both simulated background fields. SHARP and RESHARP both removed important phase variations around sinuses. The 3D quadratic fit method was the least accurate. Finally, in vivo results were consistent with simulations for unwrapping (Figure 2) and background removal (Figure 3), except that LBV showed a remnant background phase at the bottom of the neck, possibly due to phase contributions from the body that were not simulated. PDF thus seemed to be more robust in the presence of multiple background sources.
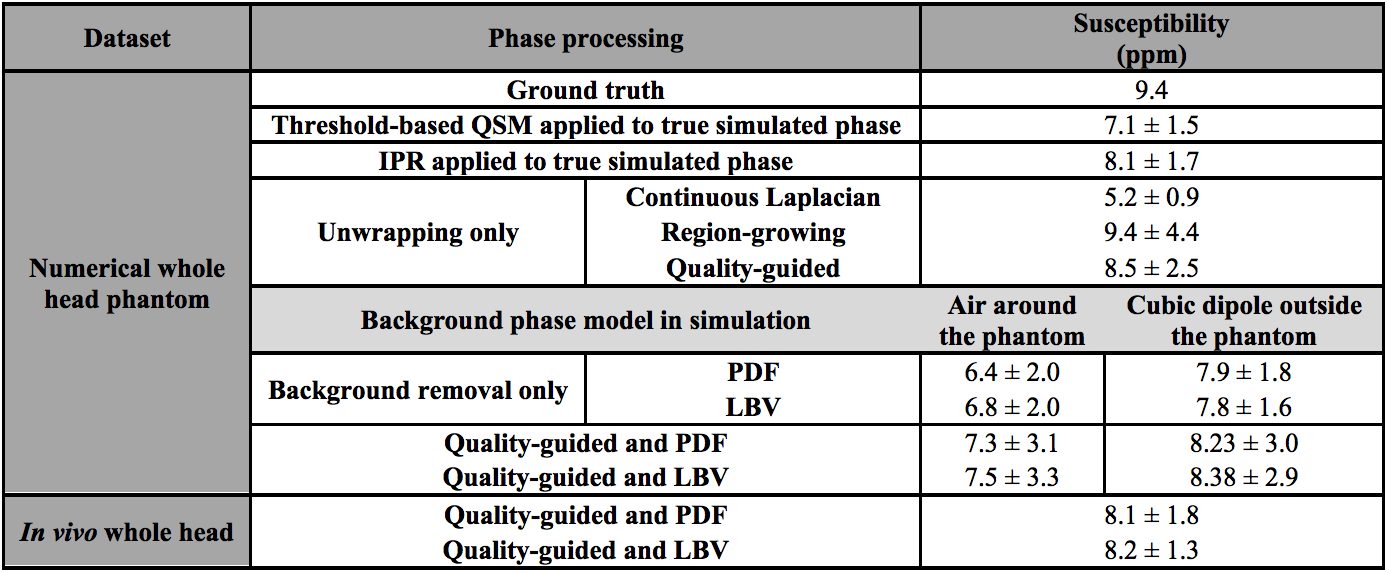
The performance of QSM with IPR in simulations was evaluated through the mean air susceptibility (Table 2). With the non-wrapped simulated phase, IPR underestimated the high susceptibility of air, consistent with other reports13, but outperformed threshold-based QSM14. On wrapped simulation data, QG+IPR was closest to the expected value when accounting for the limitations of IPR. RG+IPR resulted in apparently accurate air susceptibility, but this was likely due to higher variability induced by phase errors around the sinuses that introduced streaking artefacts in the QSM. CL+IPR greatly underestimated the susceptibility, due to the incorrectly reduced phase, consistent with other reports15. PDF and LBV had a similar impact on the IPR susceptibility. Susceptibility was systematically underestimated in the presence of larger background fields. The air susceptibility obtained in vivo with QG followed by PDF or LBV was close to the expected value from simulation. The smaller variability obtained compared to simulation is possibly due to the unrealistic background phase introduced in simulations and to the simplicity of the phantom.
DISCUSSION
CL unwrapping should be avoided for regions with no signal and large Δχ because of the phase attenuation (akin to background removal) that results from this unwrapping. QG unwrapping was more robust and accurate in simulations, with fewer phase discontinuities in vivo than RG. All background removal algorithms tested resulted in important phase inaccuracies, suggesting that techniques used for brain do not translate well to situations where high susceptibility variations are expected. Background removal remains an open question for large Δχ. From the methods currently proposed, QG followed by PDF should be used for large Δχ to reduce the susceptibility inaccuracy introduced by phase processing.Acknowledgements
Fonds de Recherche Québec – Nature et Technologies, Montreal General Hospital Foundation, NSERC-CREATE MPRTN grant 432290, Guillaume Gilbert (Philips Healthcare), Cornell MRI Research lab (MEDI toolbox), and Sagar Buch and E. Mark Haacke for their assistance with the IPR algorithm.References
1. Wang, Y., & Liu, T. (2015). Quantitative susceptibility mapping (QSM): decoding MRI data for a tissue magnetic biomarker. Magnetic resonance in medicine, 73(1), 82-101;
2. Buch, S., Liu, S., Ye, Y., Cheng, Y. C. N., Neelavalli, J., & Haacke, E. M. (2015). Susceptibility mapping of air, bone, and calcium in the head. Magnetic resonance in medicine, 73(6), 2185-2194;
3. Ghiglia, D. C., & Pritt, M. D. (1998). Two-dimensional phase unwrapping: theory, algorithms, and software (Vol. 4). New York: Wiley;
4. Liu, J., Liu, T., de Rochefort, L., Ledoux, J., Khalidov, I., Chen, W., ... & Wang, Y. (2012). Morphology enabled dipole inversion for quantitative susceptibility mapping using structural consistency between the magnitude image and the susceptibility map. Neuroimage, 59(3), 2560-2568;
5. Schofield, M. A., & Zhu, Y. (2003). Fast phase unwrapping algorithm for interferometric applications. Optics letters, 28(14), 1194-1196;
6. Abdul-Rahman, H. S., Gdeisat, M. A., Burton, D. R., Lalor, M. J., Lilley, F., & Moore, C. J. (2007). Fast and robust three-dimensional best path phase unwrapping algorithm. Applied optics, 46(26), 6623-6635;
7. Zhao, M., Huang, L., Zhang, Q., Su, X., Asundi, A., & Kemao, Q. (2011). Quality-guided phase unwrapping technique: comparison of quality maps and guiding strategies. Applied optics, 50(33), 6214-6224;
8. Zhou, D., Liu, T., Spincemaille, P., & Wang, Y. (2014). Background field removal by solving the Laplacian boundary value problem. NMR in Biomedicine, 27(3), 312-319;
9. Liu, T., Khalidov, I., de Rochefort, L., Spincemaille, P., Liu, J., Tsiouris, A. J., & Wang, Y. (2011). A novel background field removal method for MRI using projection onto dipole fields (PDF). NMR in Biomedicine, 24(9), 1129-1136;
10. Schweser, F., Deistung, A., Lehr, B. W., & Reichenbach, J. R. (2011). Quantitative imaging of intrinsic magnetic tissue properties using MRI signal phase: an approach to in vivo brain iron metabolism?. Neuroimage, 54(4), 2789-2807;
11. Sun, H., & Wilman, A. H. (2014). Background field removal using spherical mean value filtering and Tikhonov regularization. Magnetic resonance in medicine, 71(3), 1151-1157;
12. Li, W., Avram, A. V., Wu, B., Xiao, X., & Liu, C. (2014). Integrated Laplacian-based phase unwrapping and background phase removal for quantitative susceptibility mapping. NMR in Biomedicine, 27(2), 219-227;
13. Dixon, E., Barnes, A., Shmueli, K. (2016). Evaluation of an Iterative Phase Replacement Method for Susceptibility Mapping in Regions with No MRI Signal. ISMRM, p. 2852;
14. Tang, J., Liu, S., Neelavalli, J., Cheng, Y. C. N., Buch, S., & Haacke, E. M. (2013). Improving susceptibility mapping using a threshold-based K-space/image domain iterative reconstruction approach. Magnetic resonance in medicine, 69(5), 1396-1407;
15. Sun, H., Kate, M., Gioia, L. C., Emery, D. J., Butcher, K., & Wilman, A. H. (2015). Quantitative susceptibility mapping using a superposed dipole inversion method: application to intracranial hemorrhage. Magnetic resonance in medicine.
Figures