3676
Automatic venous vessel segmentation in high field, multi-echo SWI using Random Forests1Computational Imaging Research Lab, Department of Biomedical Imaging and Image-guided Therapy, Medical University of Vienna, Vienna, Austria, 2High Field MR Centre, Department of Biomedical Imaging and Image-guided Therapy, Medical University of Vienna, Vienna, Austria, 3Atominstitut, TU Wien, Vienna, Austria
Synopsis
A method for automatic venous vessel segmentation is presented that uses a Random Forest classifier supplied with a number of appearance and shape features computed separately from magnitude images, phase images and QSMs of a multi-echo T2*-weighted GE scan. The importance of each feature, and thus each echo, is investigated. The approach was tested on whole-brain 7T scans of four subjects, two of which were manually annotated, and was effective in segmenting both internal and surface veins.
Purpose
Susceptibility-Weighted Imaging1 (SWI) is a Magnetic Resonance Imaging (MRI) technique that exploits both the magnitude and phase of the complex MRI signal to increase contrast between tissues of different susceptibilities such as venous vessels and surrounding cortex. Identifying and segmenting veins in whole-brain SWI scans facilitates the creation of three-dimensional, patient specific models of the cerebral venous vasculature which have the potential to aid neurosurgeons in presurgical planning.
To date, automatic segmentation approaches have predominately been performed using magnitude images because of the non-local and orientation dependent properties of the phase. These effects are removed in Quantitative Susceptibility Maps2 (QSM), however, meaning that QSMs can be expected to contribute to vessel segmentation.
We propose a method for automatic venous vessel segmentation using a Random Forest3 (RF) classifier supplied with a number of appearance and shape features computed separately from magnitude images, phase images and QSMs of a multi-echo T2*-weighted gradient echo scan. This supervised machine-learning approach also enables the importance of each feature to be determined. This also allows the contribution of each echo to the classification to be assessed, raising the possibility of tailoring the acquisition to provide the most useful information for automated segmentation.
Materials and Methods
Whole-brain datasets of 4 healthy volunteers were acquired using high resolution, multi-echo 3D gradient-echo sequences on a 7T system (Siemens Magnetom) with a 32-channel head coil (Nova Medical). Acquisition parameters for the individual subjects were: (0.4x0.4x0.7mm3 and TE={8,14,21} ms) for subject s1; (0.5x0.5x1.2 mm3, TE={8,12.3,17.5} ms) for s2; and (0.7x0.7x0.7 mm3, TE={7,14,20} ms) for s3 and s4. Magnitude and phase images of the individual channels were combined using either the VRC4 (for subjects s1 and s2) or the COMPOSER approach5 (s3 and s4).Analysis
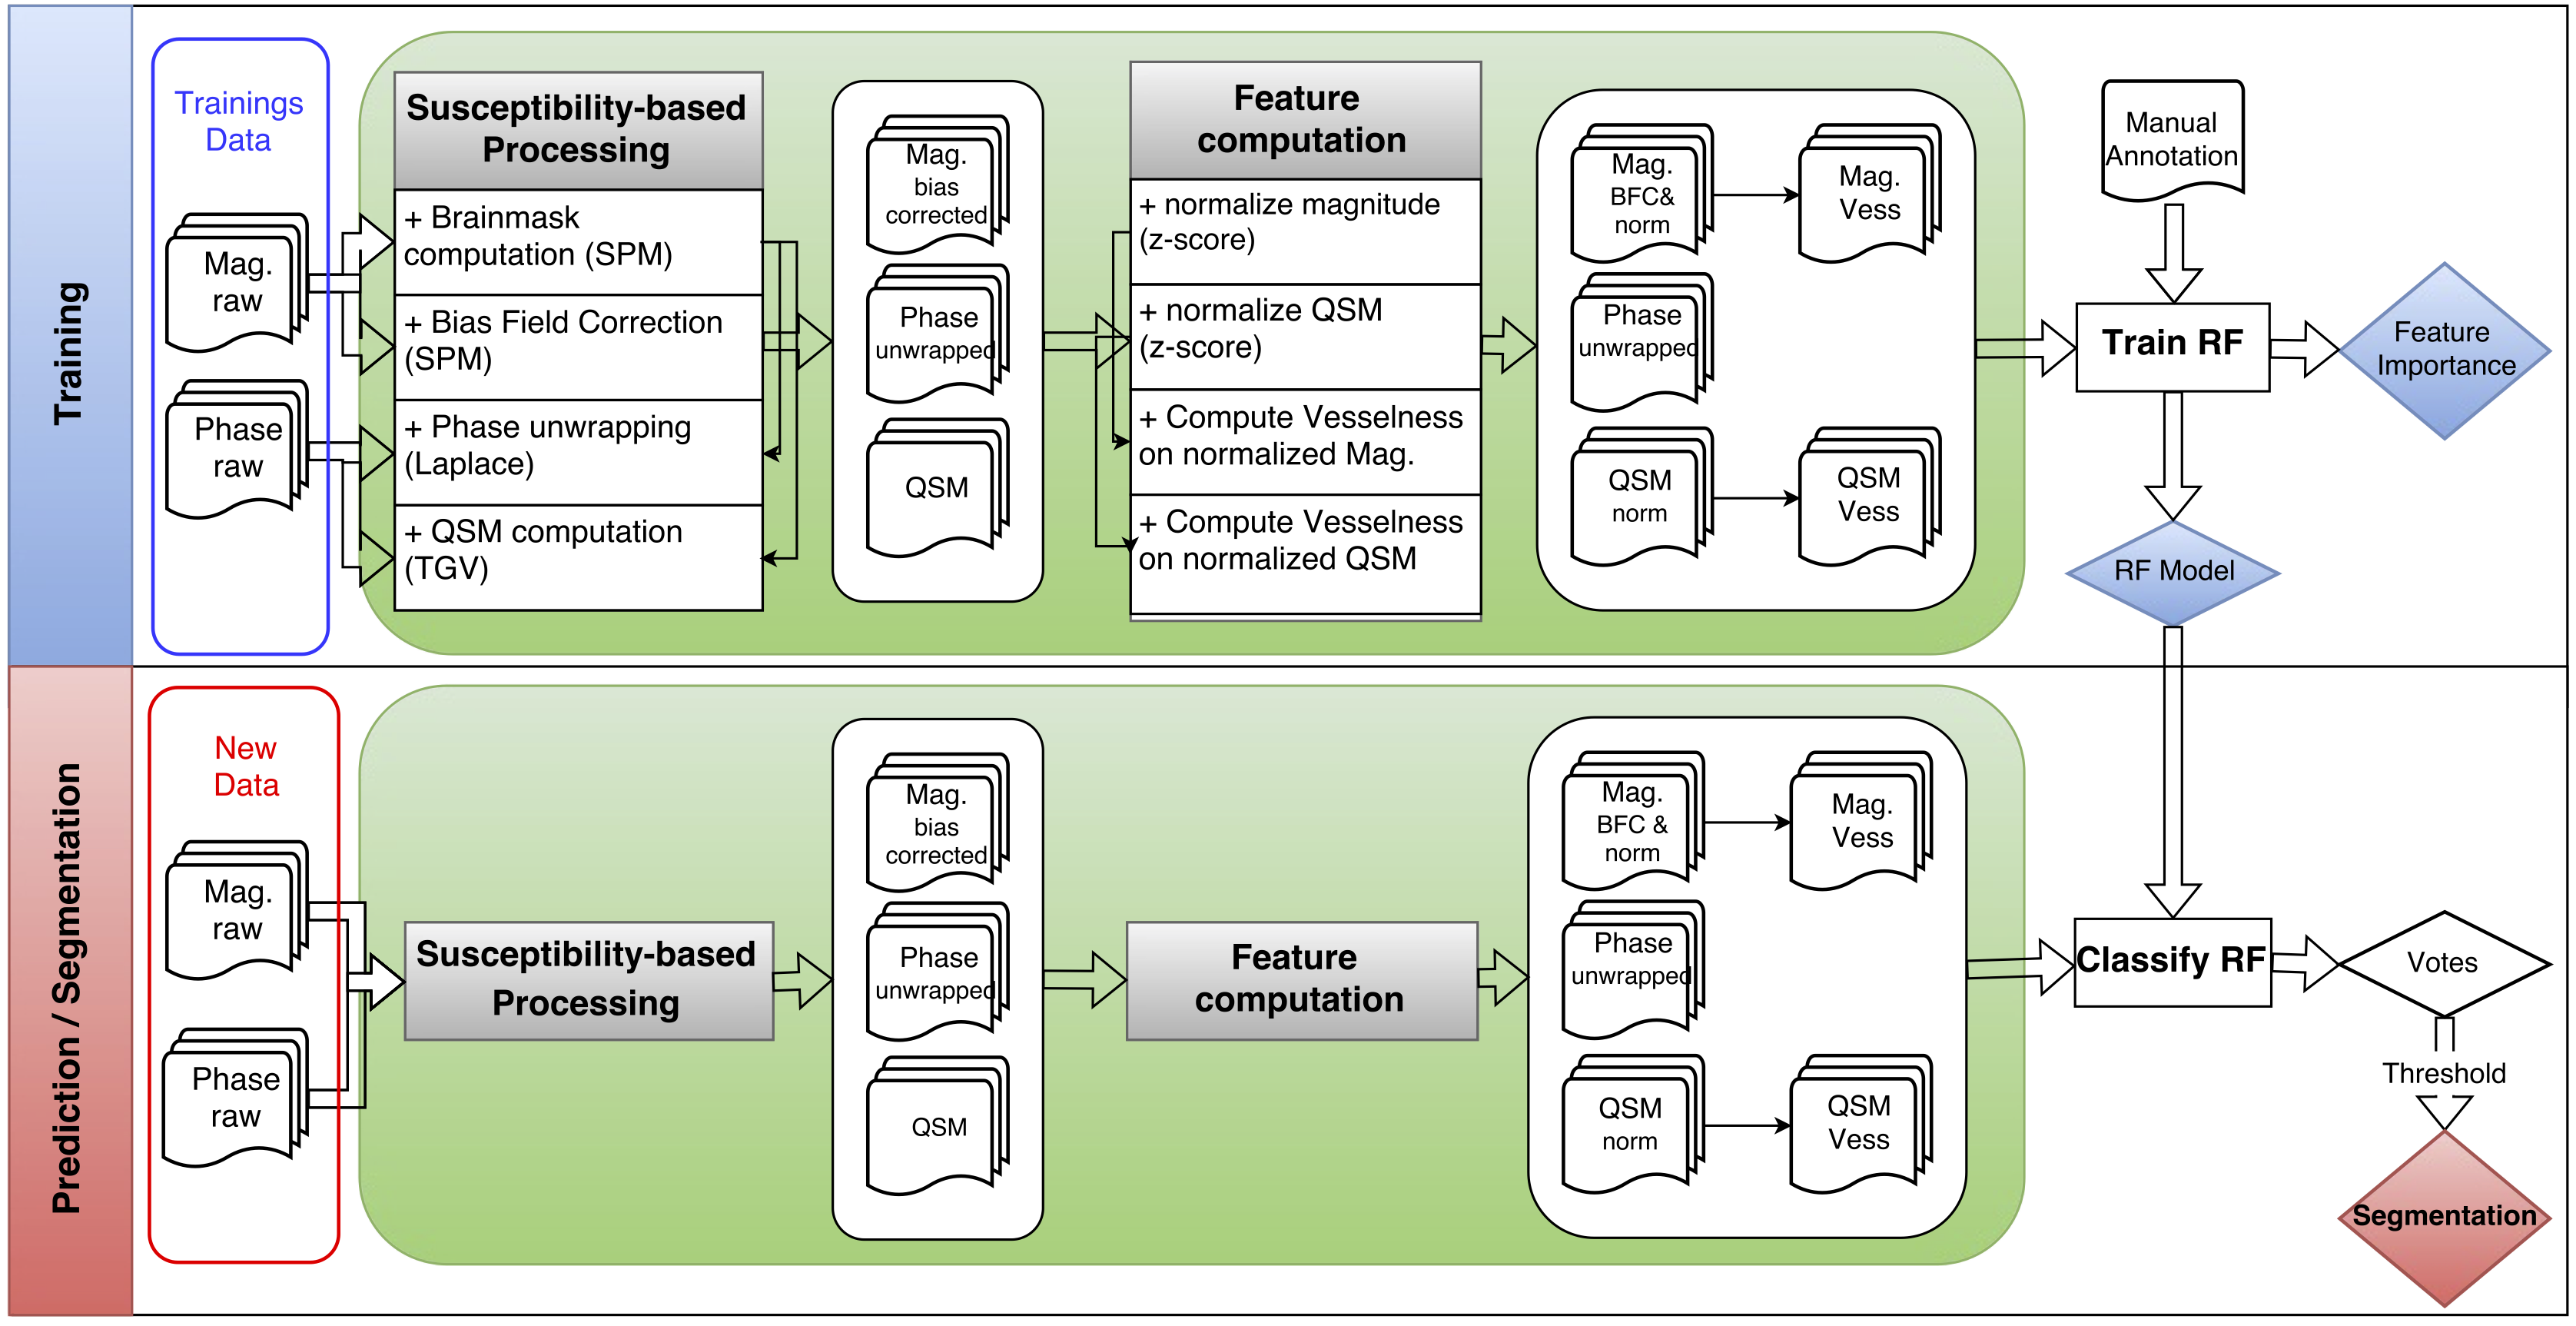
A flowchart of the processing scheme is provided in Figure 1. Biasfield correction and brainmask computation were performed using SPM12’s segmentation module. QSMs were generated with Total Generalized Variation6. Portions of two datasets (s1 and s3) were manually annotated with either a vein or a background label to serve as reference for training the RF algorithm and as gold standard for quantitative evaluation of the segmentation performance.
To get a uniform intensity distribution across different datasets, the voxel intensity values of each magnitude and QSM image were normalized using the z-score. For each voxel within the brainmask, a feature vector f(x) was generated containing the following features for each echo: the intensity values of the normalized magnitude and QSM images, the unwrapped phase value and the output of a vesselness filter7 that was computed on the normalized magnitude and normalized QSM image of each echo. This resulted in 15 features for each voxel (five per echo). Two different RF classifiers consisting of n_tree = 200 decision trees were trained separately using the labeled voxels of each of the annotated datasets.
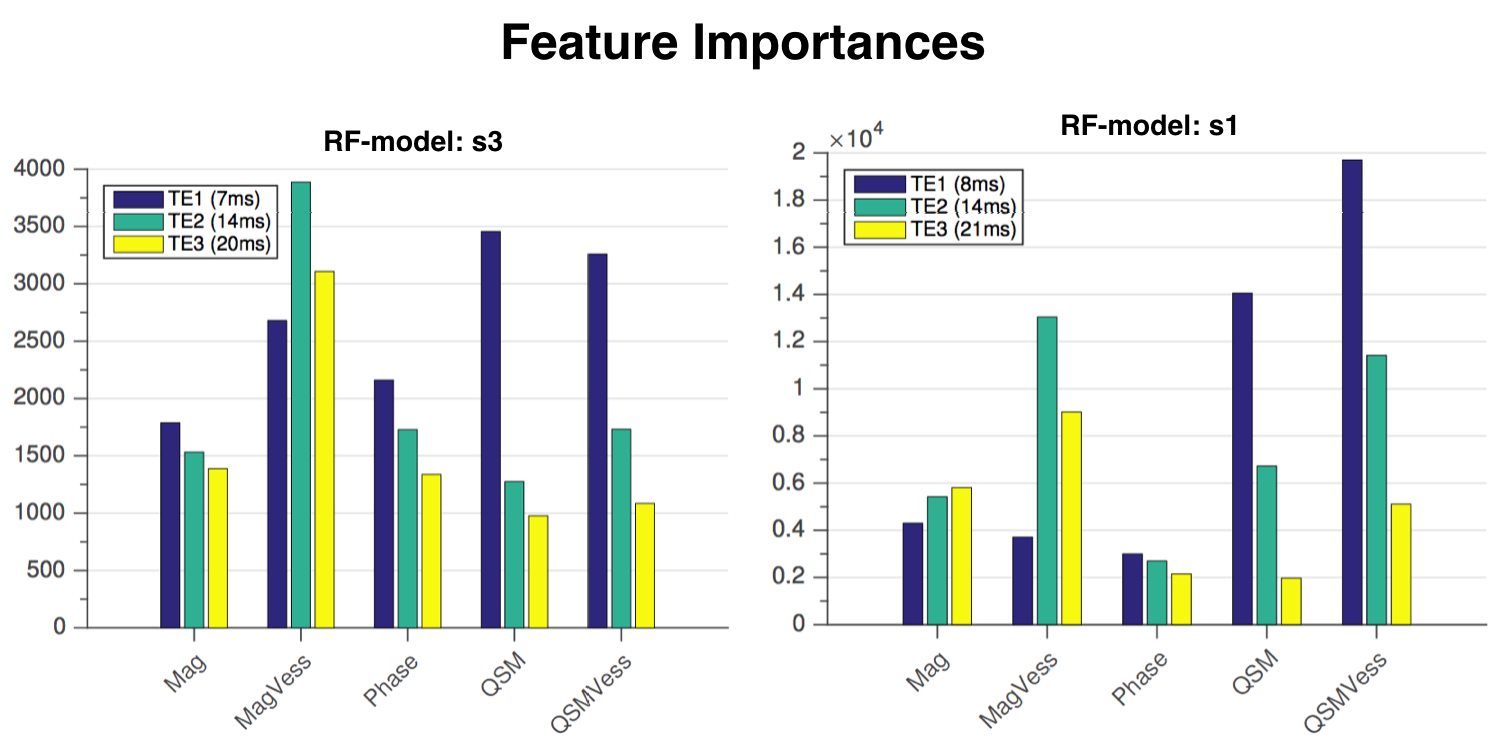
To segment veins in new data, each voxel was classified as either vein or background by the trained RF model using the same feature set as in the training step. The segmentation performance was assessed using the manual annotations of the other annotated dataset, which was not used for training. The segmentation performance was compared to segmentations obtained via thresholding the magnitude, phase, or QSM images directly or via thresholding the vesselness filtering output. The Gini importance values8 , which are obtained while training a RF, were used to assess the importance of the multi-echo magnitude, phase and QSM features for the venous vessel segmentation task.
Results
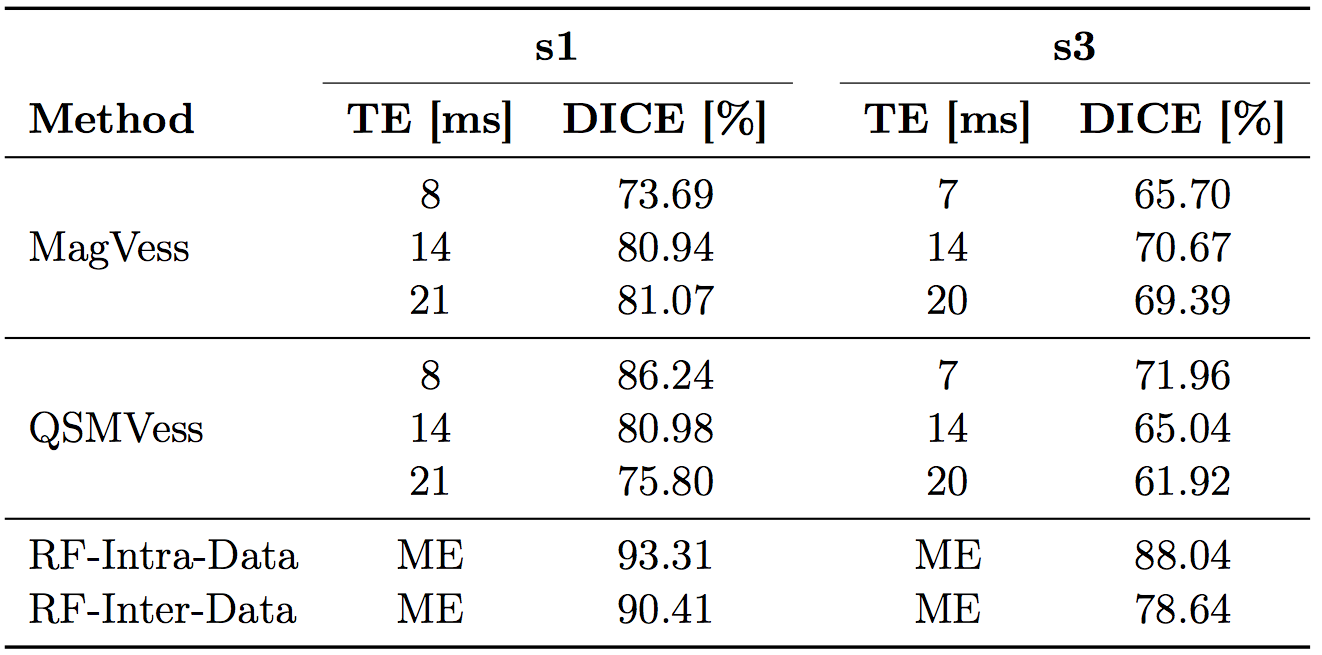
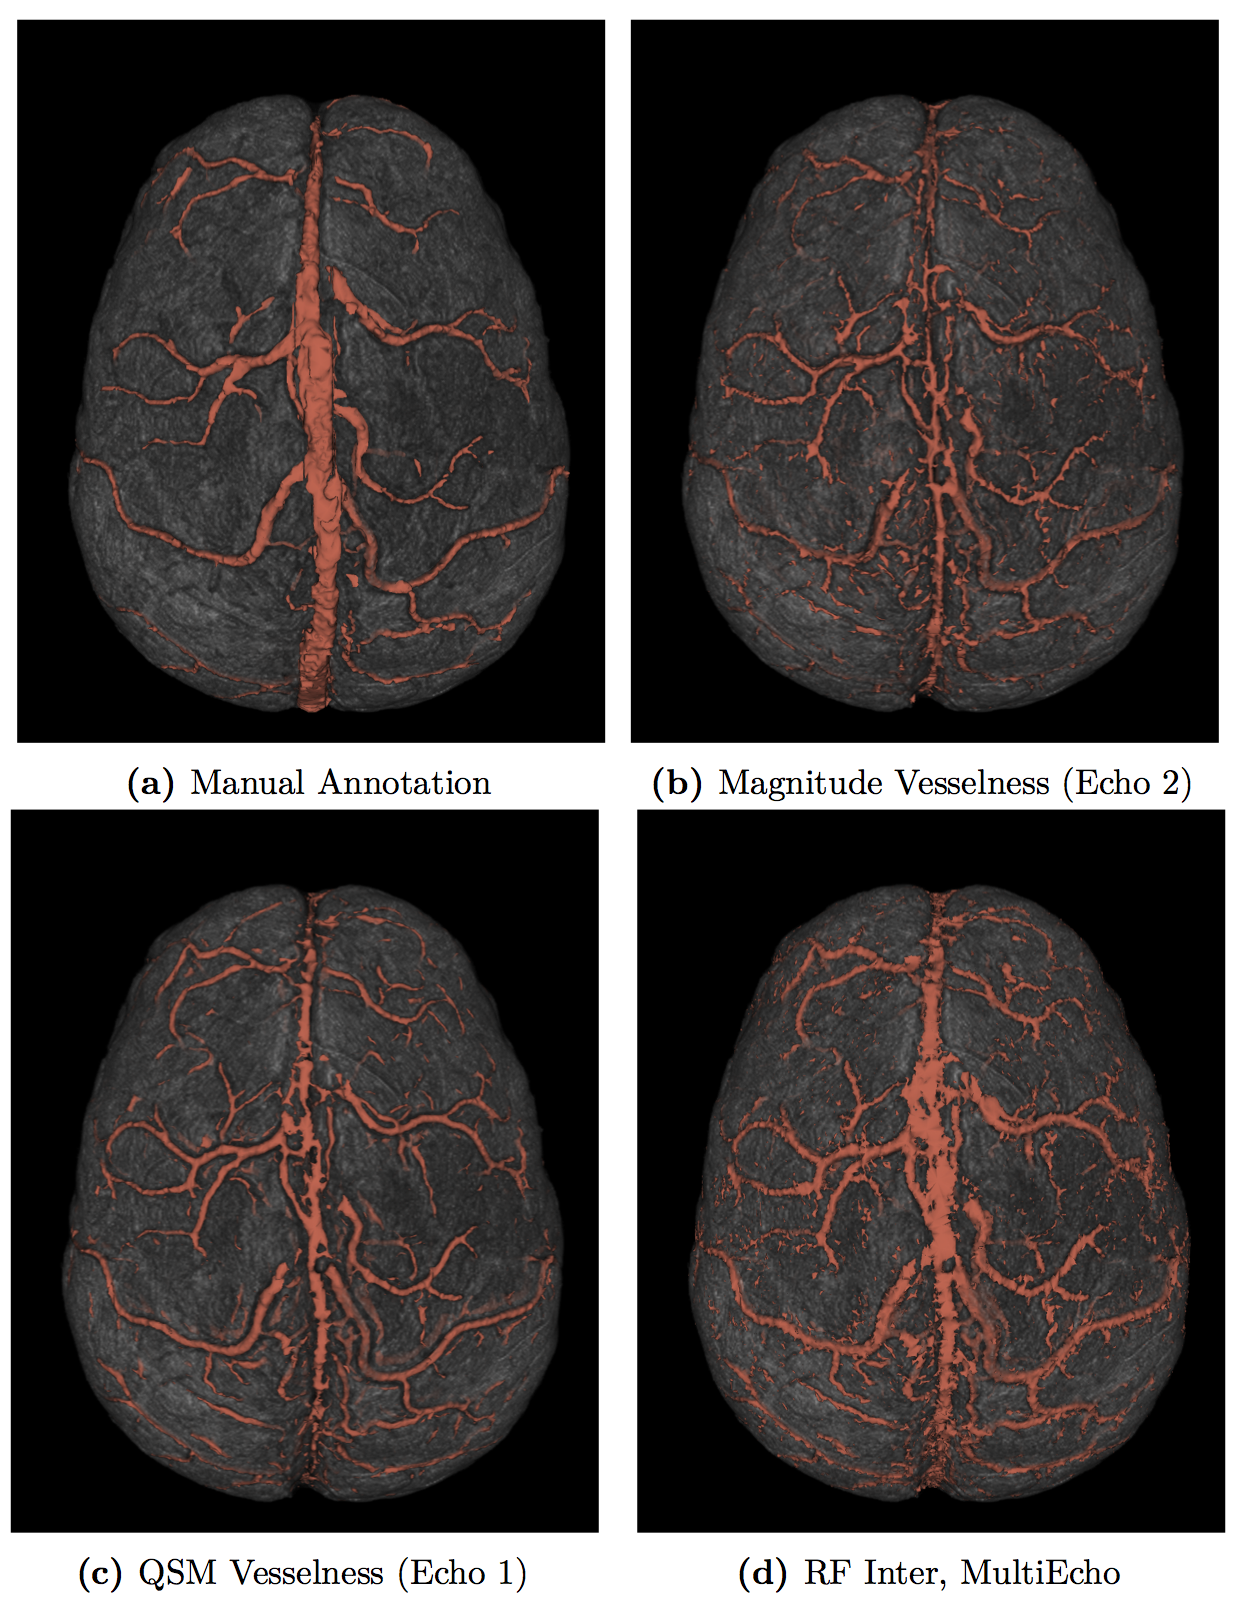
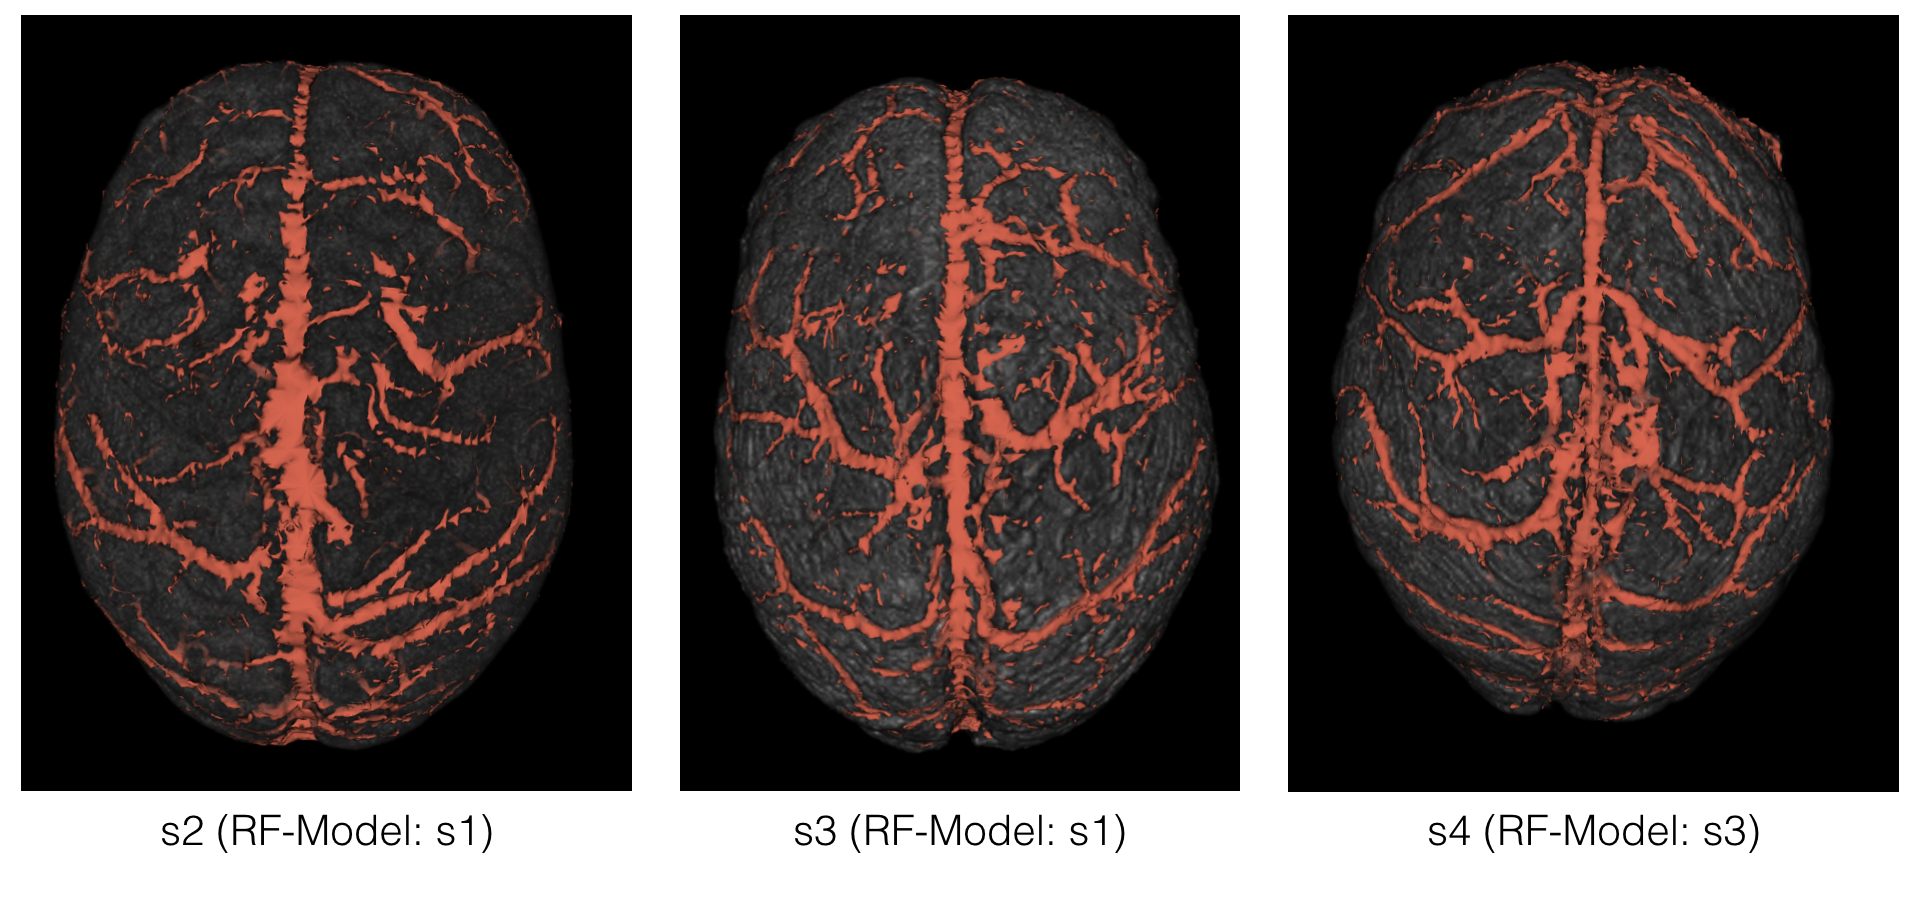
In Table 1, the evaluation scores of various segmentations compared to the manual annotations are presented. Figure 2 shows 3D renderings of surface vein segmentations of s1 obtained by the RF Approach compared with those vesselness filtering segmentations that yielded the highest scores. In Figure 3 RF segmentations of the other subjects are demonstrated and Figure 4 shows the feature importances.Discussion and Conclusion
The presented RF approach segments cerebral veins using magnitude, phase, and QSM information from a multi-echo GE scan. This resulted in more accurate segmentations than using either of those features individually. The RF models are expected to need training on relevant annotated data if acquisition parameters differ significantly, but was effective in segmenting both internal and surface veins even when the acquisition parameters differed slightly from those of the training dataset.Acknowledgements
This study was funded by the Austrian Science Fund(FWF) project KLI264.References
1. Haacke E, Xu Y, Cheng Y, Reichenbach J. Susceptibility weighted imaging (SWI). Magnetic Resonance in Medicine, 2004;52(3):612– 618
2. Shmueli K, de Zwart J, Gelderen P, Li T, Dodd S, Duyn J. Magnetic susceptibility mapping of brain tissue in vivo using MRI phase data. Magnetic Resonance in Medicine 2009;62:1510–1522
3. Breiman L. Random Forests. Machine Learning 2001;45:5–32.
4. Parker D, Payne A, Todd N, Hadley J. Phase reconstruction from multiple coil data using a virtual reference coil. Magnetic Resonance in Medicine 2014;72(2):563–569
5. Robinson S, Dymerska B, Bogner W, Barth M, Zaric O, Goluch S,Grabner G, Deligianni X, Bieri O, Trattnig S. Combining phase images from array coils using a short echo time reference scan (COMPOSER). Magnetic Resonance in Medicine 2015.
6. Langkammer C, Bredies K , Poser B, Barth M, Reishofer G, Fan A, Bilgic B, Fazekas F, Mainero C, Ropele S. Fast quantitative susceptibility mapping using 3D EPI and total generalized variation. NeuroImage 2015;111:622–630.
7. Frangi A, Niessen W, Vincken K, Viergever M. Multiscale vessel enhancement filtering. Medial Image Computing and Computer-Assisted Invervention - MICCAI 1998; Lecture Notes in Computer Science 1496:130–137
8. Archer K, Kimes R. Empirical characterization of random forest variable imporance measures. Computational Statistics & Data Analysis 2008;52:2249-2260
Figures