3673
Imaging Cerebral Arteries and Veins using Susceptibility Weighted Imaging with Ferumoxytol1The MRI Institute for Biomedical Research, Waterloo, ON, Canada, 2Radiology/Center for Biomedical Imaging, New York University School of Medicine, NY, United States, 3Department of Radiology, Wayne State University, MI, United States
Synopsis
Susceptibility weighted imaging (SWI) has been widely used to image cerebral venous structures and in vivo iron content. However, it has not been used to image arteries, because of the lack of susceptibility contrast between arteries and the surrounding tissue. In this study, the susceptibility of the arterial blood was purposely modified to make it visible with SWI, by using the USPIO (ultra-small superparamagnetic iron oxide) agent Ferumoxytol. The purpose of this study is to determine the relationship between Ferumoxytol concentration and susceptibility using phantom and simulation studies, and compare these findings with those obtained from in vivo data.
Purpose
Susceptibility weighted imaging (SWI) has been widely used to image cerebral venous structures and in vivo iron content (1,2). However, it has not been used to image arteries, because of the lack of susceptibility contrast between arteries and the surrounding tissue (1,3). In this study, the susceptibility of the arterial blood was purposely modified to make it visible with SWI, by using the USPIO (ultra-small superparamagnetic iron oxide) agent Ferumoxytol. The purpose of this study is to determine the relationship between Ferumoxytol concentration and susceptibility using simulation and phantom studies, and compare these findings with those obtained from in vivo data.Methods
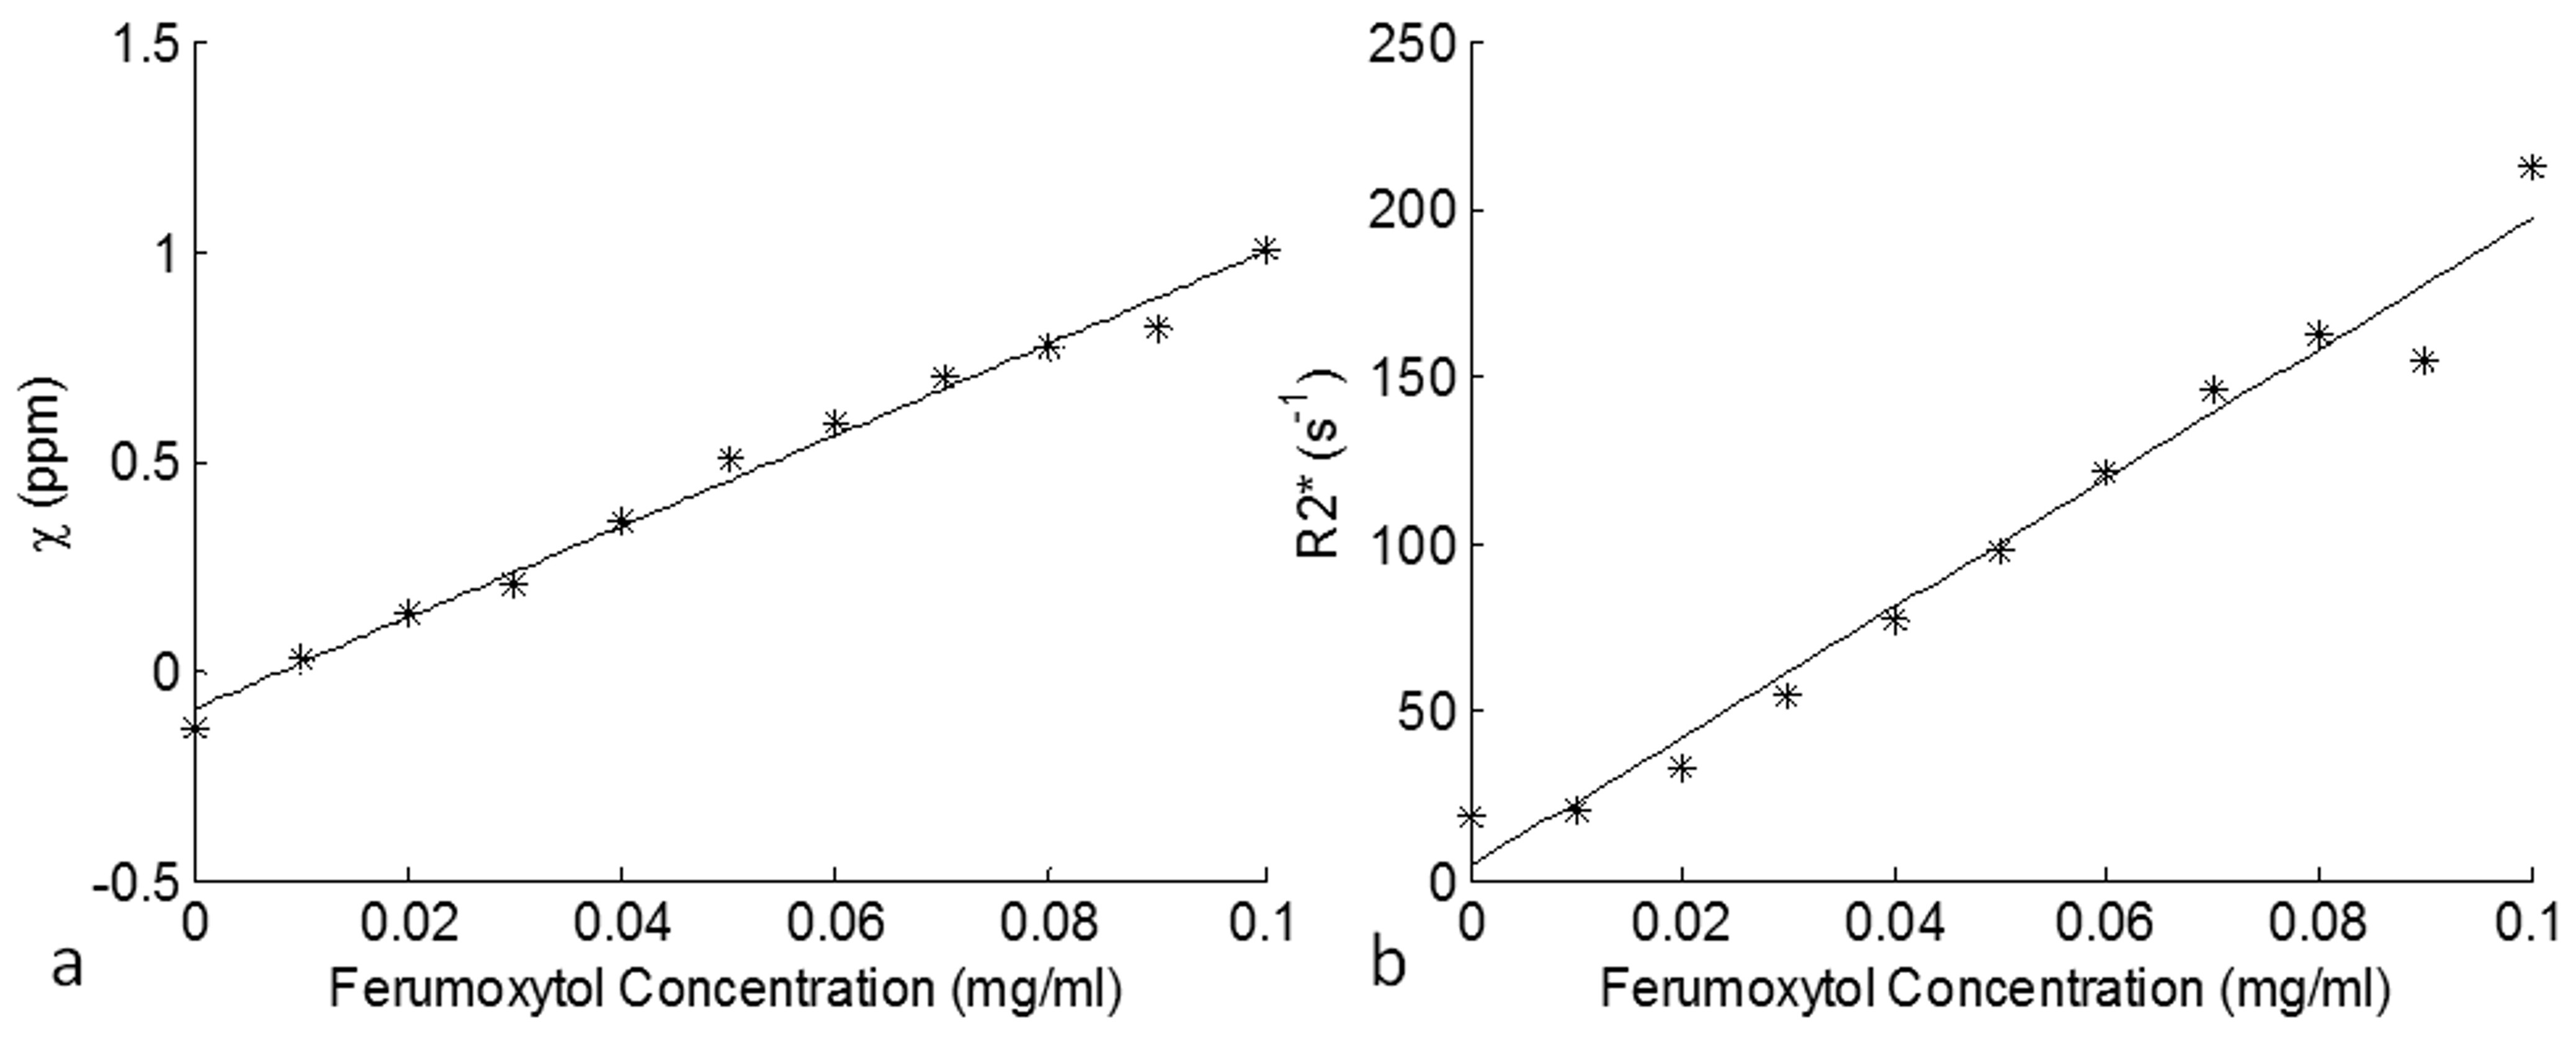
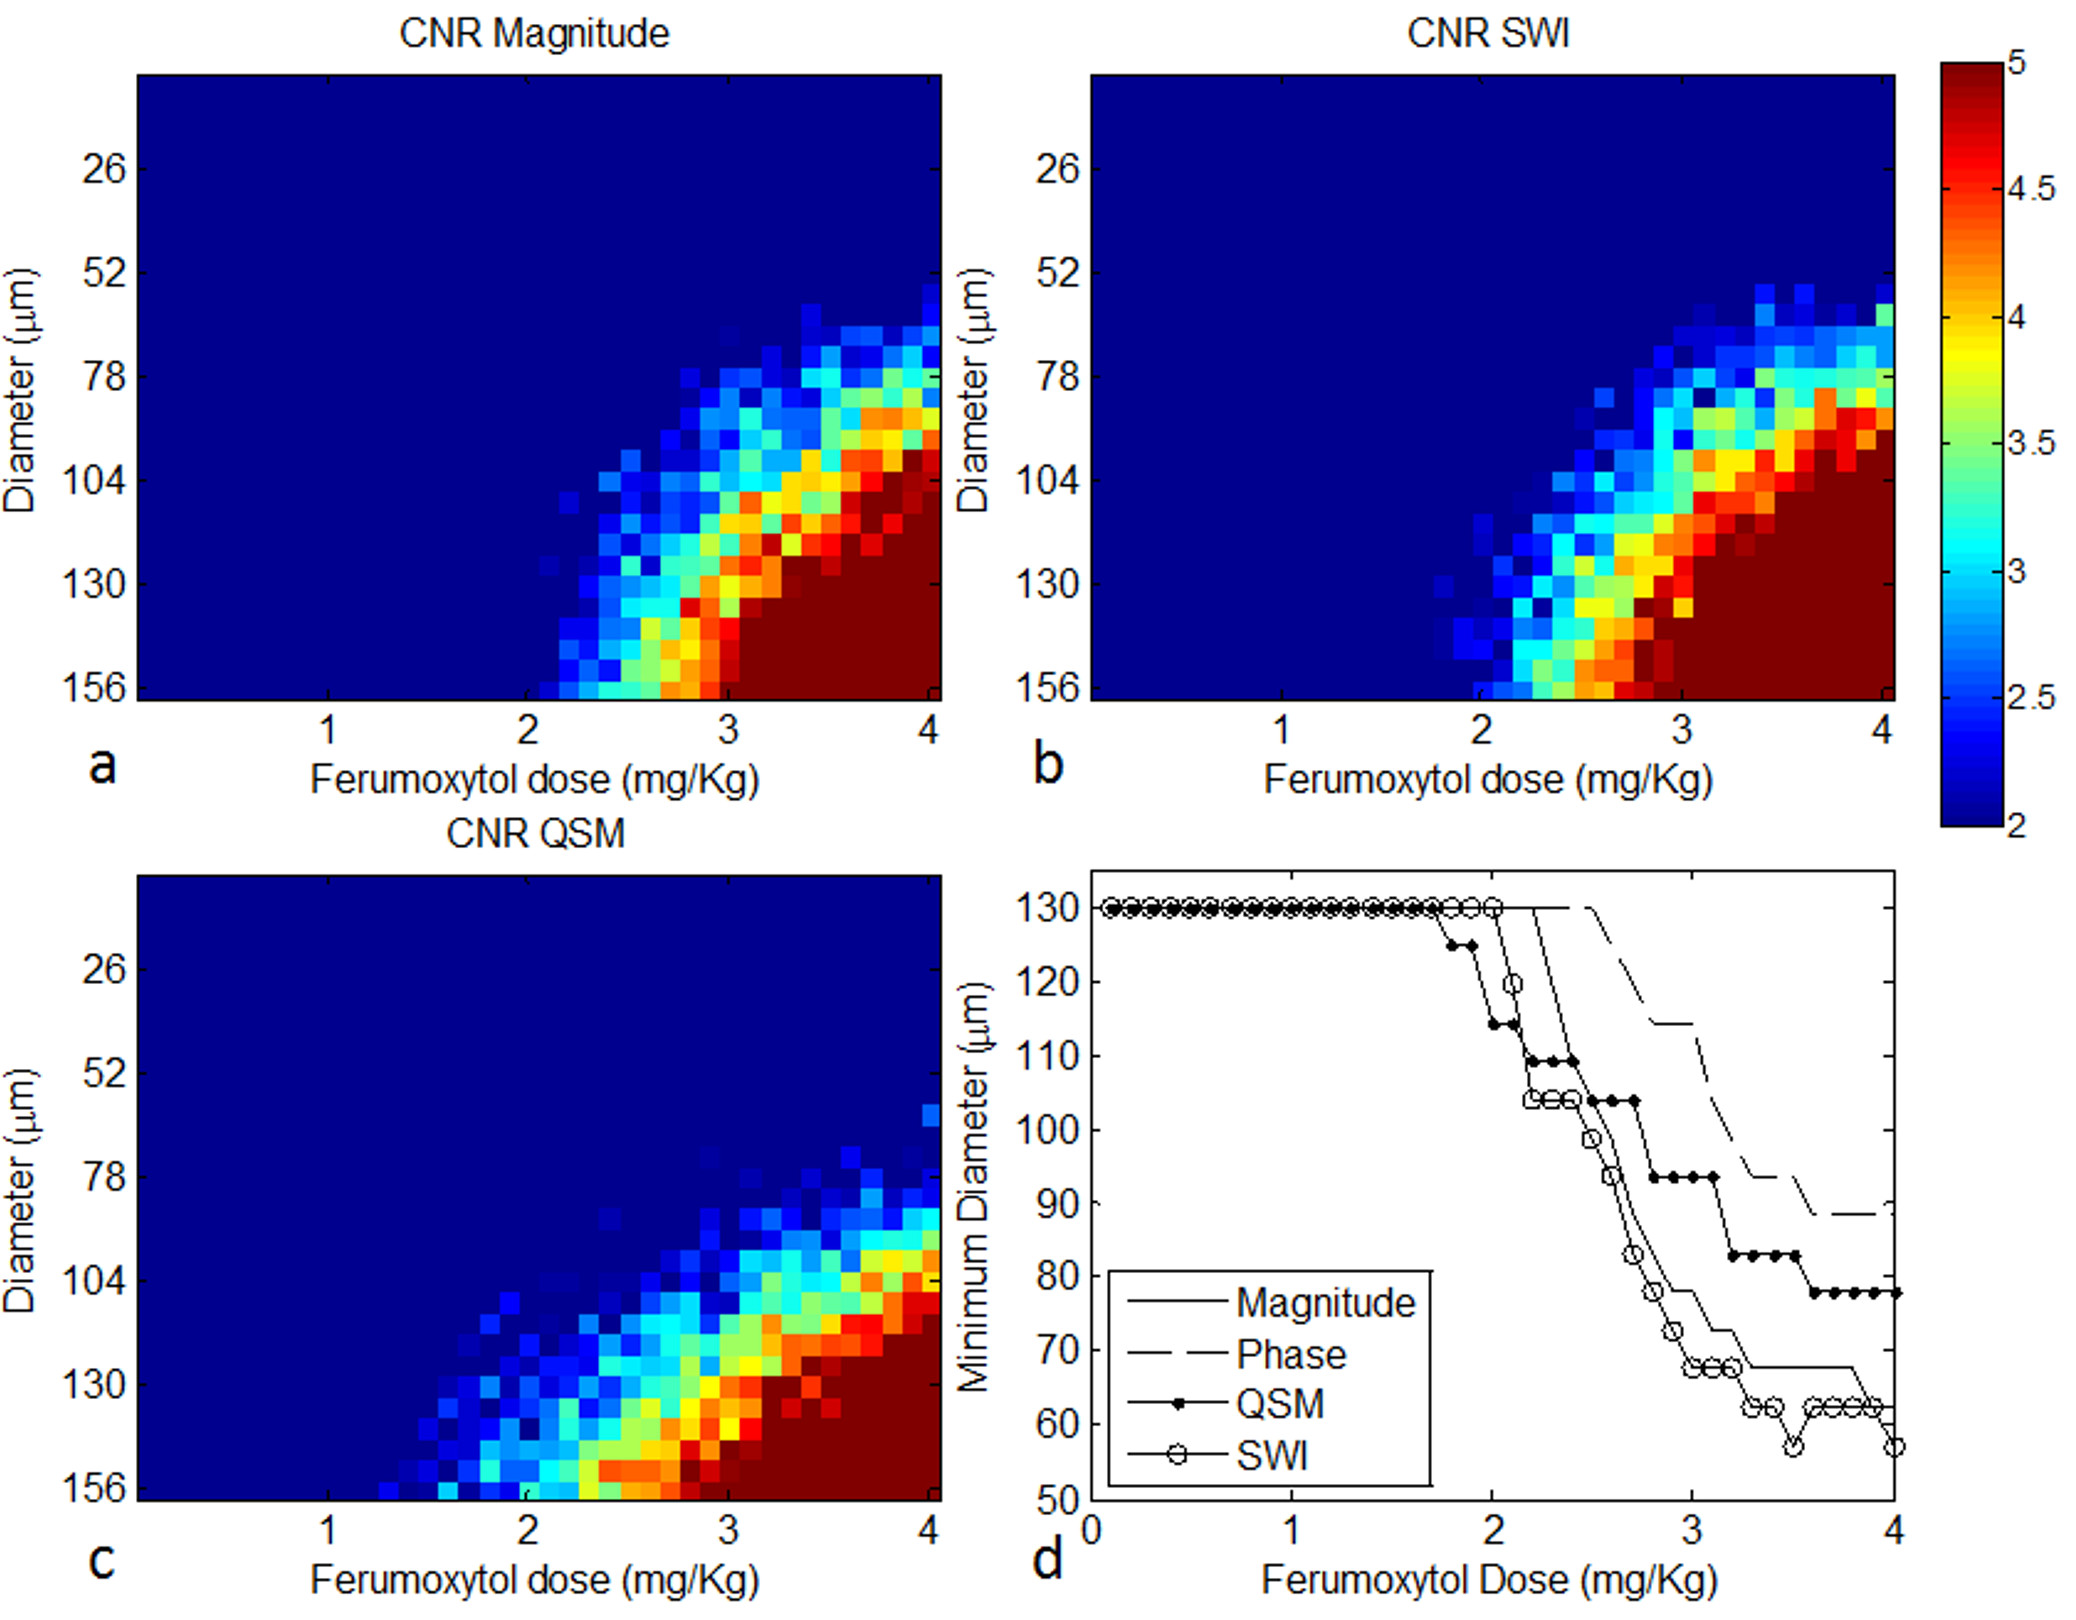
Phantom study: A phantom was prepared with Ferumoxytol concentration ranging evenly from 0.01mg/ml to 0.1mg/ml, and was scanned at 7T using a multi-echo gradient-echo sequence with TEs = 5 to 42.8ms (echo spacing 5.4ms). The phase images at TE=5ms were unwrapped using a best-path algorithm (4), the background field was removed using local 2D quadratic fitting, and the susceptibility was quantified using an iterative least squares fitting approach (5). R2* maps were generated using magnitude images with sufficiently high SNR to include a minimum of two echoes per pixel in the estimation. Simulations: Magnitude and phase images of cylinders with diameters ranging from 5μm to 156μm were simulated at 7T with pixel size=130×520μm2. The main field direction was perpendicular to the cylinder and the resolution along that direction was 520μm. Subvoxel cylinders were simulated by first creating high resolution data and then cropping the center of k-space. Each simulation setting was repeated 10 times with Gaussian noise added. CNRs of the cylinder in magnitude, phase, SWI and QSM were measured. We used the rule that a cylinder was detectable if the CNR was greater than 2:1. In vivo study: Pre-, post-1mg/kg, post-3mg/kg Ferumoxytol data were collected on a healthy volunteer at 7T, using a gradient-echo sequence with imaging parameters: TE=10ms, TR=24ms, FA=10o, BW/px = 244Hz/px, FOV=264mm×156mm, voxel size=0.13×0.22×0.8mm3. SWI images were generated using a 64x64 homodyne high-pass filter. For QSM, the phase images were unwrapped using Laplacian unwrapping (3), the background phase was removed using SHARP (6), and susceptibility maps were generated using the iterative SWIM algorithm (7). ΔR2* maps were generated using the pre- and post- Ferumoxytol magnitude images co-registered using FLIRT in FSL(8,9). Grey matter ΔR2* values were measured in the occipital and parietal lobes. For each lobe, 10 ROIs were drawn using the pre-contrast QSM data, excluding any visible vessels. The capillary blood volume fraction (λ) was calculated using the equation ΔR2* = 1/3·λ·γ·Δχ·B0 (10), where γ is the gyromagnetic ratio, Δχ the susceptibility and B0 the main field strength.
Results
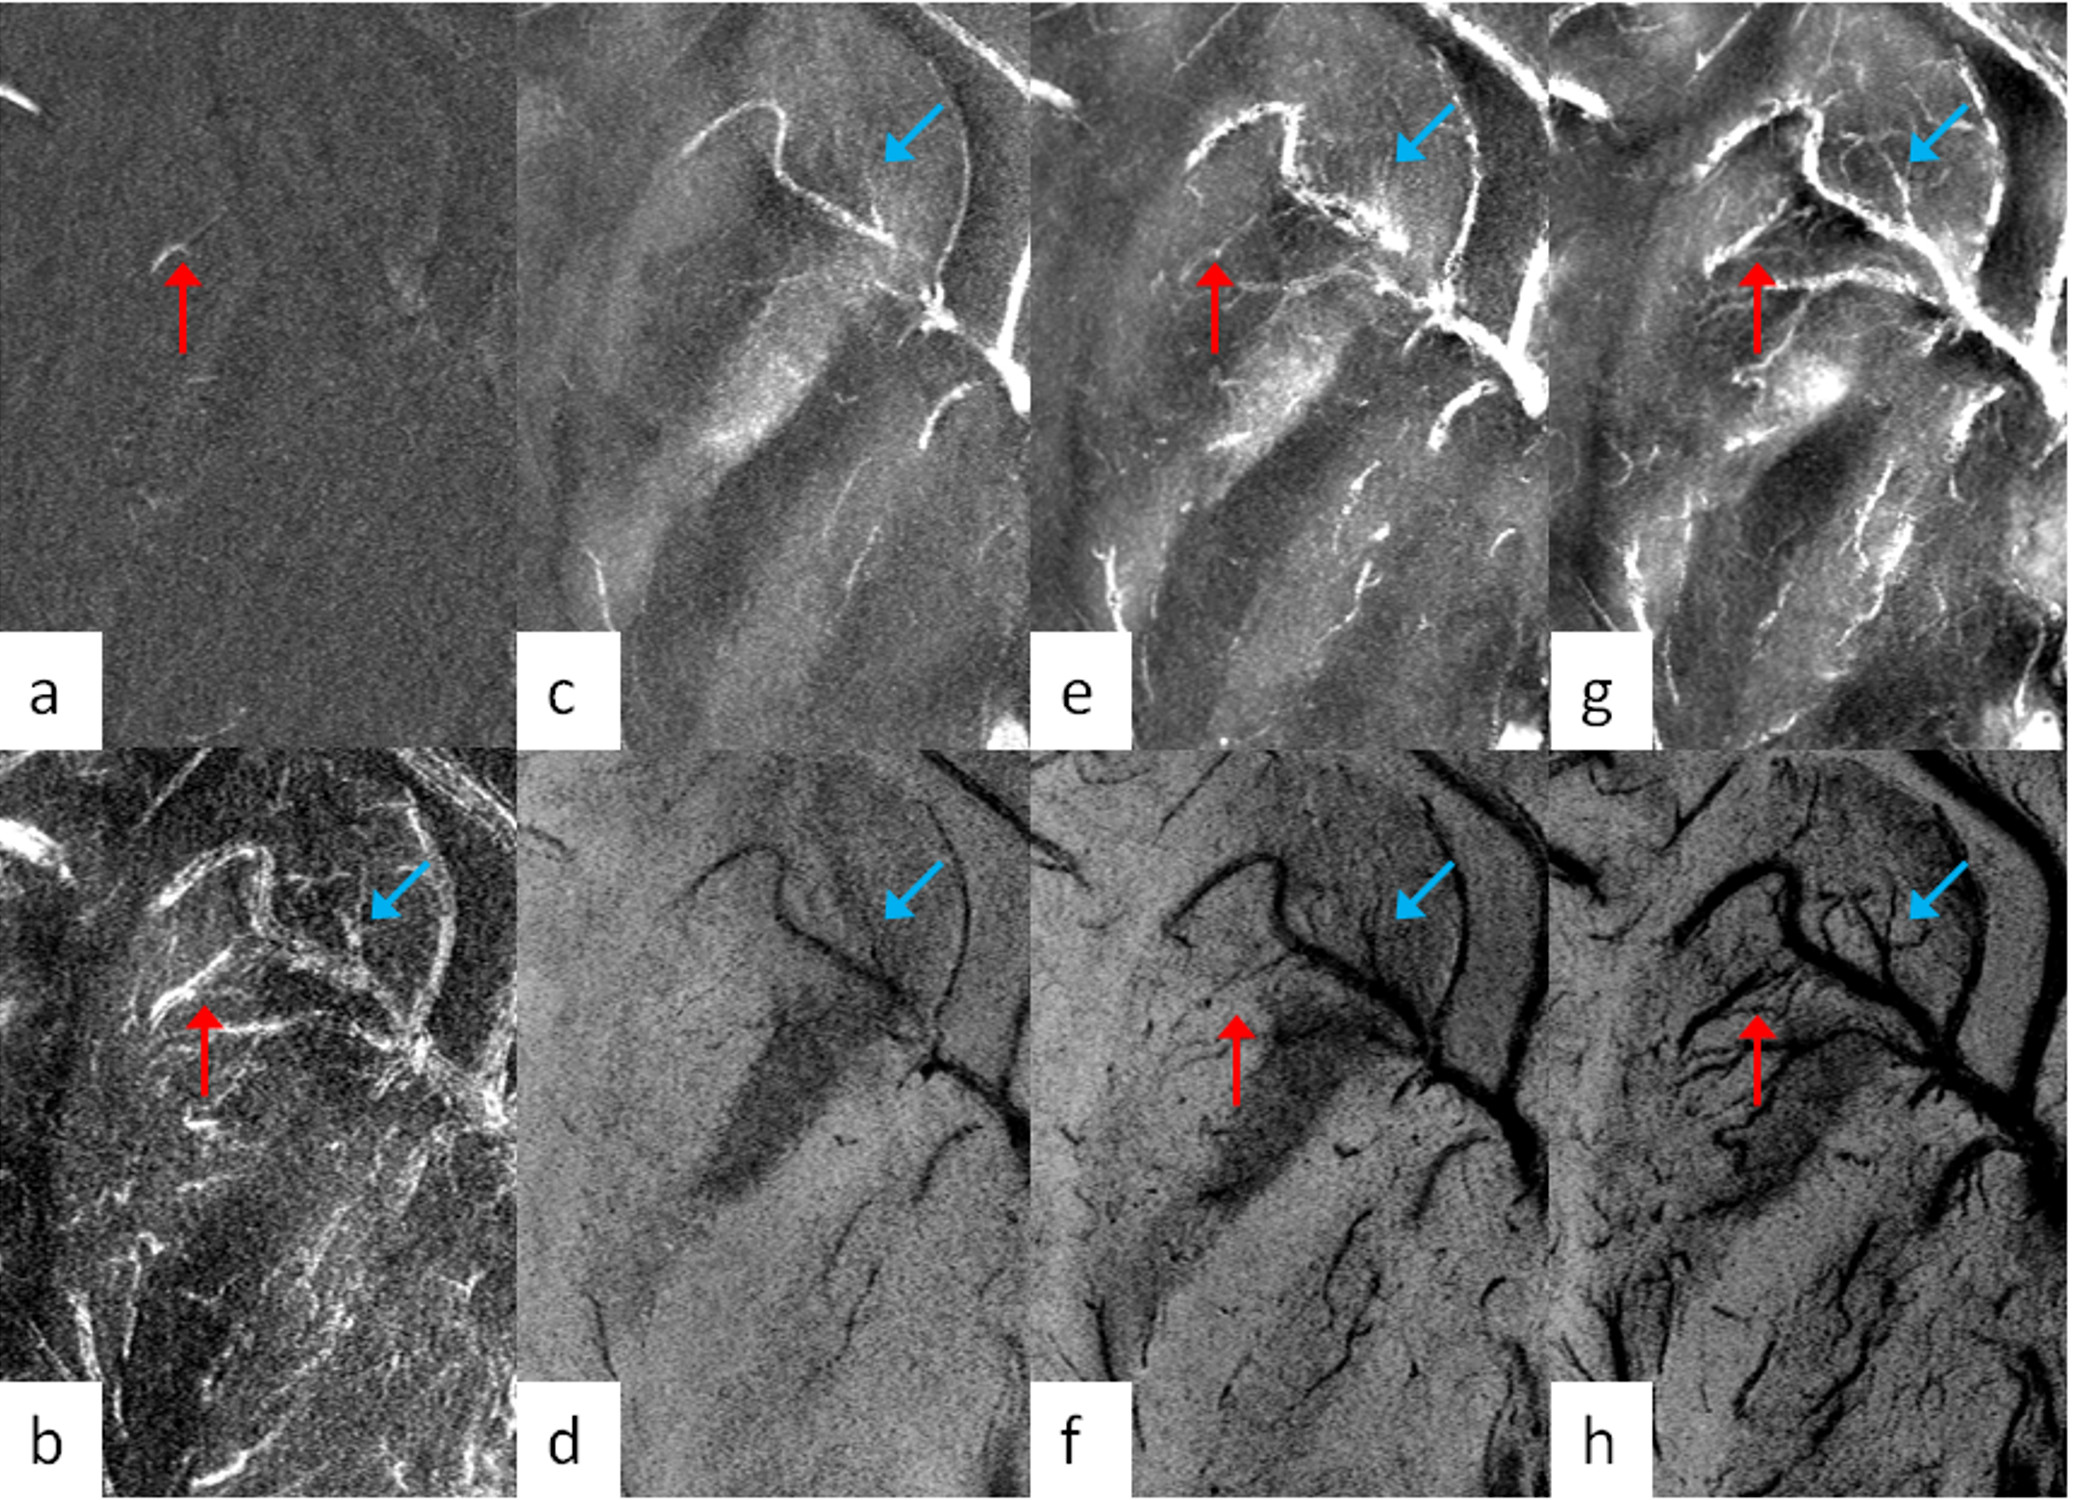
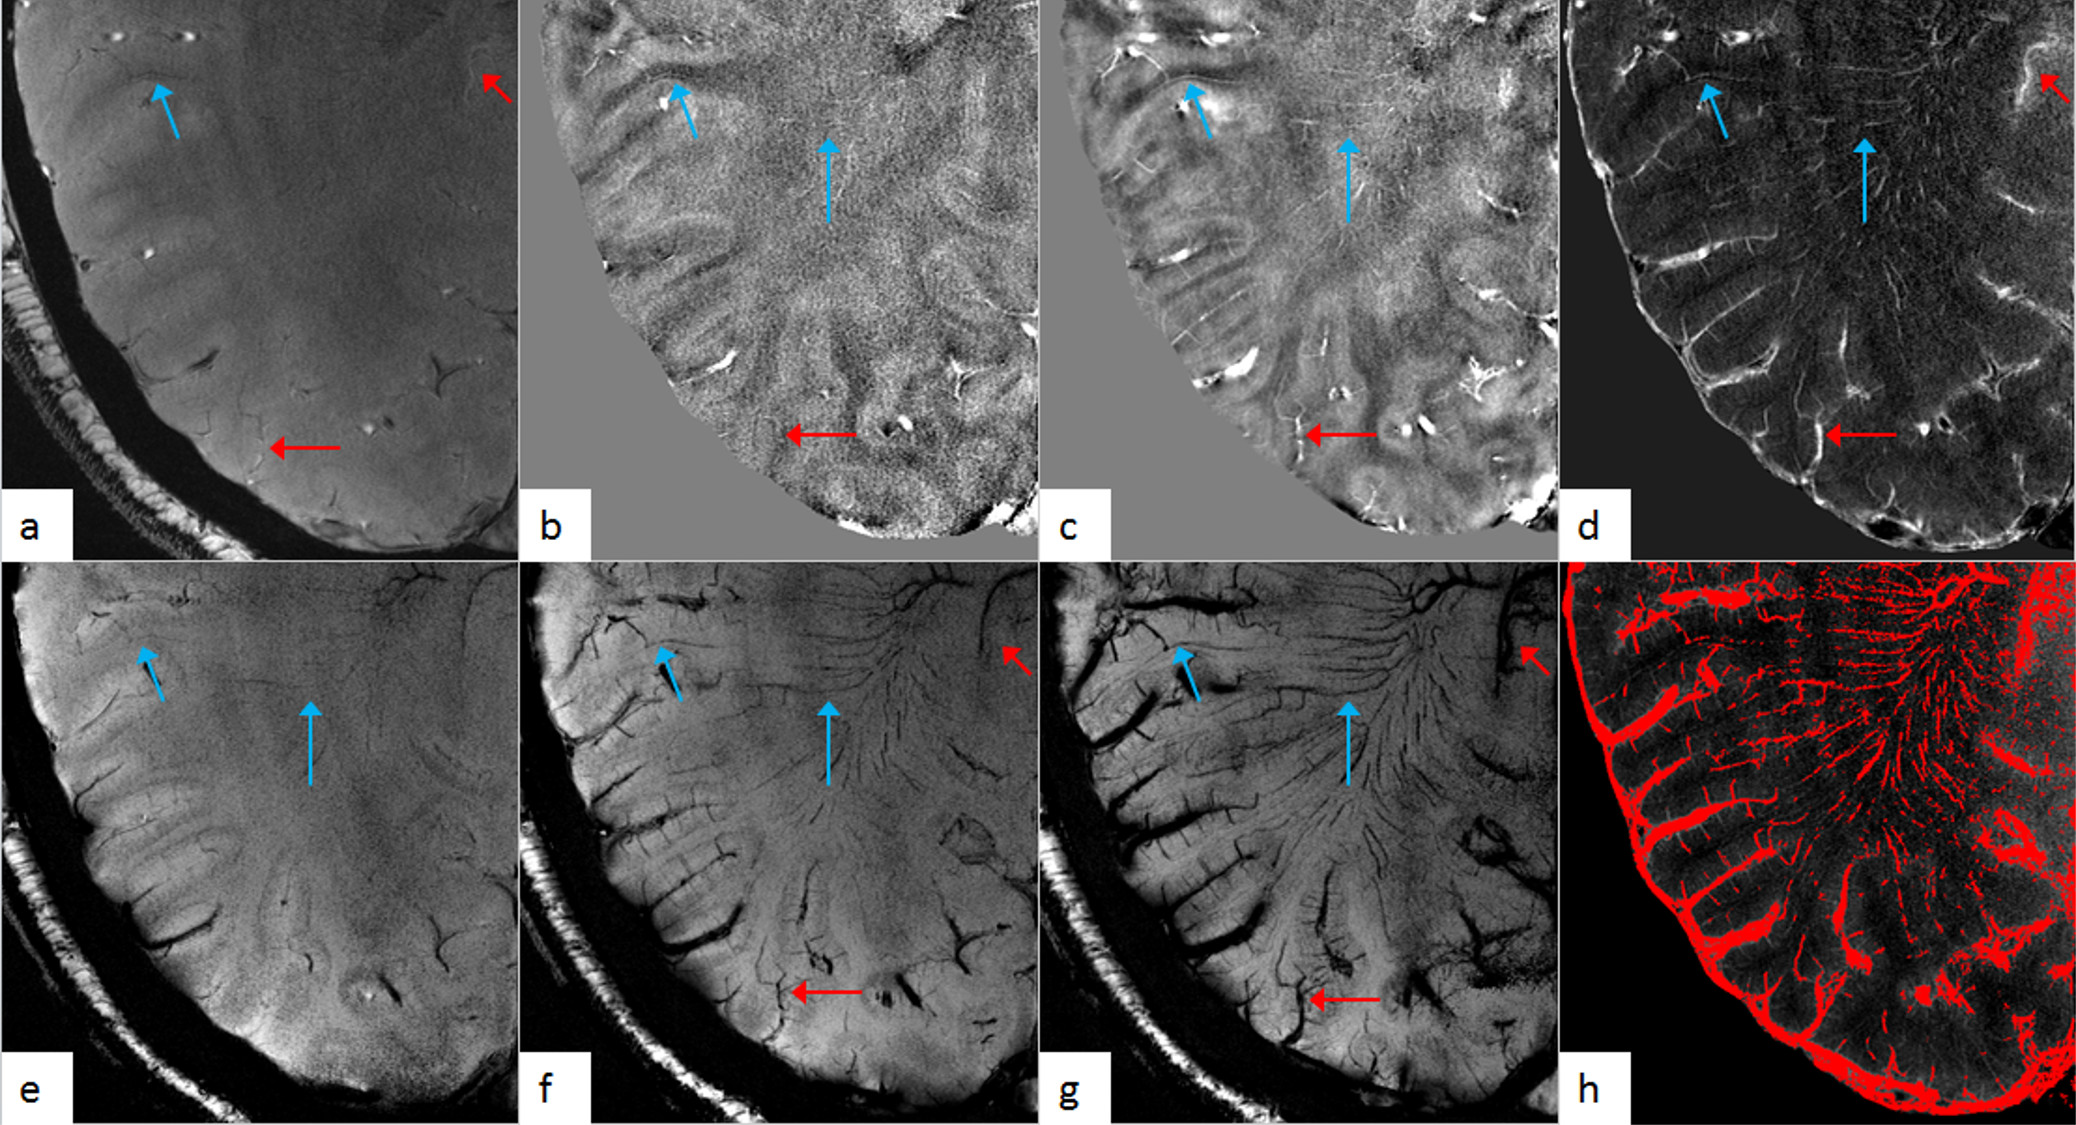
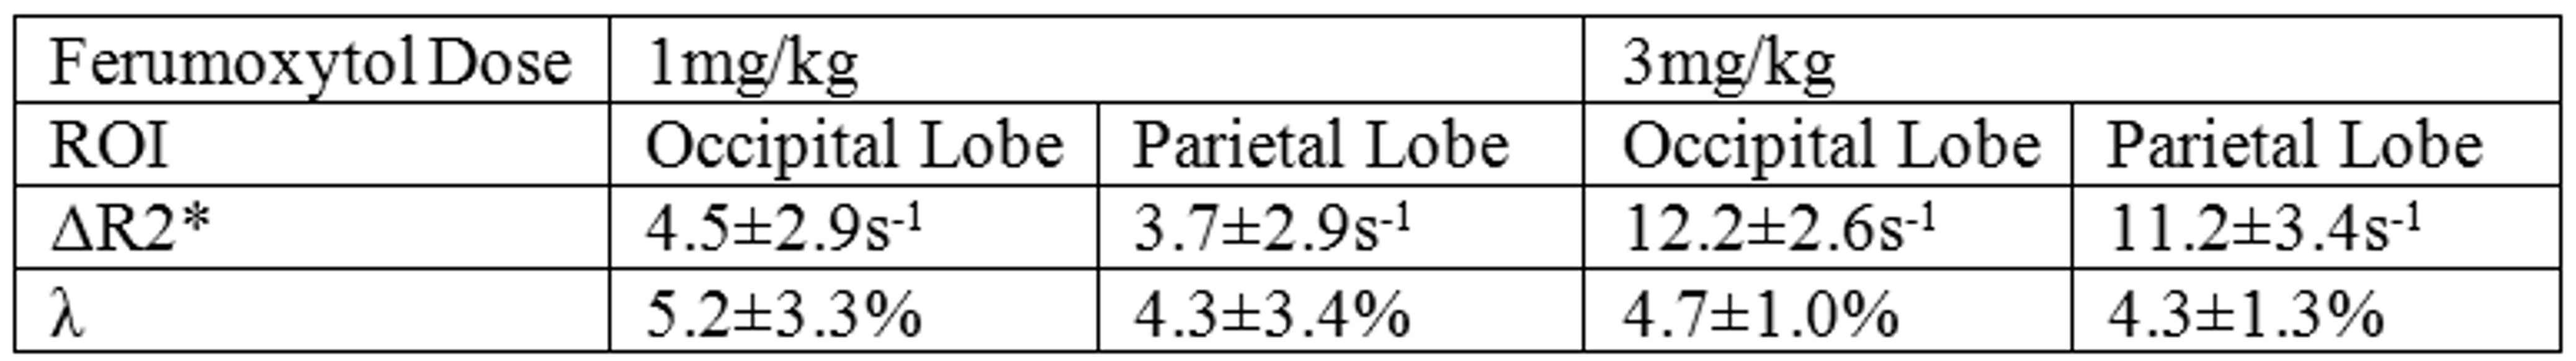
For the phantom data, both the susceptibility and the R2* increased linearly as Ferumoxytol concentration increased (Figure 1). The simulation results showed that SWI provided the best overall CNR and was able to detect the smallest vessel among all the image types, at a given concentration of Ferumoxytol (Figure 2). With 3mg/kg Ferumoxytol, the diameter of the smallest detectable artery was close to 70μm (approximately 50 times smaller than the mean diameter of middle cerebral artery). As an example, Figure 3 shows an arteriole (red arrow) in the right putamen which was not visible in the pre-contrast or the post-1mg/kg data, but was visible in the post-3mg/Kg data. Meanwhile, the CNR of the veins was much better than arteries, attributed to the higher susceptibility of venous blood (Figures 3 and 4). The long red arrow in Figure 4 indicates a cerebral artery which was iso-intense on pre-contrast QSM and SWI, but was hyper-intense on post-contrast QSM and hypo-intense on post-contrast SWI. The calculated capillary blood volume fractions (λ) were consistent between the post-1mg/kg and post-3mg/kg data (Table 1). The higher λ in the occipital lobe than in the parietal lobe was consistent with the values reported in earlier studies (11).Discussion and Conclusions
In this study, we have determined the relationship between Ferumoxytol concentration and the measured susceptibility, as well as the detection limit of small arteries using SWI and QSM. With a higher dose of Ferumoxytol, smaller arteries became visible on SWI, and much smaller venules were also detected, because of the naturally higher susceptibility of the venous blood. The detection limit of vessels was directly related to the image resolution. We showed that the contrast-to-noise ratio for small arteries and veins can be dramatically improved with Ferumoxytol using SWI which combines the magnitude and phase information. This approach may open the door to imaging arteries at a micro level for a variety of neurodegenerative diseases.Acknowledgements
No acknowledgement found.References
1. Haacke EM, Xu Y, Cheng YN, Reichenbach JR. Susceptibility weighted imaging (SWI). Magn Reson Med. 2004;52(3):612–8.
2. Liu S, Buch S, Chen Y, Choi H-S, Dai Y, Habib C, et al. Susceptibility-weighted imaging: current status and future directions. NMR Biomed. 2016; 10.1002/nbm.3552.
3. Haacke EM, Liu S, Buch S, Zheng W, Wu D, Ye Y. Quantitative susceptibility mapping: current status and future directions. Magn Reson Imaging. 2015;33(1):1–25.
4. Abdul-Rahman HS, Gdeisat MA, Burton DR, Lalor MJ, Lilley F, Moore CJ. Fast and robust three-dimensional best path phase unwrapping algorithm. Appl Opt. 2007;46(26):6623–35.
5. Cheng Y-CN, Neelavalli J, Haacke EM. Limitations of calculating field distributions and magnetic susceptibilities in MRI using a Fourier based method. Phys Med Biol. 2009;54(5):1169–89.
6. Schweser F, Deistung A, Lehr BW, Reichenbach JR. Quantitative imaging of intrinsic magnetic tissue properties using MRI signal phase: An approach to in vivo brain iron metabolism? NeuroImage. 2011;54(4):2789–807.
7. Tang J, Liu S, Neelavalli J, Cheng YCN, Buch S, Haacke EM. Improving susceptibility mapping using a threshold-based K-space/image domain iterative reconstruction approach. Magn Reson Med. 2013;69(5):1396–407.
8. Jenkinson M, Smith S. A global optimisation method for robust affine registration of brain images. Med Image Anal. 2001;5(2):143–56.
9. Jenkinson M, Bannister P, Brady M, Smith S. Improved Optimization for the Robust and Accurate Linear Registration and Motion Correction of Brain Images. NeuroImage. 2002;17(2):825–41.
10. Yablonskiy DA, Haacke EM. Theory of NMR signal behavior in magnetically inhomogeneous tissues: the static dephasing regime. Magn Reson Med. 1994;32(6):749–63.
11. Leenders KL, Perani D, Lammertsma AA, Heather JD, Buckingham P, Jones T, et al. Cerebral Blood Flow, Blood Volume and Oxygen Utilization. Brain. 1990;113(1):27–47.
Figures