3668
Tikhonov regularization aided quantitative susceptibility mapping of whole brain without background field removal1Radiology, University of Calgary, Calgary, AB, Canada, 2Biomedical Engineering, McGill University, Montreal, QC, Canada
Synopsis
An advanced dipole field inversion method for whole brain quantitative susceptibility mapping (QSM) without a traditional background field removal step, is proposed. To aid this ill-posed inversion process and obtain successful QSM, a Tikhonov regularization of the local susceptibility distribution is included. It is shown that the proposed method (Tikhonov-QSM) can substantially suppress reconstruction artefacts. More importantly, Tikhonov-QSM does not require edge erosion like in other QSM methods involving background field removal steps, preserving the cerebral cortex of the final images.
Purpose
A background field removal step is usually required for Quantitative Susceptibility Mapping (QSM) reconstruction. However, most background field removal methods either require brain edge erosion or are not accurate at the brain edge 1-5. Single-step QSM was proposed to combine background field removal and dipole inversion into one step 6. However, this method still erodes the brain edge. A recent study proposed a total field inversion method using an R2* map as a preconditioner, making total field inversion feasible 7. Here we propose an alternative method that performs direct deconvolution on the total field map with the aid of an additional Tikhonov regularization of the local tissue susceptibility.
Methods
Tikhonov regularization aided QSM (Tikhonov-QSM)
The relationship between susceptibility and induced field can be simplified as: $$$\mathcal{F}^{-1}D\mathcal{F}\chi=\delta B$$$, where $$$\mathcal{F}$$$ denotes Fourier transform; $$$D$$$ is the unit diple kernel; $$$\chi$$$ is the susceptibility source; $$$\delta B$$$ is the normalized field perturbation. In conventional two-step methods, $$$\delta B$$$ is background field removed (i.e. $$$\delta B_{local}$$$) and $$$\chi$$$ is solved in the local tissue region (i.e. $$$\chi_{local}$$$). Here we extend the equation to the total field: $$$m\mathcal{F}^{-1}D\mathcal{F}\chi=m\delta B$$$, where $$$m$$$ is the brain mask. To assist this more ill-posed inversion problem, a Tikhonov regularization of the local tissue susceptibility $$$m\chi$$$ is applied in addition to the traditional Total Variation (TV) regularization: $$argmin_\chi\|m\mathcal{F}^{-1}D\mathcal{F}\chi-m\delta B\|^2_2+\lambda_1TV(m\chi)+\lambda_2\|m\chi\|^2_2$$ where $$$\lambda_1$$$ and $$$\lambda_2$$$ are regularization parameters for TV and Tikhonov terms respectively. The theory supporting the proposed Tikhonov constraint is that the background susceptibility $$$(1-m)\chi$$$ is generally two orders of magnitude greater than local susceptibility $$$m\chi$$$. Therefore, the background susceptibility sources are responsible for the majority of the measured total field inside the brain tissue region and are unconstrained for dipole fitting. Local tissue susceptibility is assumed to be relatively small and is therefore constrained with the Tikhonov regularization term.
Image acquisition and reconstruction
Seven healthy subjects (age: 27.4±2.6, 3 females) were scanned using a 3T MR system (GE 750). Full brain 3D multiple-echo GRE data were acquired with: 8 TEs, 2.2 ms 1st TE, 2.4 ms echo spacing, 22 ms TR, 1 mm3 isotropic spatial resolution. Phase images were unwrapped and linearly fitted with TEs to generate a total field map. Tikhonov-QSM inversion was then performed using the non-linear conjugate gradient method. To compare with conventional two-step QSM methods, the total field was also processed by either regularization-enabled sophisticated harmonic artefact reduction for phase data (RESHARP) 2 or projection onto dipole field (PDF) 4 methods as the background field removal step.
Results
The choice of Tikhonov regularization parameters
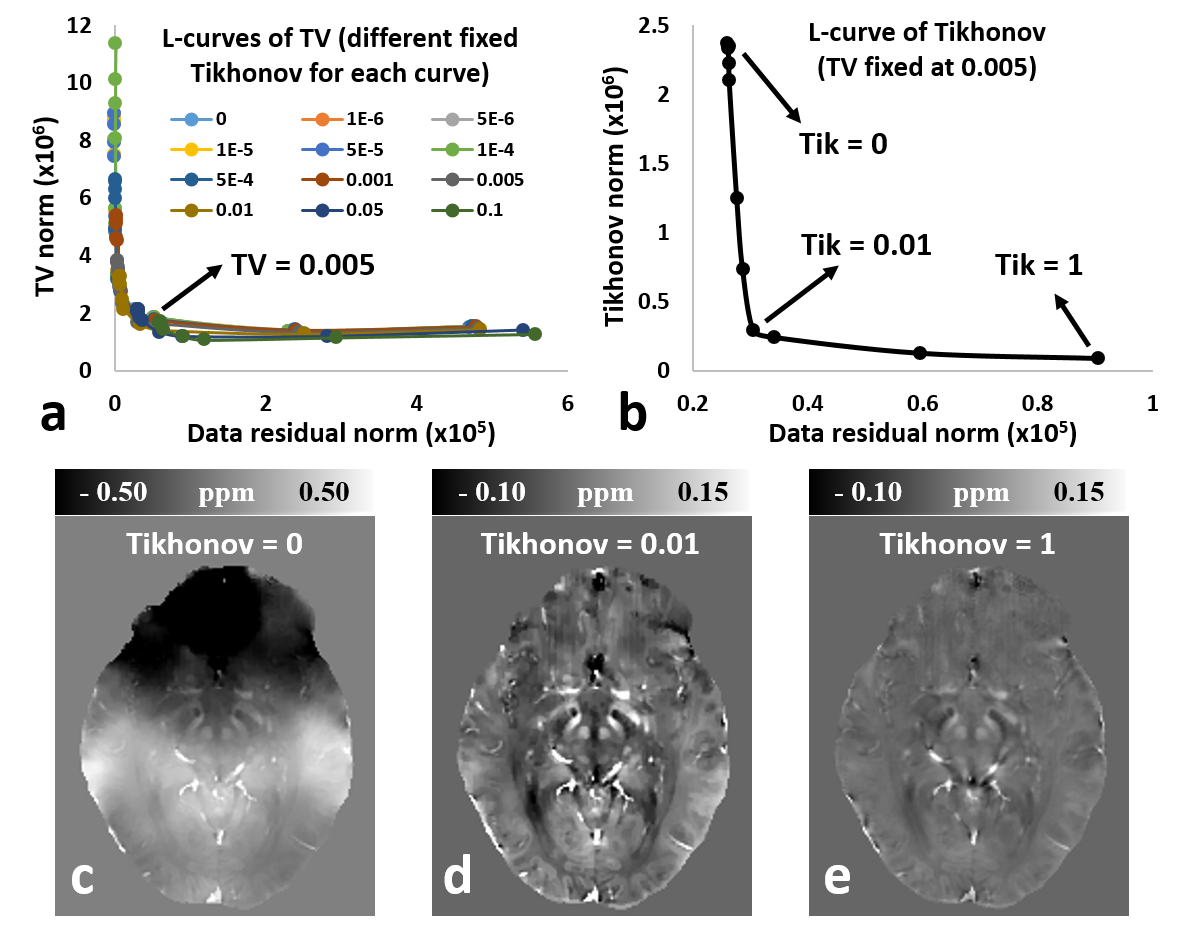
As shown in Fig. 1, optimal $$$\lambda_1$$$ and $$$\lambda_2$$$ were determined using the L-curve method (a,b). Zero Tikhonov regularization produces large scale artefacts (c), while too large a Tikhonov parameter substantially suppresses the local susceptibility contrast (e). With an optimal regularization parameter, QSM with unsuppressed susceptibility contrast and no dominating artefacts from the background field is achieved (d).
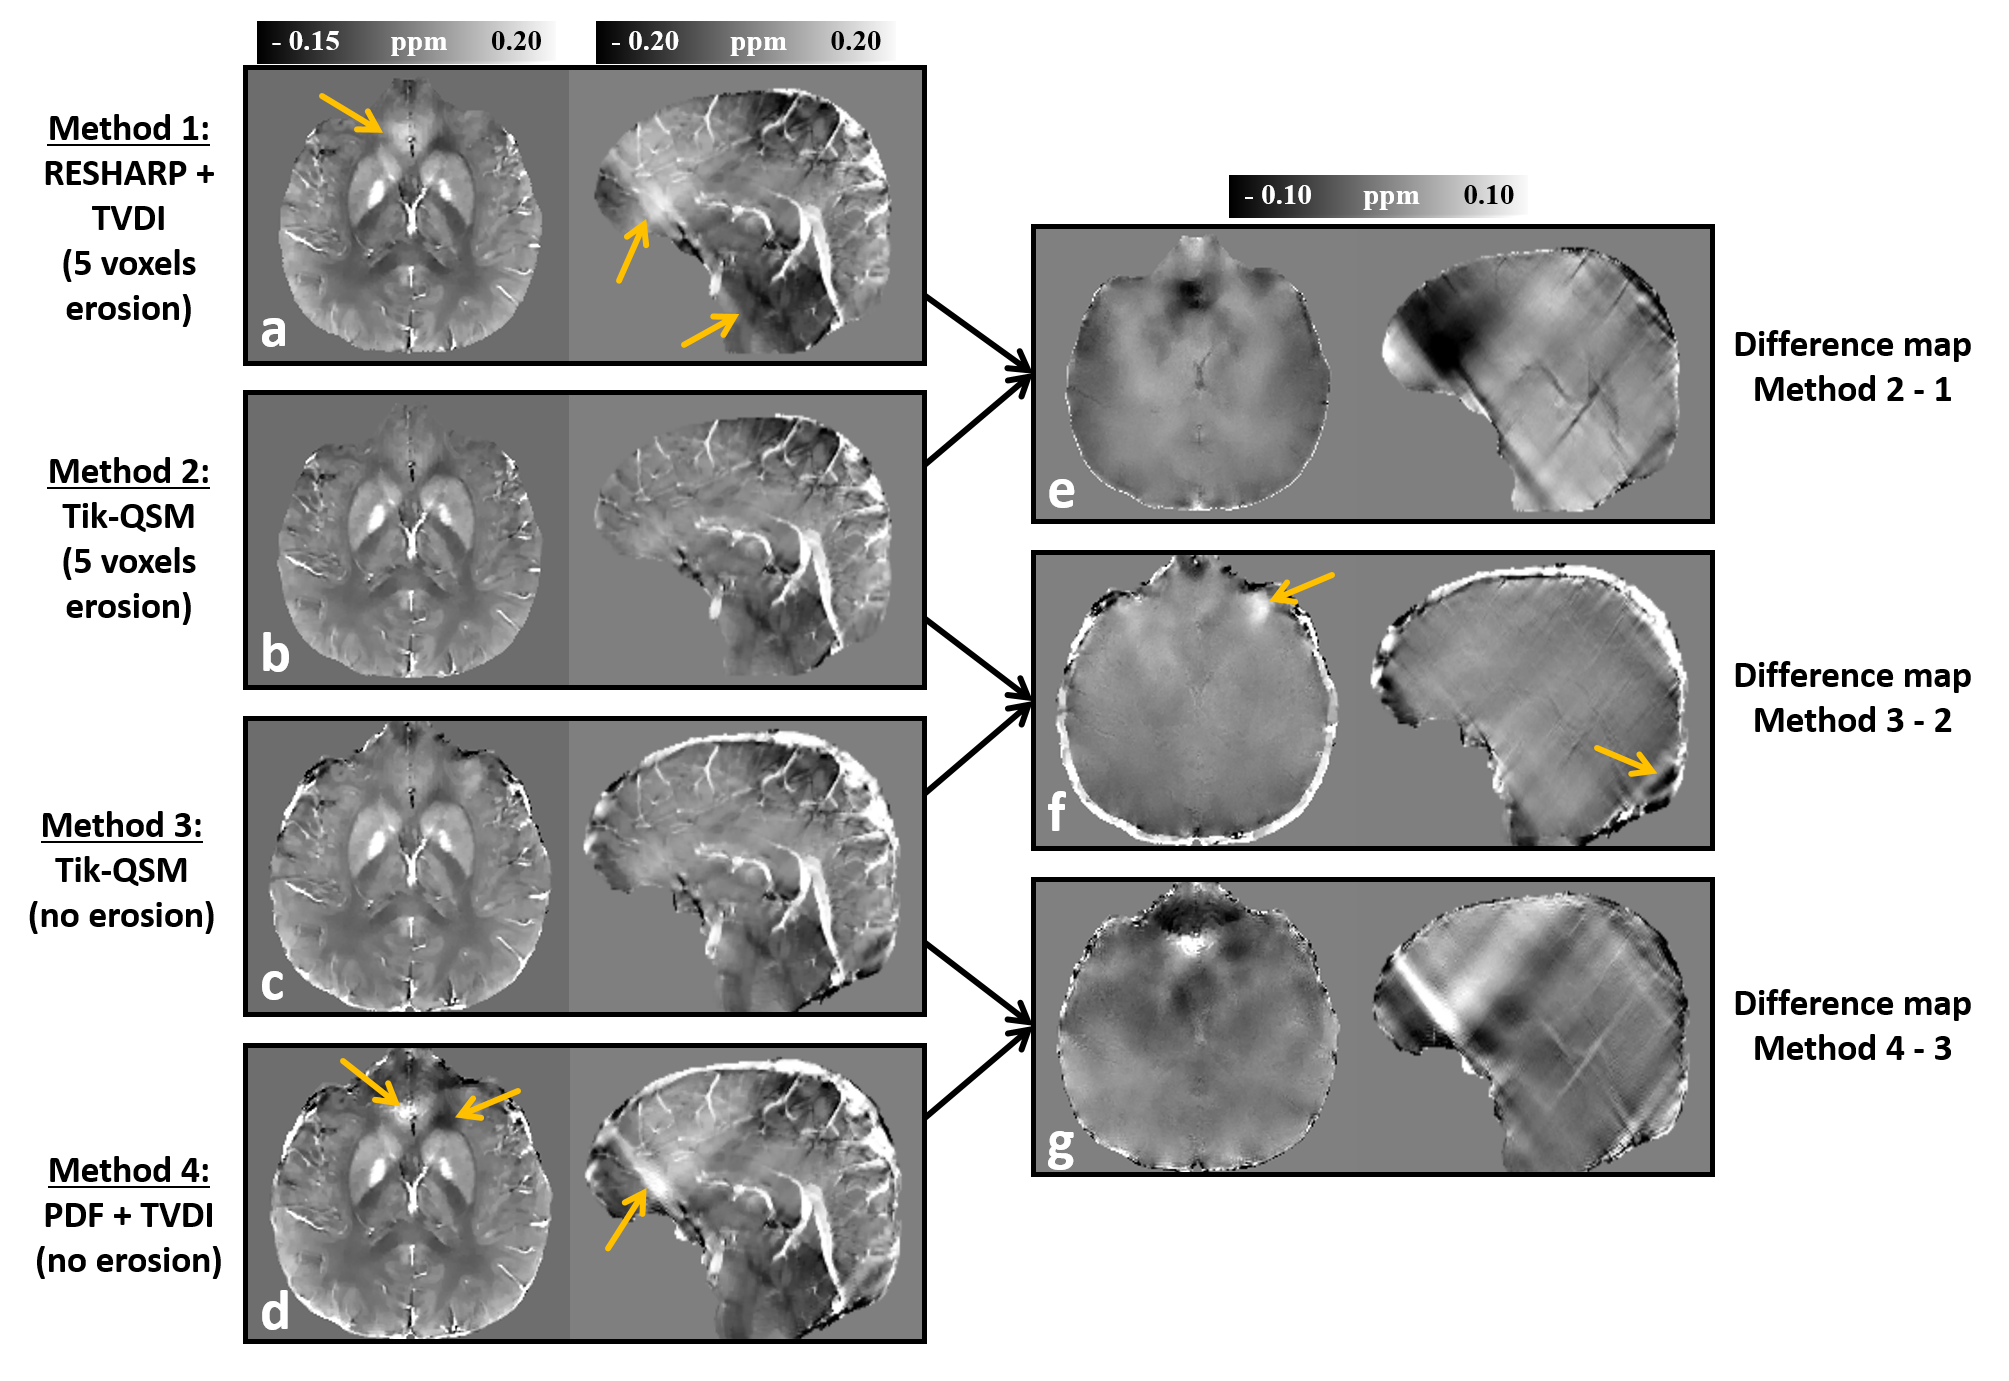
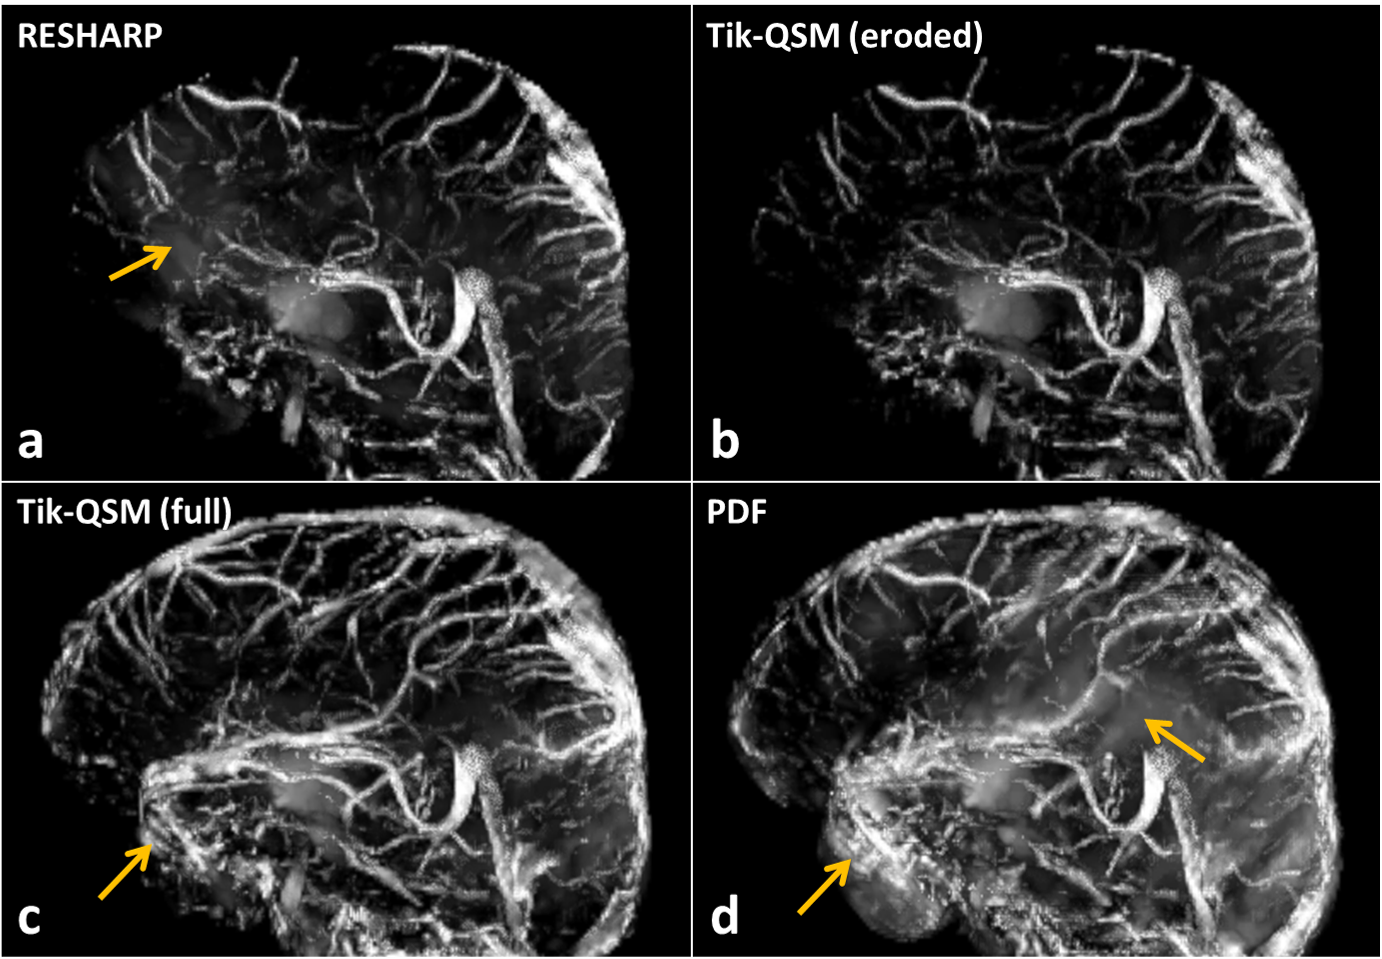
Comparison of single-step Tikhonov-QSM with two-step QSM results using 4 different methods are shown in Fig. 2. Artefact suppression is observed in Tikhonov-QSM as compared to the two-step RESHARP and PDF methods. Full brain Tikhonov-QSM tends to introduce more artefacts than the eroded version near the edge, however, the image quality in the inner brain regions remains similar. Part of the superior sagittal sinus is eroded in RESHARP and the mask-matched Tikhonov-QSM, but retained in full brain Tikhonov-QSM and PDF methods. The maximum intensity projections of the 4 QSM methods are shown in Fig. 3. Significantly more veins, especially the superior sagittal sinus and cortical surface veins, appear in the full brain Tikhonov-QSM.
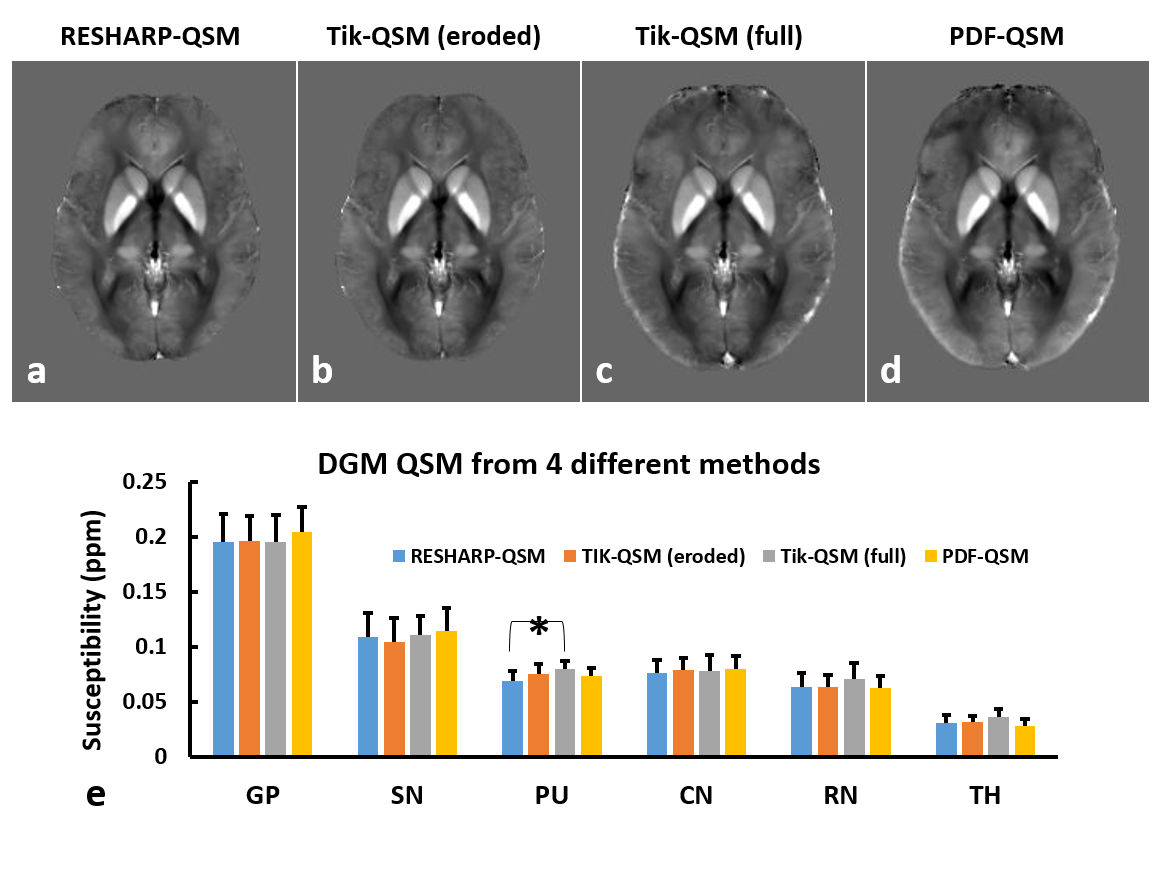
The averaged QSM image over 7 subjects of a central axial slice in the MNI space is shown in Fig. 4 for each method. Susceptibility measurements of 6 deep grey matter structures (relative to white matter) are compared. The only difference between the methods was a small (12.6%), but statistically significant (p=0.015), difference between RESHARP and full-brain Tikhonov-QSM in the putamen.
Discussion and conclusion
We proposed a total field inversion method that is aided by Tikhonov regularization, without an explicit step of background field removal. This method generates improved quality of QSM images compared to conventional two-step methods and preserves the brain edge regions. It enables evaluation of full brain QSM without edge erosion, thereby enabling the measurements in cortical grey matter and brain surface veins, including the superior sagittal sinus. This extends potential QSM applications to cortical grey matter functional QSM imaging, quantitative full brain susceptibility venography, and estimating regional oxygen extraction fraction and cerebral metabolic rate of oxygen consumption.Acknowledgements
Alberta Innovates: Health Solutions
Canadian Institutes of Health Research (FDN 143290)
Campus Alberta Innovates Program
References
1. Schweser F, Deistung A, Lehr BW, Reichenbach JR. Quantitative imaging of intrinsic magnetic tissue properties using MRI signal phase: an approach to in vivo brain iron metabolism? Neuroimage. 2011 Feb 14;54(4):2789-807.
2. Sun H, Wilman AH. Background field removal using spherical mean value filtering and Tikhonov regularization. Magn Reson Med. 2014 Mar;71(3):1151-7.
3. Wu B, Li W, Guidon A, Liu C. Whole brain susceptibility mapping using compressed sensing. Magn Reson Med. 2012 Jan;67(1):137-47.
4. Liu T, Khalidov I, de Rochefort L, Spincemaille P, Liu J, Tsiouris AJ, Wang Y. A novel background field removal method for MRI using projection onto dipole fields (PDF). NMR Biomed. 2011 Nov;24(9):1129-36.
5. Zhou D, Liu T, Spincemaille P, Wang Y. Background field removal by solving the Laplacian boundary value problem. NMR Biomed. 2014 Mar;27(3):312-9.
6. Langkammer C, Bredies K, Poser BA, Barth M, Reishofer G, Fan AP, Bilgic B, Fazekas F, Mainero C, Ropele S. Fast quantitative susceptibility mapping using 3D EPI and total generalized variation. Neuroimage. 2015 May 1;111:622-30.
7. Liu Z, Kee Y, Zhou D, Wang Y, Spincemaille P. Preconditioned total field inversion (TFI) method for quantitative susceptibility mapping. Magn Reson Med. 2016 Jul 28. doi: 10.1002/mrm.26331.
Figures