3666
Spatiotemporal dynamics of inter-subject magnetic susceptibility variations in the human brain1Buffalo Neuroimaging Analysis Center, Department of Neurology, Jacobs School of Medicine and Biomedical Sciences, University at Buffalo, The State University of New York, Buffalo, NY, United States, 2MRI Clinical and Translational Research Center, Jacobs School of Medicine and Biomedical Sciences, University at Buffalo, The State University of New York, Buffalo, NY, United States, 3MR Research Laboratory, IRCCS, Don Gnocchi Foundation ONLUS, Milan, Italy
Synopsis
Magnetic susceptibility in the deep gray matter varies substantially between subjects of similar age or disease state. This work employs a blind source separation technique to 239 healthy controls to determine, without prior assumptions, the spatial patterns that drive inter-subject variation of magnetic susceptibility in the human brain.
Purpose
Quantitative Susceptibility Mapping (QSM) is a novel post-processing technique for T2*-weighted phase data1-4. Due to its unique sensitivity for tissue iron5, numerous studies have successfully employed QSM to reveal insights on brain iron homeostasis in normal aging6-10 and several neurological diseases2. A conclusion that can be drawn from these studies is that deep gray matter (DGM) susceptibility varies substantially between subjects of similar age or disease state. While it is known that DGM iron follows a nonlinear, heteroscedastic aging trajectory11, knowledge about the spatiotemporal patterns of these inter-subject differences is currently sparse.
In the present work, we employed a blind source separation (BSS) technique to determine, without prior assumptions, the spatial patterns that drive inter-subject variation of magnetic susceptibility in the human brain
Methods
Subjects and data acquisition: This IRB-approved retrospective study included 239 (162 female/77 male) subjects without pre-existing medical conditions associated with brain pathology, covering a broad range of ages (9-76 years). All subjects were imaged at 3T with a 3D gradient-echo sequence (TE/TR=22ms/40ms, tip=12°, matrix=512x192x64, FOV=256x192x128mm3) using an eight-channel head-and-neck coil.
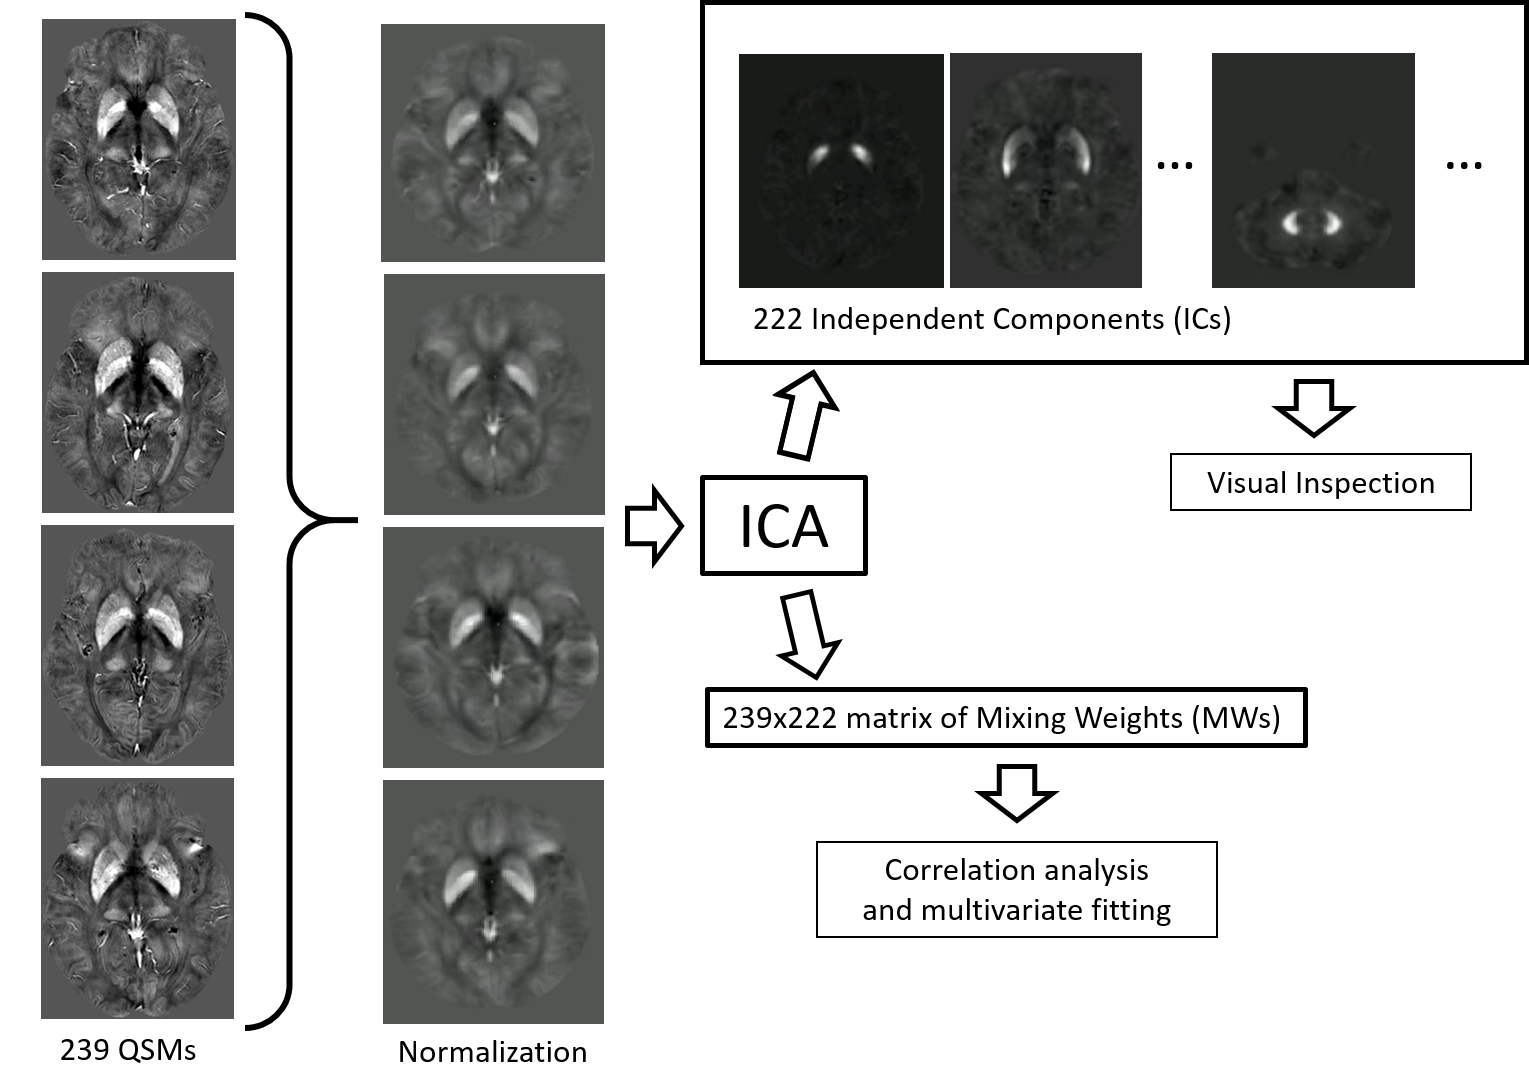
QSM and BSS: Susceptibility maps were reconstructed from k-space using scalar phase-matching12, gradient unwarping13, best-path phase unwrapping14, V-SHARP15,16, and HEIDI17. We normalized all susceptibility maps to a custom susceptibility brain template18 created from randomly selected susceptibility maps of the hospital database. A 3D Independent Component Analysis (ICA; FSL MELODIC; automatic number of components) decomposed the normalized maps into statistically independent components (IC) and mixing weights (MW). Figure 1 illustrates the process.
Analysis: For comparison with the literature, we calculated the average susceptibility in DGM using a manually defined brain atlas. Based on visual inspection of the IC’s, two trained analysts classified the ICs as anatomy, artifact, or pathology. Subjects with high MW for pathology-ICs were considered as abnormal and excluded from further analyses. We investigated the correlation of anatomy-MW with age using the Spearman rank coefficient (p<0.05 significant). Recombination of susceptibility maps from ICs and MWs excluding artifact-ICs and ICs not rank-correlated with age yielded filtered maps that showed primarily age-related susceptibility in every subject. These filtered maps were analyzed again with an atlas approach. To understand how much of the susceptibility variation between subjects can be explained by anatomy-ICs, we applied L1-regularized multivariate second-order regression with the MWs as independent and age as dependent variables. A bootstrapping approach with 120 randomly assigned test subjects determined the optimal regularization parameter to avoid overfitting.
Results
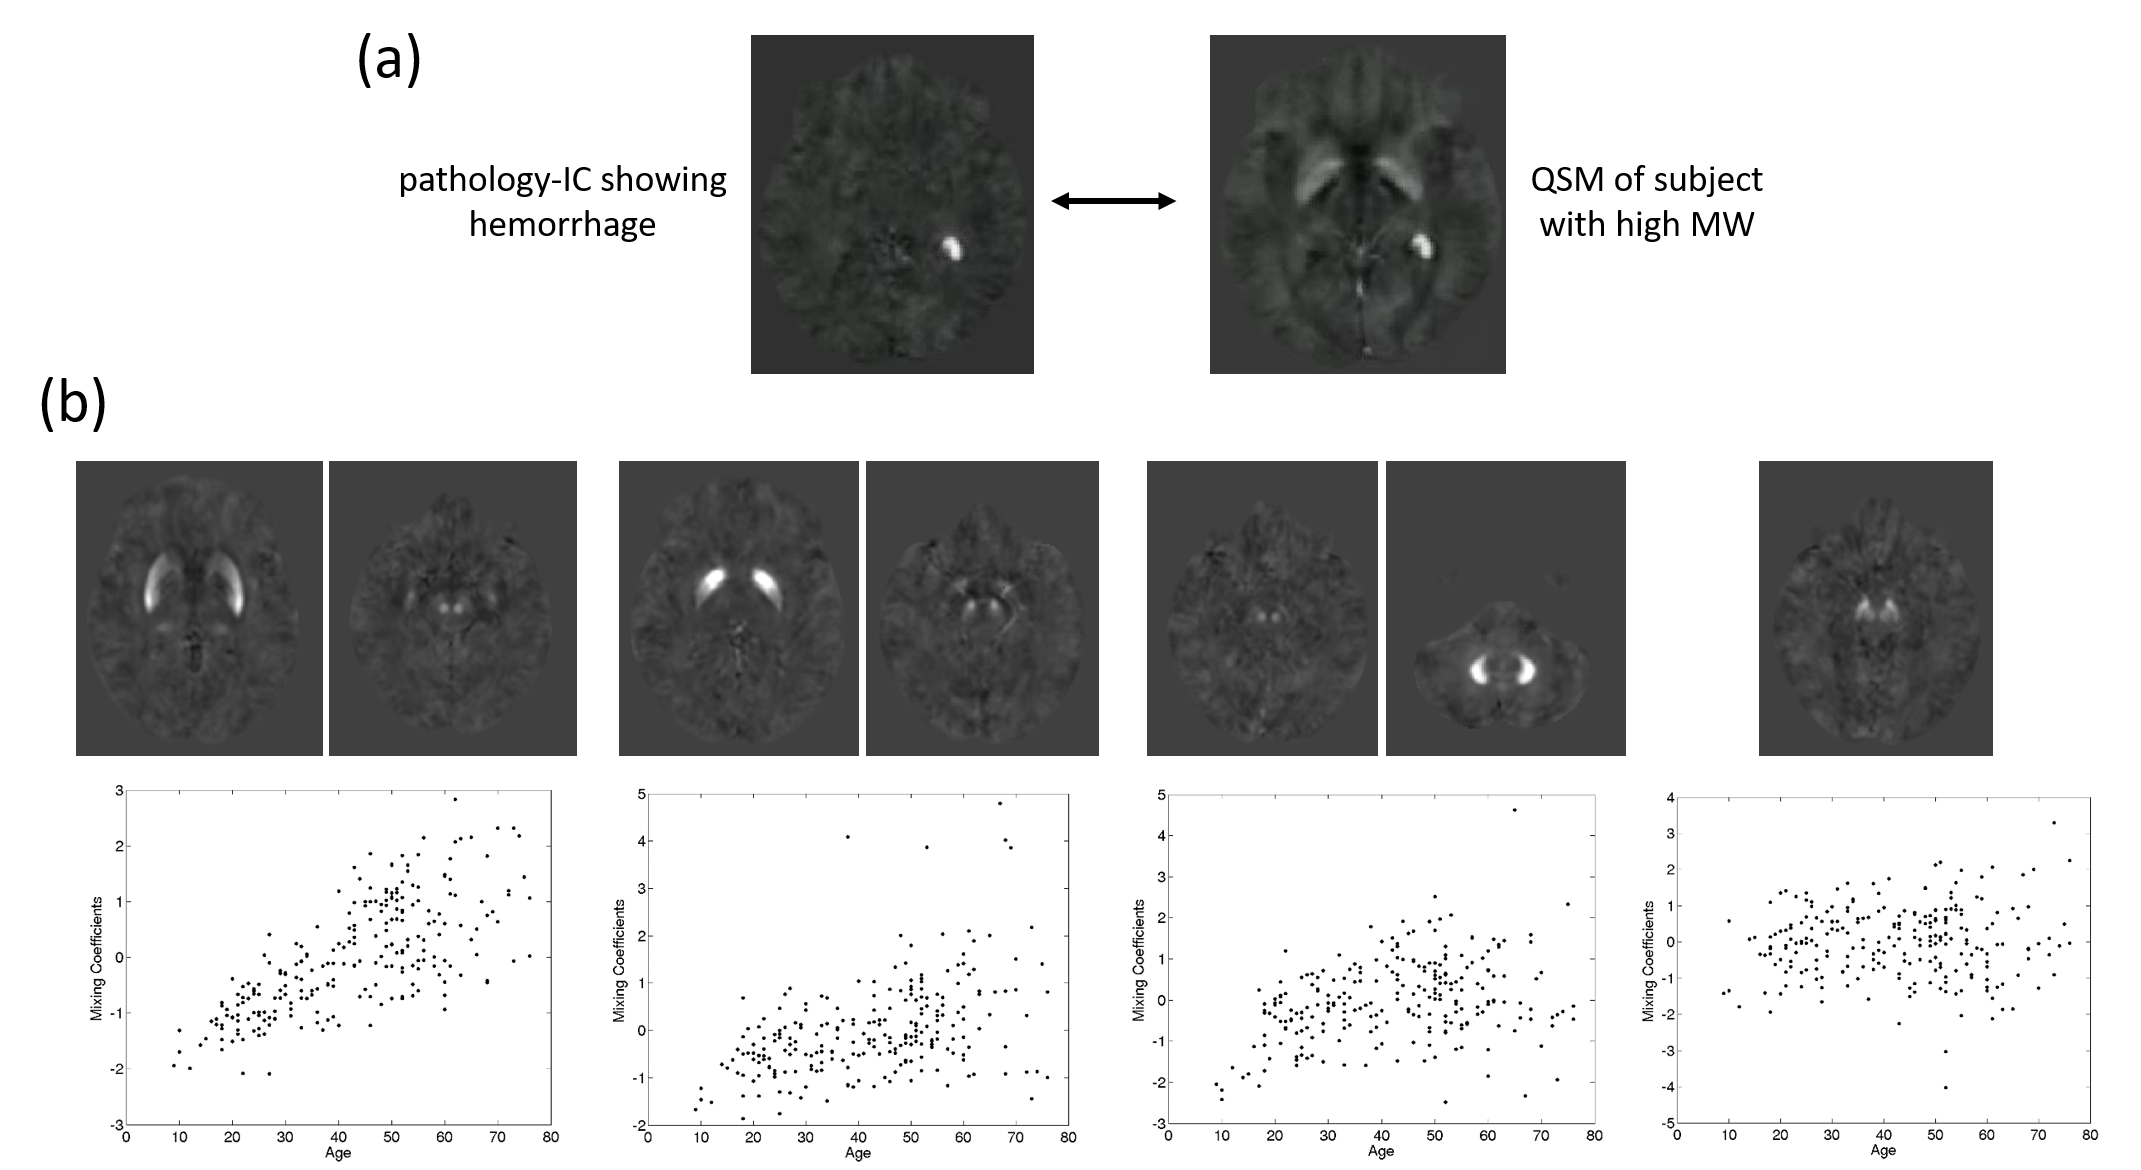
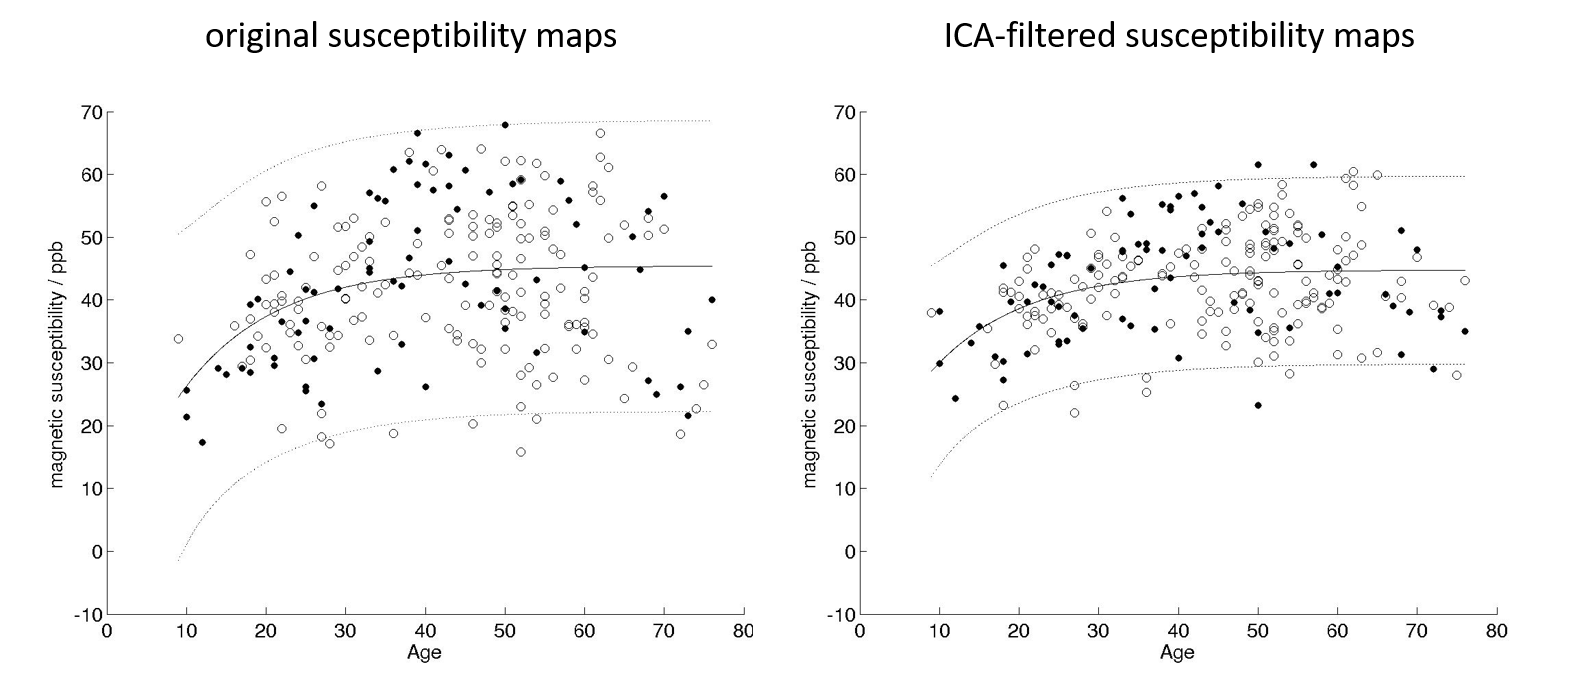
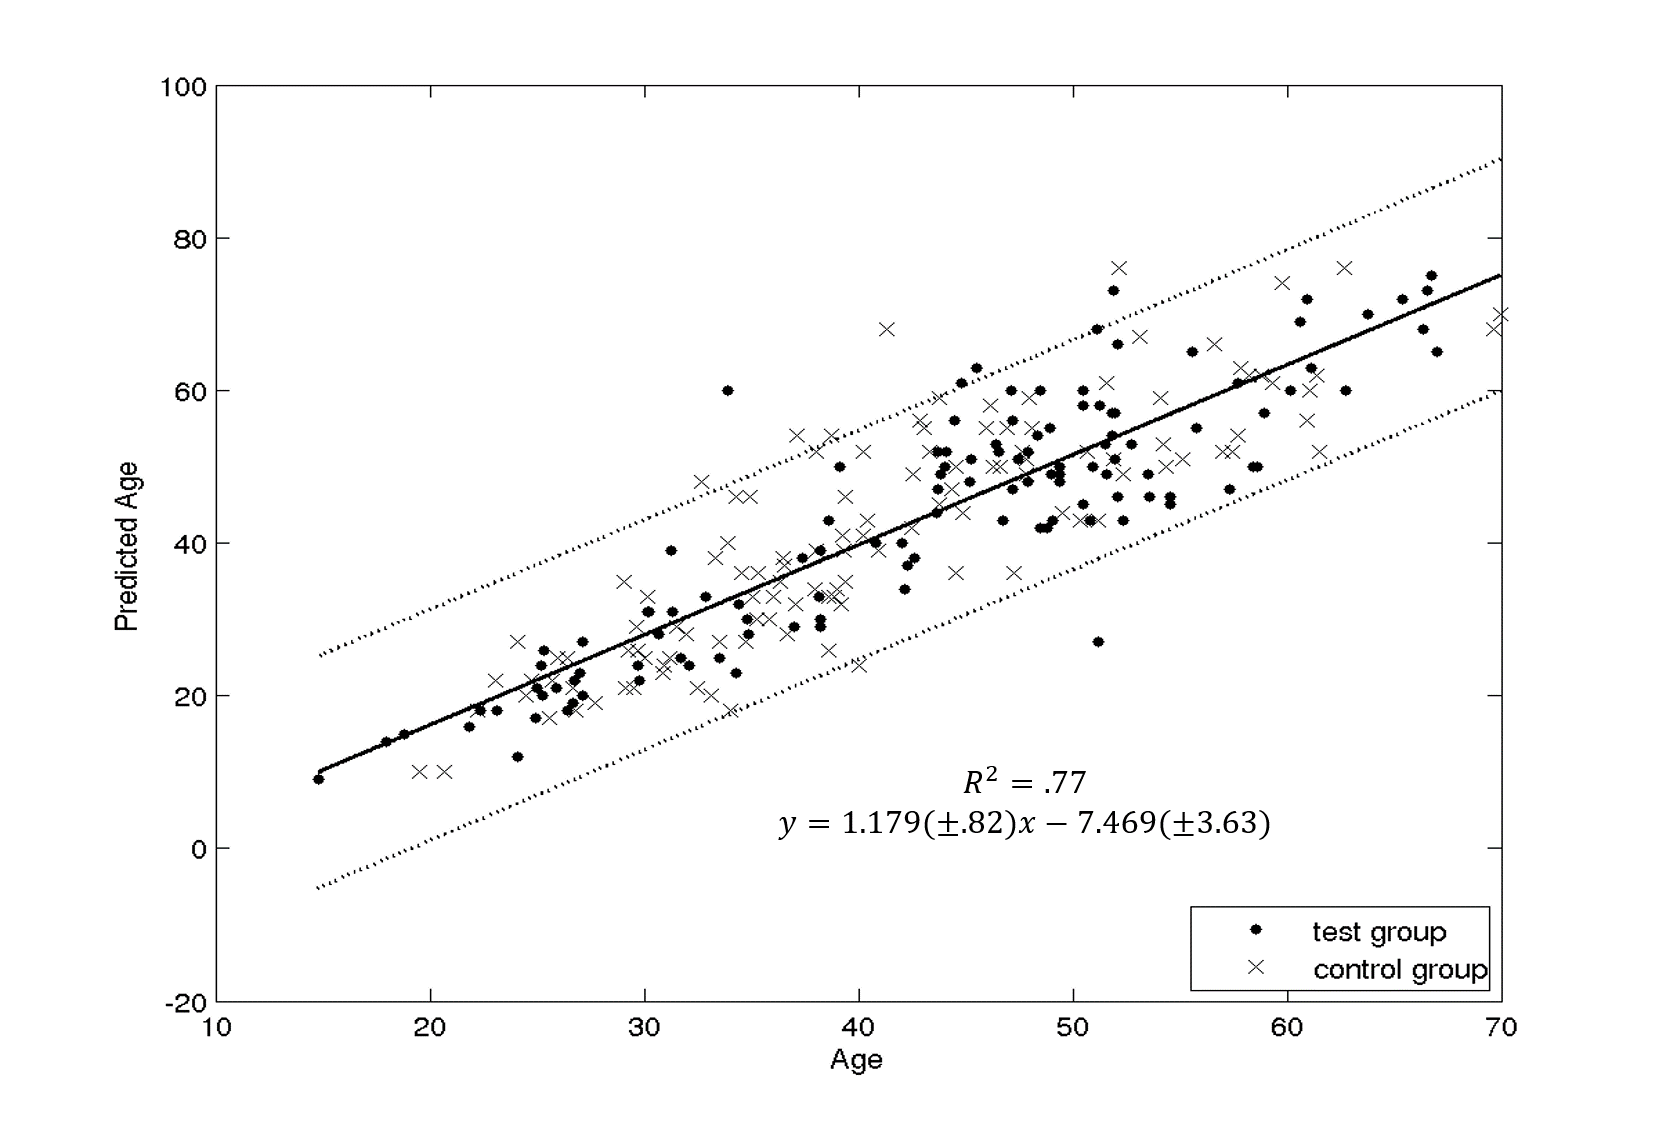
The ICA yielded seven anatomy-ICs, two ICs showed calcifications or hemorrhages (pathology-ICs; Figure 2a), and 213 showed QSM-artifacts. Most anatomy-ICs showed multiple DGM nuclei, but sub-nuclei were split among different ICs (Figure 2b). 81 ICs correlated with age; the strongest correlation was observed in an IC that contained putamen, red nucleus, and the head of the caudate (Figure 2b). One anatomy-IC with strong intensity in the substantia nigra and the red nucleus did not correlate with age. Figure 3 shows the correlation with age of average susceptibility in the pulvinar obtained from original and ICA-filtered susceptibility maps, respectively. Age explained 77% of the variation of age-related ICs between subjects (Figure 4).Discussion
Without a priori knowledge of anatomy, ICA revealed that inter-subject variations of susceptibility are characterized by distinct spatial patterns of iron-laden DGM sub-nuclei. In particular, the appearance of several sub-nuclei on the same ICs indicates spatiotemporal correlations between these regions, providing interesting insights into the spatial dynamics of brain iron homeostasis. Network analysis using environmental, behavior and cognitive data will decipher these correlations in future studies. In particular, the lack of association of one anatomy-IC with age suggests that networks associated with this IC are affected by external, non-aging related factors.
The high number of ICs compared to other applications of ICA (e.g. fMRI) may be attributed to the relatively high level of reconstruction artifacts on susceptibility maps. While the low number of anatomy-ICs and clear splitting of nuclei between ICs indicate successful decomposition, the reliability of the decomposition19 will be a subject of future research. The automated identification of pathologies (that remained undetected during recruitment) and reduced inter-subject variability of average DGM susceptibility after ICA-based filtering (Figure 3) illustrates the potential of BSS-based analyses to eliminate spurious artifacts in clinical QSM studies. Multivariate regression of age-related MWs revealed an age-prediction accuracy comparable to previous, more sophisticated morphometric attempts20,21, indicating the potential of QSM as a means to determine brain age.
Conclusion
BSS of susceptibility maps provides unique insights into the spatiotemporal dynamics of brain iron homeostasis that bear the potential to decipher iron-related networks of brain pathology in neurological diseases.Acknowledgements
Research reported in this publication was funded by the National Center for Advancing Translational Sciences of the National Institutes of Health under Award Number UL1TR001412. The content is solely the responsibility of the authors and does not necessarily represent the official views of the NIH.References
[1] C. Liu, W. Li, K. A. Tong, K. W. Yeom, and S. Kuzminski, “Susceptibility-weighted imaging and quantitative susceptibility mapping in the brain,” J Magn Reson Imaging, 42(1):23–41, 2015.
[2] E. M. Haacke, S. Liu, S. Buch, W. Zheng, D. Wu, and Y. Ye, “Quantitative susceptibility mapping: current status and future directions,” Magn Reson Imaging, 33(1):1–25, 2015.
[3] J. R. Reichenbach, F. Schweser, B. Serres, and A. Deistung, “Quantitative Susceptibility Mapping: Concepts and Applications,” Clin Neuroradiol, 25(S2):225–230, 2015.
[4] Y. Wang and T. Liu, “Quantitative susceptibility mapping (QSM): Decoding MRI data for a tissue magnetic biomarker,” Magn Reson Med, vol. 73, no. 1, pp. 82–101, 2015.
[5] C. Langkammer, F. Schweser, N. Krebs, A. Deistung, W. Goessler, E. Scheurer, K. Sommer, G. Reishofer, K. Yen, F. Fazekas, S. Ropele, and J. R. Reichenbach, “Quantitative susceptibility mapping (QSM) as a means to measure brain iron? A post mortem validation study.” NeuroImage, 62(3):1593–1599, 2012.
[6] J. Acosta-Cabronero, M. J. Betts, A. Cardenas-Blanco, S. Yang, and P. J. Nestor, “In Vivo MRI Mapping of Brain Iron Deposition across the Adult Lifespan,” J Neurosci, vol. 36, no. 2, pp. 364–374, 2016.
[7] M. J. Betts, J. Acosta-Cabronero, A. Cardenas-Blanco, P. J. Nestor, and E. Düzel, “High-resolution characterisation of the aging brain using simultaneous quantitative susceptibility mapping (QSM) and R2* measurements at 7T,” NeuroImage, 2016.
[8] W. Li, B. Wu, A. Batrachenko, V. Bancroft-Wu, R. A. Morey, V. Shashi, C. Langkammer, M. D. De Bellis, S. Ropele, A. W. Song, and C. Liu, “Differential developmental trajectories of magnetic susceptibility in human brain gray and white matter over the lifespan.” Hum Brain Mapp, vol. 35, no. 6, pp. 2698–713, 2014.
[9] M. Liu, S. Liu, K. Ghassaban, W. Zheng, D. Dicicco, Y. Miao, C. Habib, T. Jazmati, and E. M. Haacke, “Assessing global and regional iron content in deep gray matter as a function of age using susceptibility mapping,” J Magn Reson Imaging, pp. 1–13, 2015.
[10] C. B. Poynton, M. Jenkinson, E. Adalsteinsson, E. V. Sullivan, A. Pfefferbaum, and W. Wells, “Quantitative susceptibility mapping by inversion of a perturbation field model: Correlation with brain iron in normal aging,” IEEE Trans Med Imaging, vol. 34, no. 1, pp. 339–353, 2015.
[11] B. Hallgren and P. Sourander, “The effect of age on the non-haemin iron in the human brain,” J Neurochem, vol. 3, pp. 41–51, 1958.
[12] K. E. Hammond, J. M. Lupo, D. Xu, M. Metcalf, D. A. C. Kelley, D. Pelletier, S. M. Chang, P. Mukherjee, D. B. Vigneron, and S. J. Nelson, “Development of a robust method for generating 7.0 T multichannel phase images of the brain with application to normal volunteers and patients with neurological diseases.” NeuroImage, vol. 39, no. 4, pp. 1682–1692, 2008.
[13] P. Polak, R. Zivadinov, F. Schweser F. "Gradient Unwarping for Phase Imaging Reconstruction." ISMRM 2015, p1279.
[14] H. S. Abdul-Rahman, M. A. Gdeisat, D. R. Burton, M. J. Lalor, F. Lilley, and C. J. Moore, “Fast and robust three-dimensional best path phase unwrapping algorithm.” Appl Opt, vol. 46, no. 26, pp. 6623–35, 2007.
[15] W. Li, B. Wu, and C. Liu, “Quantitative susceptibility mapping of human brain reflects spatial variation in tissue composition.” NeuroImage, vol. 55, no. 4, pp. 1645–56, 2011.
[16] F. Schweser, A. Deistung, B. W. Lehr, and J. R. Reichenbach, “Quantitative imaging of intrinsic magnetic tissue properties using MRI signal phase: An approach to in vivo brain iron metabolism?” NeuroImage, vol. 54, no. 4, pp. 2789–2807, 2011.
[17] F. Schweser, K. Sommer, A. Deistung, and J. R. Reichenbach, “Quantitative susceptibility mapping for investigating subtle susceptibility variations in the human brain.” NeuroImage, vol. 62, no. 3, pp. 2083–2100, 2012.
[18] J. Hanspach, M. Dwyer, N. P. Bergsland, X. Feng, J. Hagemeier, P. Polak, N. Bertolino, R. Zivadinov, and F. Schweser, “Toward a voxel-based analysis (VBA) of quantitative magnetic susceptibility maps (QSM): Strategies for creating brain susceptibility templates.” ISMRM 2016, P1905.
[19] J. Himberg, A. Hyvärinen, and F. Esposito, “Validating the independent components of neuroimaging time series via clustering and visualization,” NeuroImage, vol. 22, no. 3, pp. 1214–1222, 2004.
[20] B. M. Kandel, D. J. J. Wang, J. C. Gee, and B. B. Avants, “Eigenanatomy: Sparse dimensionality reduction for multi-modal medical image analysis,” Methods, vol. 73, pp. 43–53, 2015.
[21] K. Franke, E. Luders, A. May, M. Wilke, and C. Gaser, “Brain maturation: Predicting individual BrainAGE in children and adolescents using structural MRI.” NeuroImage, pp. 1–8, 2012.
Figures