3665
Susceptibility Mapping of the Dural Sinuses and Other Major Veins in the Brain1The MRI Institute for Biomedical Research, Waterloo, ON, Canada, 2Department of Radiology, Wayne State University, Detroit, MI, United States
Synopsis
In QSM, every effort is made to reduce background field induced by the air-tissue interfaces. In this abstract, we propose a method to: correct the phase of boundary regions by using background field extrapolation methods such as Taylor expansion; preserve the internal phase for the superior sagittal sinus (SSS) and transverse sinuses using an arterial-venous (MRAV) image; and predict the phase outside the brain and SSS using forward modeling. Further, we combine these steps to obtain an estimate of the venous oxygen saturation levels inside dural sinuses.
Introduction
Susceptibility mapping (SM) is a means to obtain direct measurements of local tissue susceptibility distribution [1]. Usually the focus is on imaging tissues in the brain, and the region of the brain studied is dictated by the skull stripped mask. Many filtering methods have been developed to remove the unwanted background phase [2-3]. Although these techniques efficiently remove the background phase, producing the pristine local phase behavior for regions at the edge of the brain has been difficult in the past. In addition, for structures such as the superior sagittal sinus (SSS) that runs alongside the surface of the brain and under the skull bones, a considerable part of external phase is lost due to short T2* of the bones. In this abstract, we propose a method to: 1) correct the original phase data of boundary regions by using field extrapolation methods using a Taylor series expansion [4]; 2) preserve the internal phase for the SSS and transverse sinuses using an arterial-venous (MRAV) image; and 3) predict phase outside the brain using forward modeling [5]. Further, we combine these steps to obtain an estimate of the venous oxygen saturation levels inside sinuses.Methods
Three SWI datasets were acquired using a fully flow compensated, rf spoiled, high resolution, 3D gradient echo sequence with flow rephased-dephased interleaved set of two single echo sequences to generate the MRAV image. The imaging parameters used were: TE1/TE2=13ms, TR=27ms, FA=15°, B0=3T (Siemens Verio) with 0.7×0.7×1.4mm3 resolution. The magnitude images of the interleaved echoes were subtracted to generate MRAV maps. Post processing of phase images was performed in two steps: Firstly, the internal phase of the dural sinuses was preserved by extending the background field. SHARP filtering was applied to remove the background phase; however, the edges are eroded in the process. Background phase approximation was extrapolated using a Taylor series expansion to estimate local phase outside of the eroded mask [4]. Secondly, the external phase for the dural sinuses was simulated by applying the forward phase modeling approach on the SSS geometry extracted from MRAV. SMs were generated using the truncated k-space algorithm and the inverse Green’s function [1]. In order to validate the proposed method, we tested it on the straight sinus (StrS), which is enclosed within the central region of the brain. The mean and standard deviation of the susceptibility distribution was obtained from conventional QSM method and the proposed modification.Results
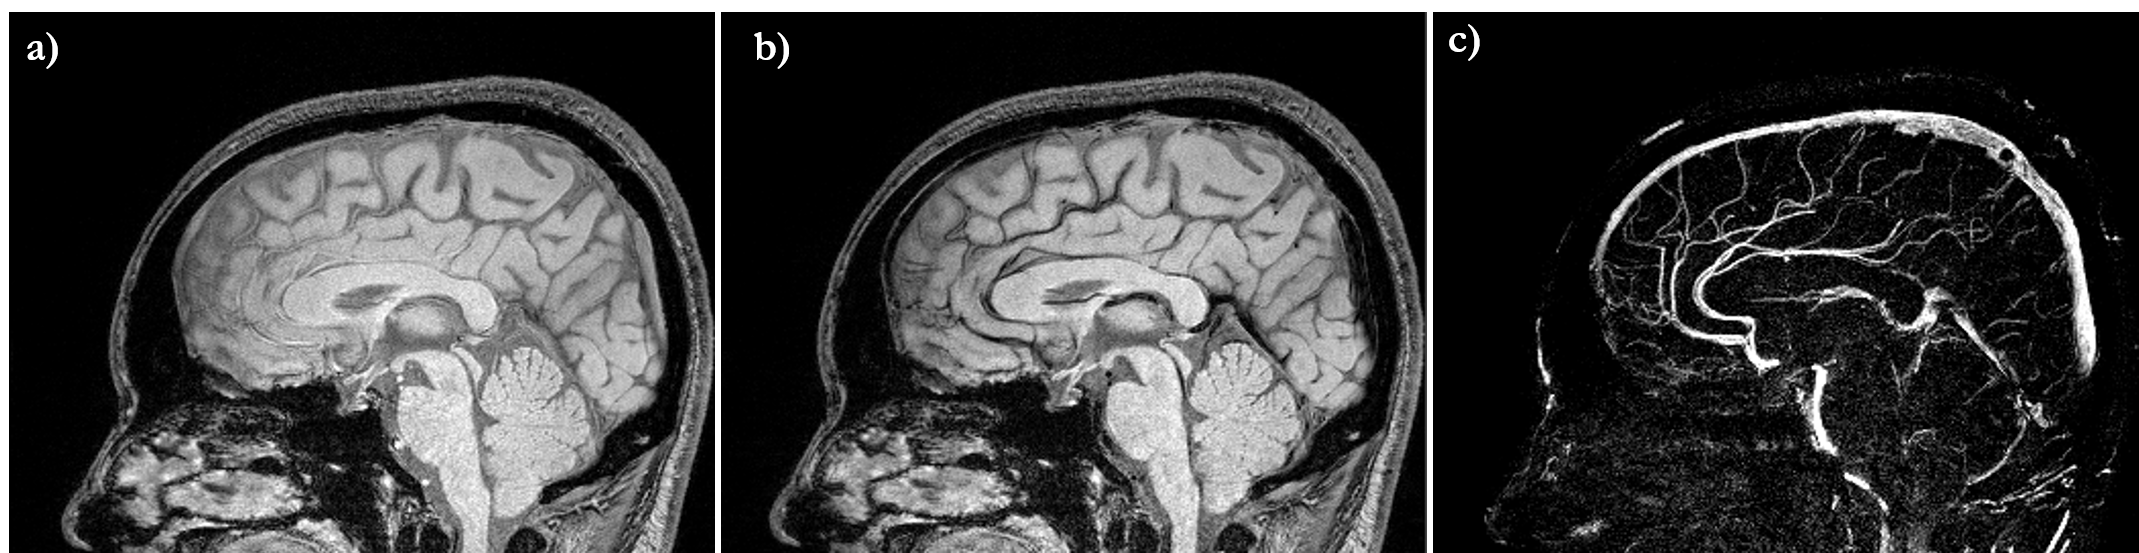
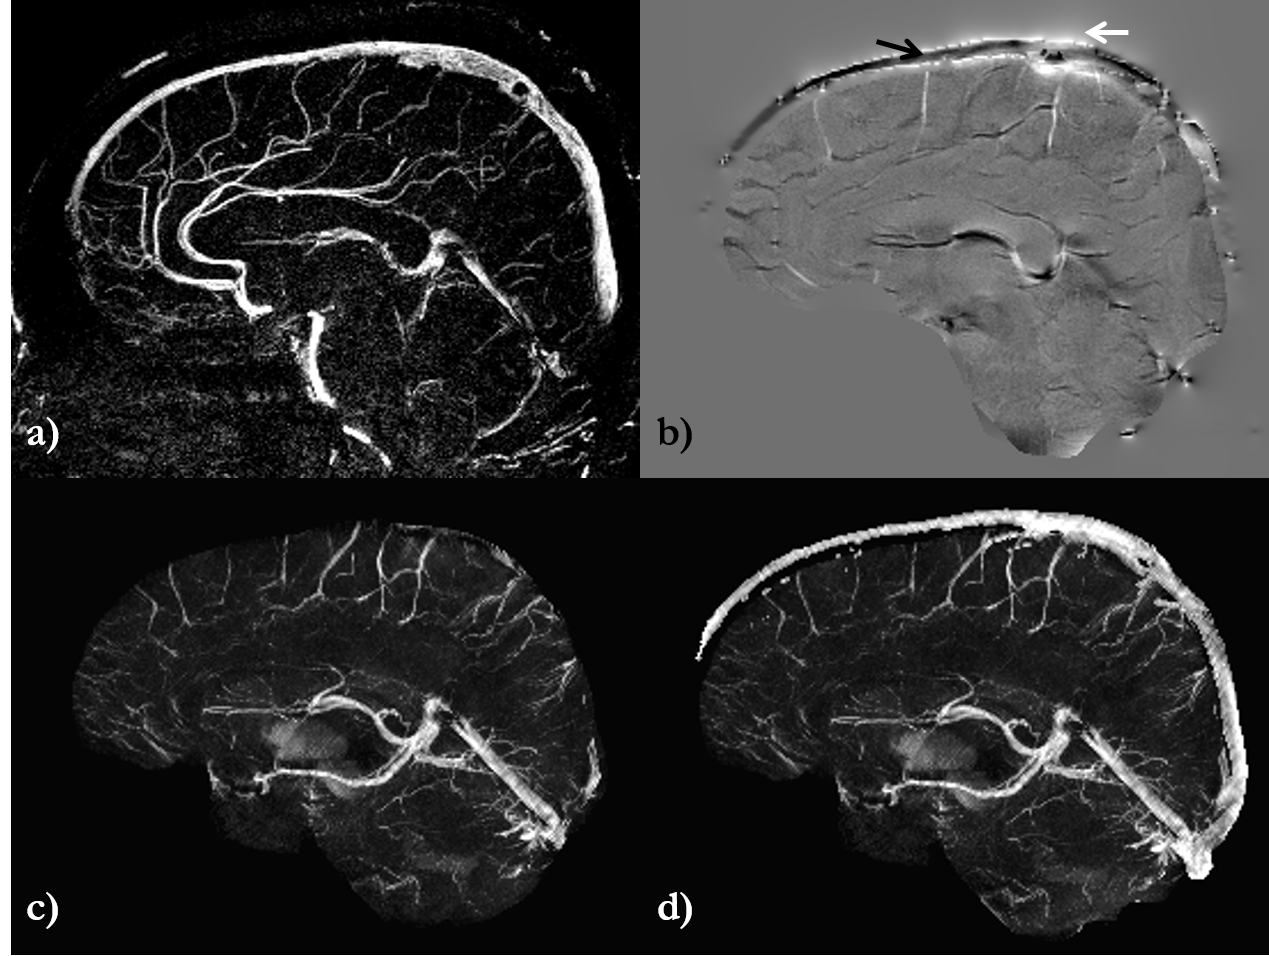
The resultant MRAV (Fig. 1) shows a strong signal inside the SSS, which was used to extract the geometry of the dural sinuses for forward modeling. The rest of the veins/arteries were masked out using the eroded SHARP-based brain mask. The internal phase of the SSS (white arrow on Fig.2b) and external phase of the SSS (black arrow on Fig.2b) are now clearly visible. The susceptibility mapping results were then compared between the conventional SHARP processed QSM (Fig.2c) and the QSM generated using the proposed method of phase preservation outside the brain (Fig.2d). This new method clearly shows the SSS, whereas the conventional SHARP processed QSM (Fig.2c) are unable to image this structure. Similarly, in order to validate the proposed approach, the mean susceptibility inside the StrS was measured from one volunteer as: 449±42ppb for conventional QSM and 455±55ppb for the proposed QSM method, showing good agreement in the reconstruction.Discussion and Conclusion
In this work, we have presented a method to generate the susceptibility distribution of the whole brain, including the SSS (as well as potentially all the cortical veins), using a high resolution SWI acquisition with a total acquisition time of 6 minutes. The main limitations of this approach are: 1) the requirement of knowing the structure’s geometry to accurately predict the forward model phase and 2) the assumption of a priori knowledge of the susceptibility property of the structure-of-interest. The first limitation was addressed by acquiring a flow-rephased/dephased acquisition to generate the MRAV and provide geometry information for the dural sinuses. Furthermore, the conventional QSM results already provides us with an estimate of venous saturation levels, which helps to overcome the second limitation. By simulating the external phase for the SSS, we can provide the missing part of the phase information to produce a more accurate measurement of the oxygen saturation. Although it has been shown recently that flow through magnetic field gradients in the frontal sinuses can cause the arteries to develop phase, flow in the veins is slow and field variations by the dural sinuses are small; therefore, we do not expect this effect to produce significant phase variations in veins.Acknowledgements
This work was supported by the National Institutes of Health (NIH grant # R21NS090153). The views,opinions and/or findings contained in this report are those of the author(s) and should not be construed as an official government position, policy or decision unless so designated by other documentation.
References
[1] Haacke et al., JMRI(2010);32:663–76.
[2] Schweser et al. NeuroImage(2011);54:2789–2807.
[3] Wang et al., JMRI(2000);12:661-670.
[4] Topfer et al., MRM(2015); 73:851-856.
[5] Neelavalli, J. et al. JMRI (2009) 29:937-948
Figures