3664
QSM0 - QSM with automatic uniform CSF zero reference1Meinig School of Biomedical Engineering, Cornell University, Ithaca, NY, United States, 2Department of Radiology, Weill Cornell Medical College, New York, NY, United States
Synopsis
One challenge in Quantitative Susceptibility Mapping (QSM) identified in a recent QSM workshop is zero reference. Cerebrospinal fluid (CSF) with little cellular content has been a popular choice. However, current QSM often shows inhomogeneous CSF, which may be regarded as artifacts caused by surrounding anisotropic white matter fibers in the scalar dipole inversion. We propose a regularization of minimal CSF variation for projecting out CSF inhomogeneity artifacts. Our proposed new QSM incorporates automated segmentation and regularization specific to CSF and outputs susceptibility values with automatic and uniform CSF zero reference. Accordingly, we term this novel QSM method as QSM0
Introduction
Current QSM 1 quantifies magnetic susceptibility up to a reference constant. A common reference is cerebrospinal fluid (CSF), because CSF is chemically almost pure water, and CSF susceptibility has good inter-subject stability when measured on a properly chosen region of interest (ROI) 2. However, CSF is always inhomogeneous in current QSM, making CSF reference sensitive to ROI choice. This CSF inhomogeneity may be caused by surrounding white matter anisotropy, which is a dipole-incompatible source generating artifacts in the dipole inversion. Inspired by the enforcement of minimal non-tissue edges in current QSM for penalizing noise-related streaking artifact, we propose a novel QSM0 that enforces CSF homogeneity during the field inversion optimization using automated CSF segmentation. This QSM0 method automatically allows CSF zero reference with expected biophysical homogeneity.Methods
The optimization problem for proposed QSM0 is:
$$\chi^*=arg\min_{\chi}\frac{1}{2}\parallel w \left( e^{if}-e^{i\left(d\star\chi\right)} \right) \parallel_2^2 + \lambda_1 \parallel M_G\triangledown\chi \parallel_1 + \lambda_2 \parallel M_{CSF}\left(\chi-\overline{\chi_{CSF}}\right) \parallel_2^2 (1)$$
with $$$\chi$$$ the susceptibility map, $$$\star$$$ the convolution with the dipole kernel $$$d$$$, $$$w$$$ the noise weighting, $$$f$$$ the local field, $$$\triangledown$$$ the gradient operator and $$$M_G$$$ the binary edge mask derived from the magnitude image 3. It differs from the current QSM method MEDI 3 by the addition of an L2-regularization, where $$$M_{CSF}$$$ is ROI of ventricular CSF with a mean susceptibility $$$\overline{\chi_{CSF}}$$$. This additional term penalizes large susceptibility variance within ventricular CSF.
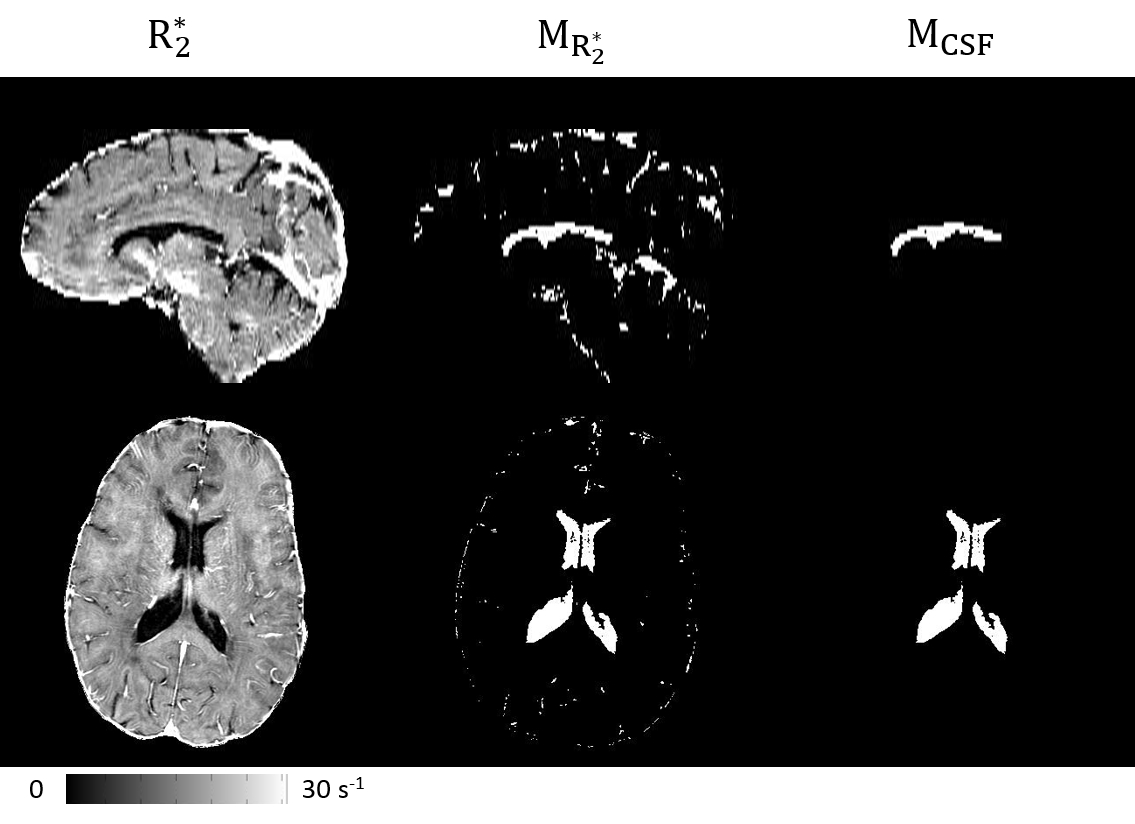
$$$M_{CSF}$$$ is determined in following automated steps: (a) Threshold $$$R_2^*$$$: $$$M_{R_2^*}=R_2^*<5s^{-1}$$$. (b) Define brain centroid: $$$\mathbf{c} =\frac{1}{N}\sum_{\mathbf{r}\subset M}\mathbf{r}$$$, where $$$M$$$ is the brain mask of $$$N$$$ voxels. (c) Define central brain region: $$$M_c=\left\{\mathbf{r}|\parallel \mathbf{r}-\mathbf{c} \parallel_2 <3\mathrm{cm}\right\}$$$. (d) Analyze connectivity: devide $$$M_c\cap M_{R_2^*}$$$ into connected components $$$M_{ci}$$$ (6-neighbor), and merge the largest 2 components: $$$M_{cCSF}=M_{c1}\cup M_{c2}$$$; Then divide $$$M_{R_2^*}$$$ into connected components $$$M_{i}$$$ (6-neighbor), and merge all components overlapping with $$$M_{cCSF}$$$: $$$M_{CSF}=\left\{\cup M_i\mid M_i\cap M_{cCSF}\neq\varnothing \right\}$$$. An example for this process is illustrated in Fig.1. The problem (1) is solved using Gauss Newton Conjugate Gradient 3. In the end of the method, $$$\overline{\chi_{CSF}}$$$ is subtracted from the entire map for zero reference.
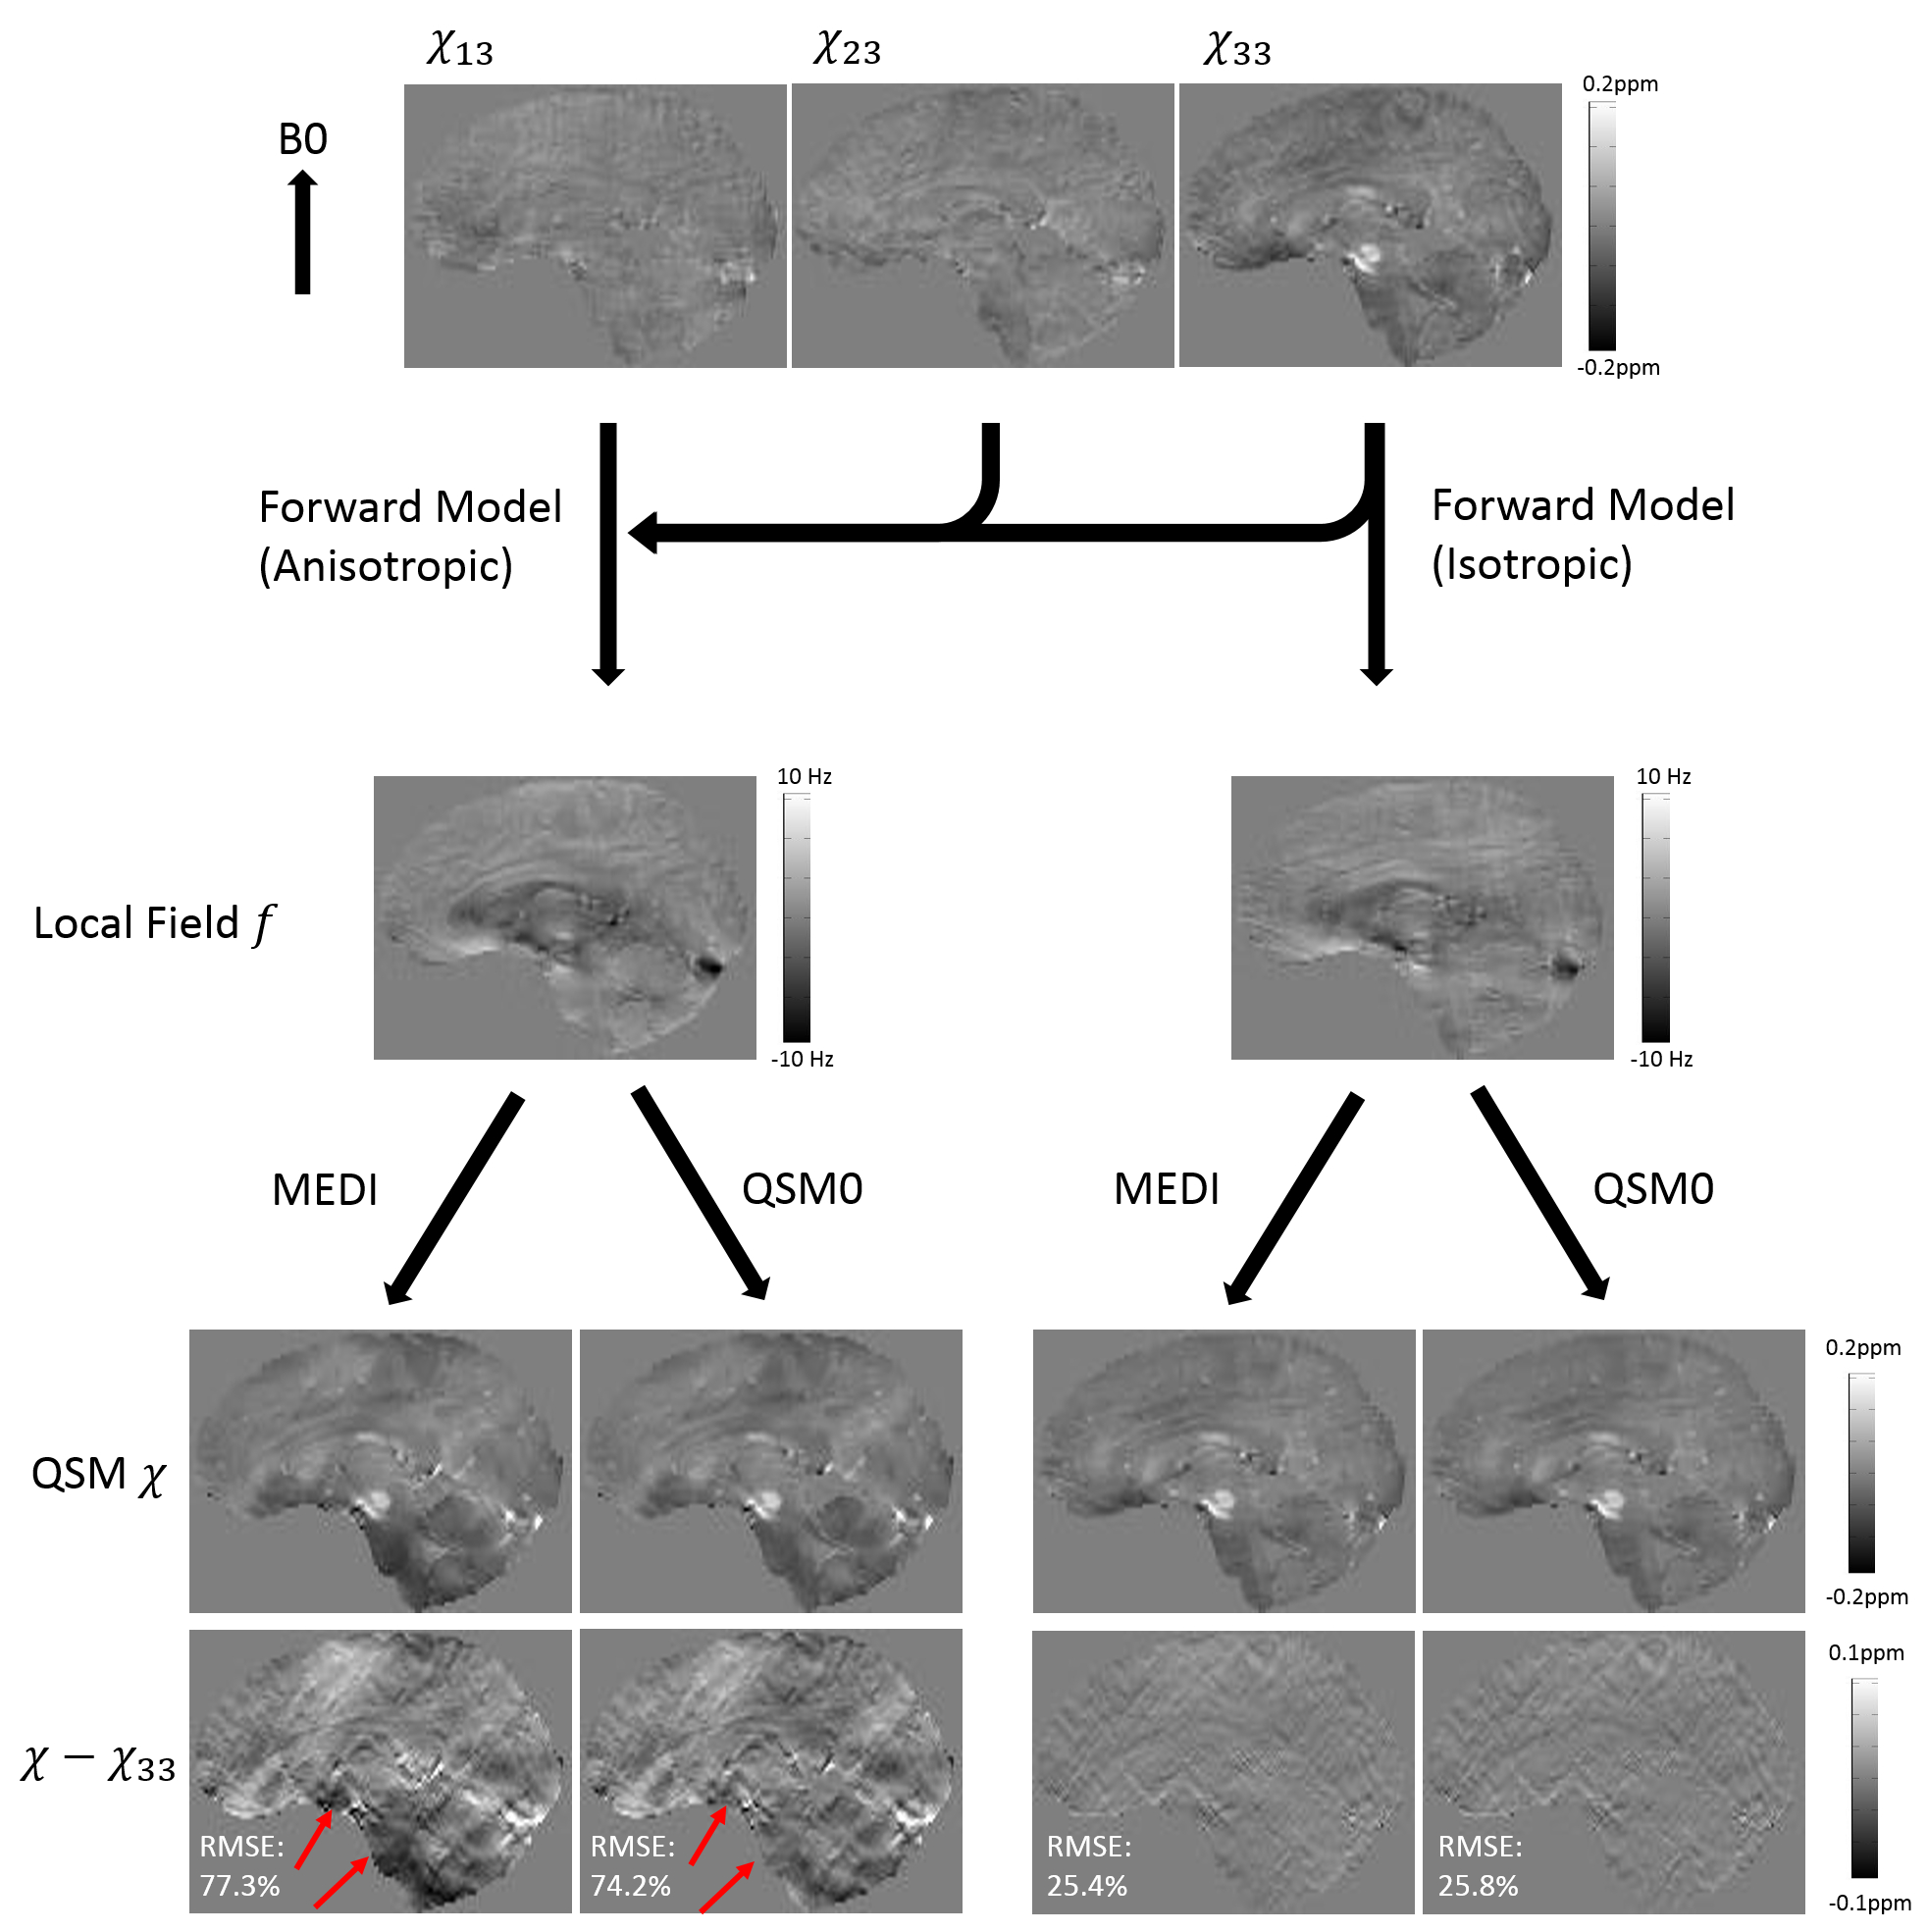
Considering white matter (WM) susceptibility anisotropy as a cause of CSF inhomogeneity, we constructed a numerical brain phantom with anisotropic susceptibility $$$\left( \chi_{13},\chi_{23},\chi_{33} \right)$$$ in WM and zero susceptibility in CSF (Fig.2). Local fields with and without anisotropic susceptibility were generated as:
$$F_1(k)=\left({\frac{1}{3}-\frac{k_z^2}{k^2}}\right)X_{33}-\frac{k_xk_z}{k^2}X_{13}-\frac{k_yk_z}{k^2}X_{23},\ \ \ \ \ \ \ \ \ \ \ \ F_2(k)=\left({\frac{1}{3}-\frac{k_z^2}{k^2}}\right)X_{33}\ \ \ \ (2)$$
QSMs were reconstructed from these two fields using MEDI ($$$\lambda_1=0.001$$$) and QSM0 ($$$\lambda_1=0.001,\lambda_2=0.1$$$) and compared to $$$\chi_{33}$$$
MEDI and QSM0 were then applied to human brains of 8 patients with Multiple Sclerosis (MS). The in vivo data were acquired at 3T with 20° flip angle, 24cm FOV, $$$0.5\times0.5\times2\mathrm{mm^3}$$$ resolution and 4.8msec echo spacing. Background field was estimated and removed using PDF 4. For quantitative comparison, susceptibility was measured for each lesion, relative to normal appearing white matter (NAWM) at the contralateral mirror site.
Results
In simulation (Fig.2), both MEDI and QSM0 recovered $$$\chi_{33}$$$ from field $$$F_2$$$ within similar root-mean-square-error (RMSE) of 25.4% and 25.8%, respectively. However, for field $$$F_1$$$ containing anisotropic contribution, QSM0 had a smaller RMSE (74.2%) than that of MEDI (77.3%), and QSM0 reduced artifacts in deep brain compared with MEDI (Fig.2, red arrows).
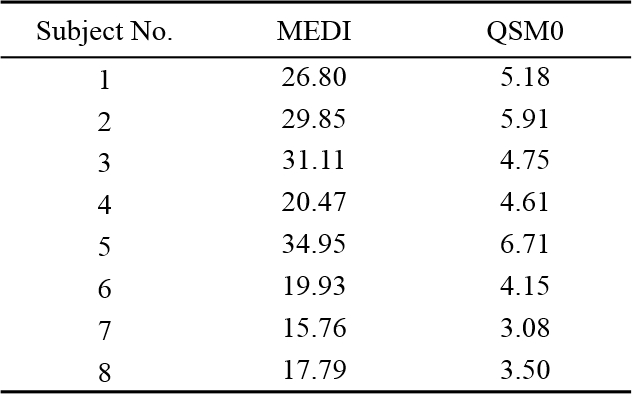
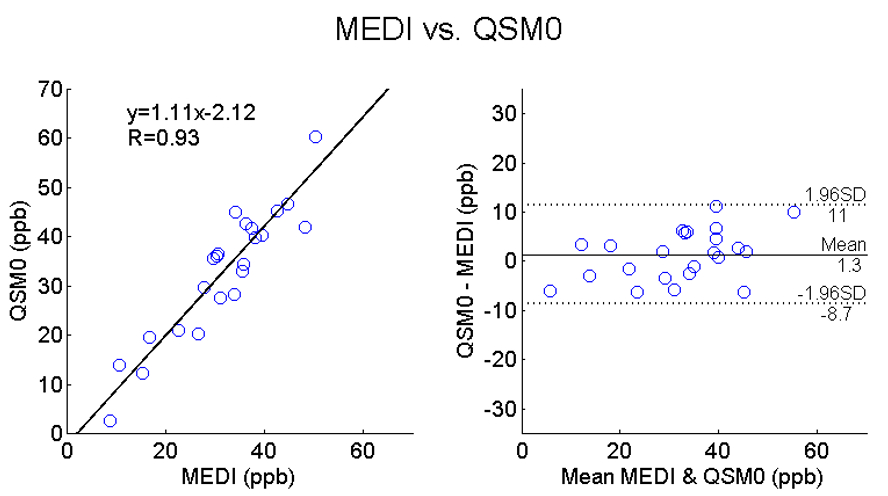
For all 8 subjects, compared to MEDI, QSM0 achieved artifact suppression (Fig.3) similar to simulation, a 5-fold reduction of the susceptibility standard deviation within ventricle CSF (Fig.4), and MS lesion-to-NAWM contrasts with a strong correlation to MEDI $$$\left(k=1.11, R=0.93\right)$$$. The scatter and Bland-Altman plots (Fig.5) of MS lesion susceptibility measurements from all subjects showed a small 1.3ppb bias and a narrow [-8.7,11ppb] limits of agreement between MEDI and QSM0.
Discussion
The proposed QSM0 method reduces artifacts including CSF susceptibility inhomogeneity, which may be induced by susceptibility anisotropy when processing single orientation data. With CSF-specific regularization, susceptibility variation within ventricles is reduced, hence making QSM measurement less sensitive to the choice of ROI when CSF is used as the zero reference. Meanwhile, in tissue contrast analysis such as MS lesion relative to NAWM, QSM0 shows strong agreement with MEDI, a current QSM method. It should be noted that the proposed regularization term in (1) does not eliminate anisotropy effects in the scalar dipole field inversion (1), which explains the residual artifact in Fig.2 that may be induced by anisotropy.Conclusion
Our proposed QSM0 automatically segments CSF, enforces CSF homogeneity during reconstruction, and reduces QSM artifacts, therefore, successfully addresses the current QSM zero reference challenge with an automated uniform CSF.Acknowledgements
We acknowledge support from NIH grants R01 NS072370, R01 NS090464 and R01 NS095562.References
1. Wang, Y, et al. Quantitative susceptibility mapping (QSM): decoding MRI data for a tissue magnetic biomarker. MRM. 2015; 73(1): 82-101.
2. Straub, S, et al. Suitable reference tissues for quantitative susceptibility mapping of the brain. MRM. 2016. DOI 10.1002/mrm.26369.
3. Liu, T, et al. Nonlinear formulation of the magnetic field to source relationship for robust quantitative susceptibility mapping. MRM. 2013. 69(2): 467-476.
4. Liu, T, et al. A novel background field removal method for MRI using projection onto dipole fields (PDF). NMR in BioMed. 2011. 24(9): 1129-1136.
Figures