3663
Optimization of Preconditioned Total Field Inversion for Whole head QSM and Cardiac QSM1Meinig School of Biomedical Engineering, Cornell University, Ithaca, NY, United States, 2Department of Radiology, Weill Cornell Medical College, New York, NY, United States
Synopsis
Preconditioned Total Field Inversion (TFI) allows QSM for the entire head and chest. The preconditioner determines the TFI convergence. Can we choose a preconditioner that maximizes QSM quality within limited computational time? To answer this question, we conducted two numerical simulations specific to these applications to search for an optimal preconditioner. We found that preconditioner too small or too big for a targeted susceptibility distribution would have less computational acceleration and consequently greater errors for a given computational time. Our results here suggest that the optimal preconditioner should be identified to match the image content.
Introduction
Preconditioned Total Field Inversion (TFI) has been developed for QSM of the entire head 1 and the heart 2. However, how to choose preconditioning is yet to be adequately investigated, and we need a guide to determine the preconditioning in TFI for specific applications. We conjecture that a preconditioner needs to match the targeted solution to generate maximal computational acceleration, indicated by minimal error for a given computational time. Accordingly, we performed numerical simulation, where truth is known, to examine the influence of different preconditioner on the accuracy of TFI. We thus identified experimentally optimal choices of preconditioner for in vivo TFI implementation in whole head QSM and cardiac QSM.Methods
In this work, preconditioned TFI solves:
$$\chi^*=Py^*\ \ \ \ \ \ \ \ s.t.\ \ \ \ \ \ \ \ y^*=arg\min_{y}\Phi(y)=\frac{1}{2}\parallel w\left(f-d\star Py\right) \parallel_2^2+\lambda\parallel M_G\triangledown y \parallel_1 (1)$$
with $$$\chi$$$ the total susceptibility, $$$\star$$$ the convolution with the dipole kernel $$$d$$$, $$$f$$$ the total field, $$$w$$$ the noise weighting, $$$\triangledown$$$ the gradient operator and $$$M_G$$$ the binary edge weight suppressing streaking artifact. The preconditioner $$$P$$$, which accounts for strong susceptibility contrast between tissues 1, was constructed as:
$$P=M+P_S(1-M)\ \ \ \ (2)$$
with $$$M$$$ the region of soft tissue (e.g. brain, blood, fat), and $$$P_S$$$ the preconditioning weight for tissue of strong susceptibility such as air or bone. Two numerical simulations were designed to determine $$$P_S$$$:
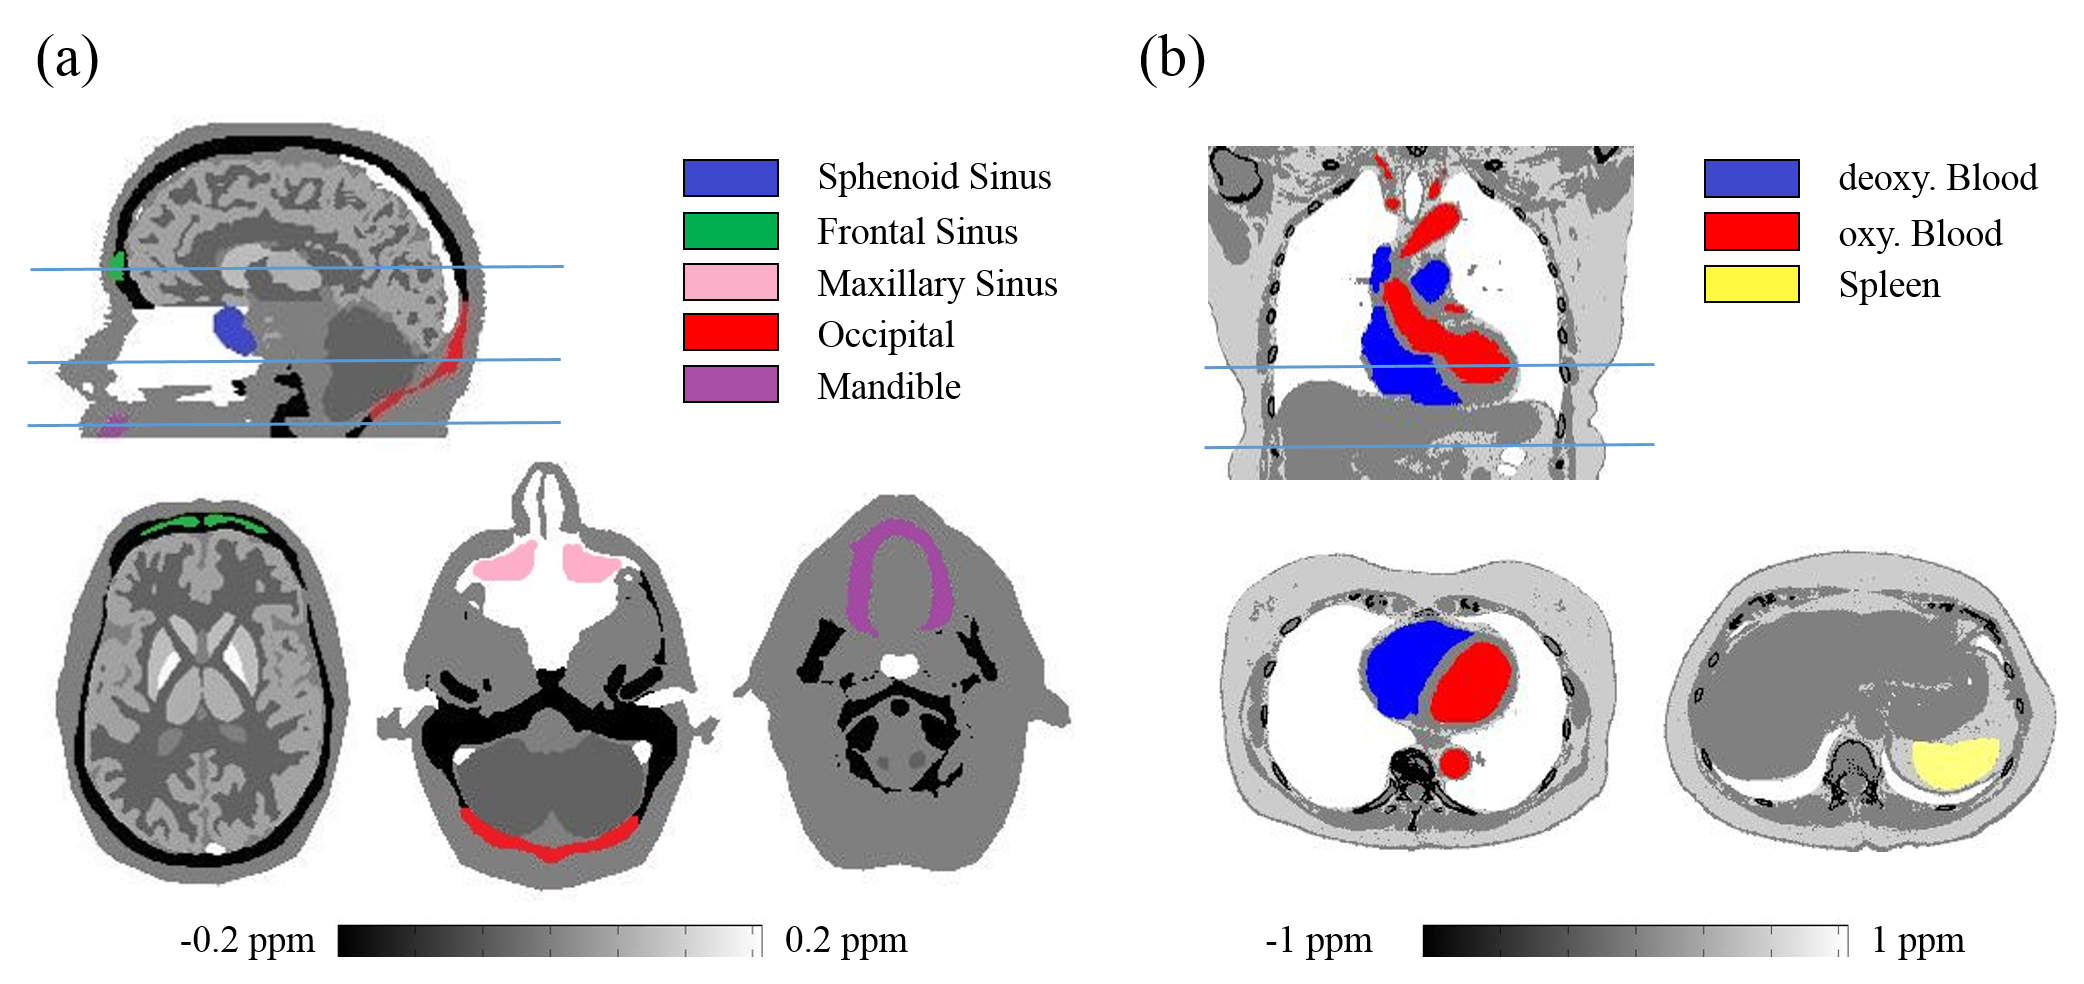
A numerical head susceptibility phantom (Fig.1a) was constructed using the Zubal phantom 3 with simulated susceptibility values in Fig.3. Background susceptibility outside the head was 9ppm. Total field $$$f$$$ was generated with $$$\mathrm{voxel\ size}=1\times1\times1.4\ \mathrm{mm^3,\ TE=3ms,\ B_0=3T,\ SNR=100}$$$.
A numerical chest susceptibility phantom (Fig.1b) was constructed by adapting a CT scan from NBIA public database 4, with simulated susceptibility values in Fig.3. Background susceptibility outside the chest was 9ppm. Total field $$$f$$$ was generated with $$$\mathrm{voxel\ size}=1.4\times1.4\times2\ \mathrm{mm^3,\ TE=2.5ms,\ B_0=1.5T,\ SNR=100}$$$.
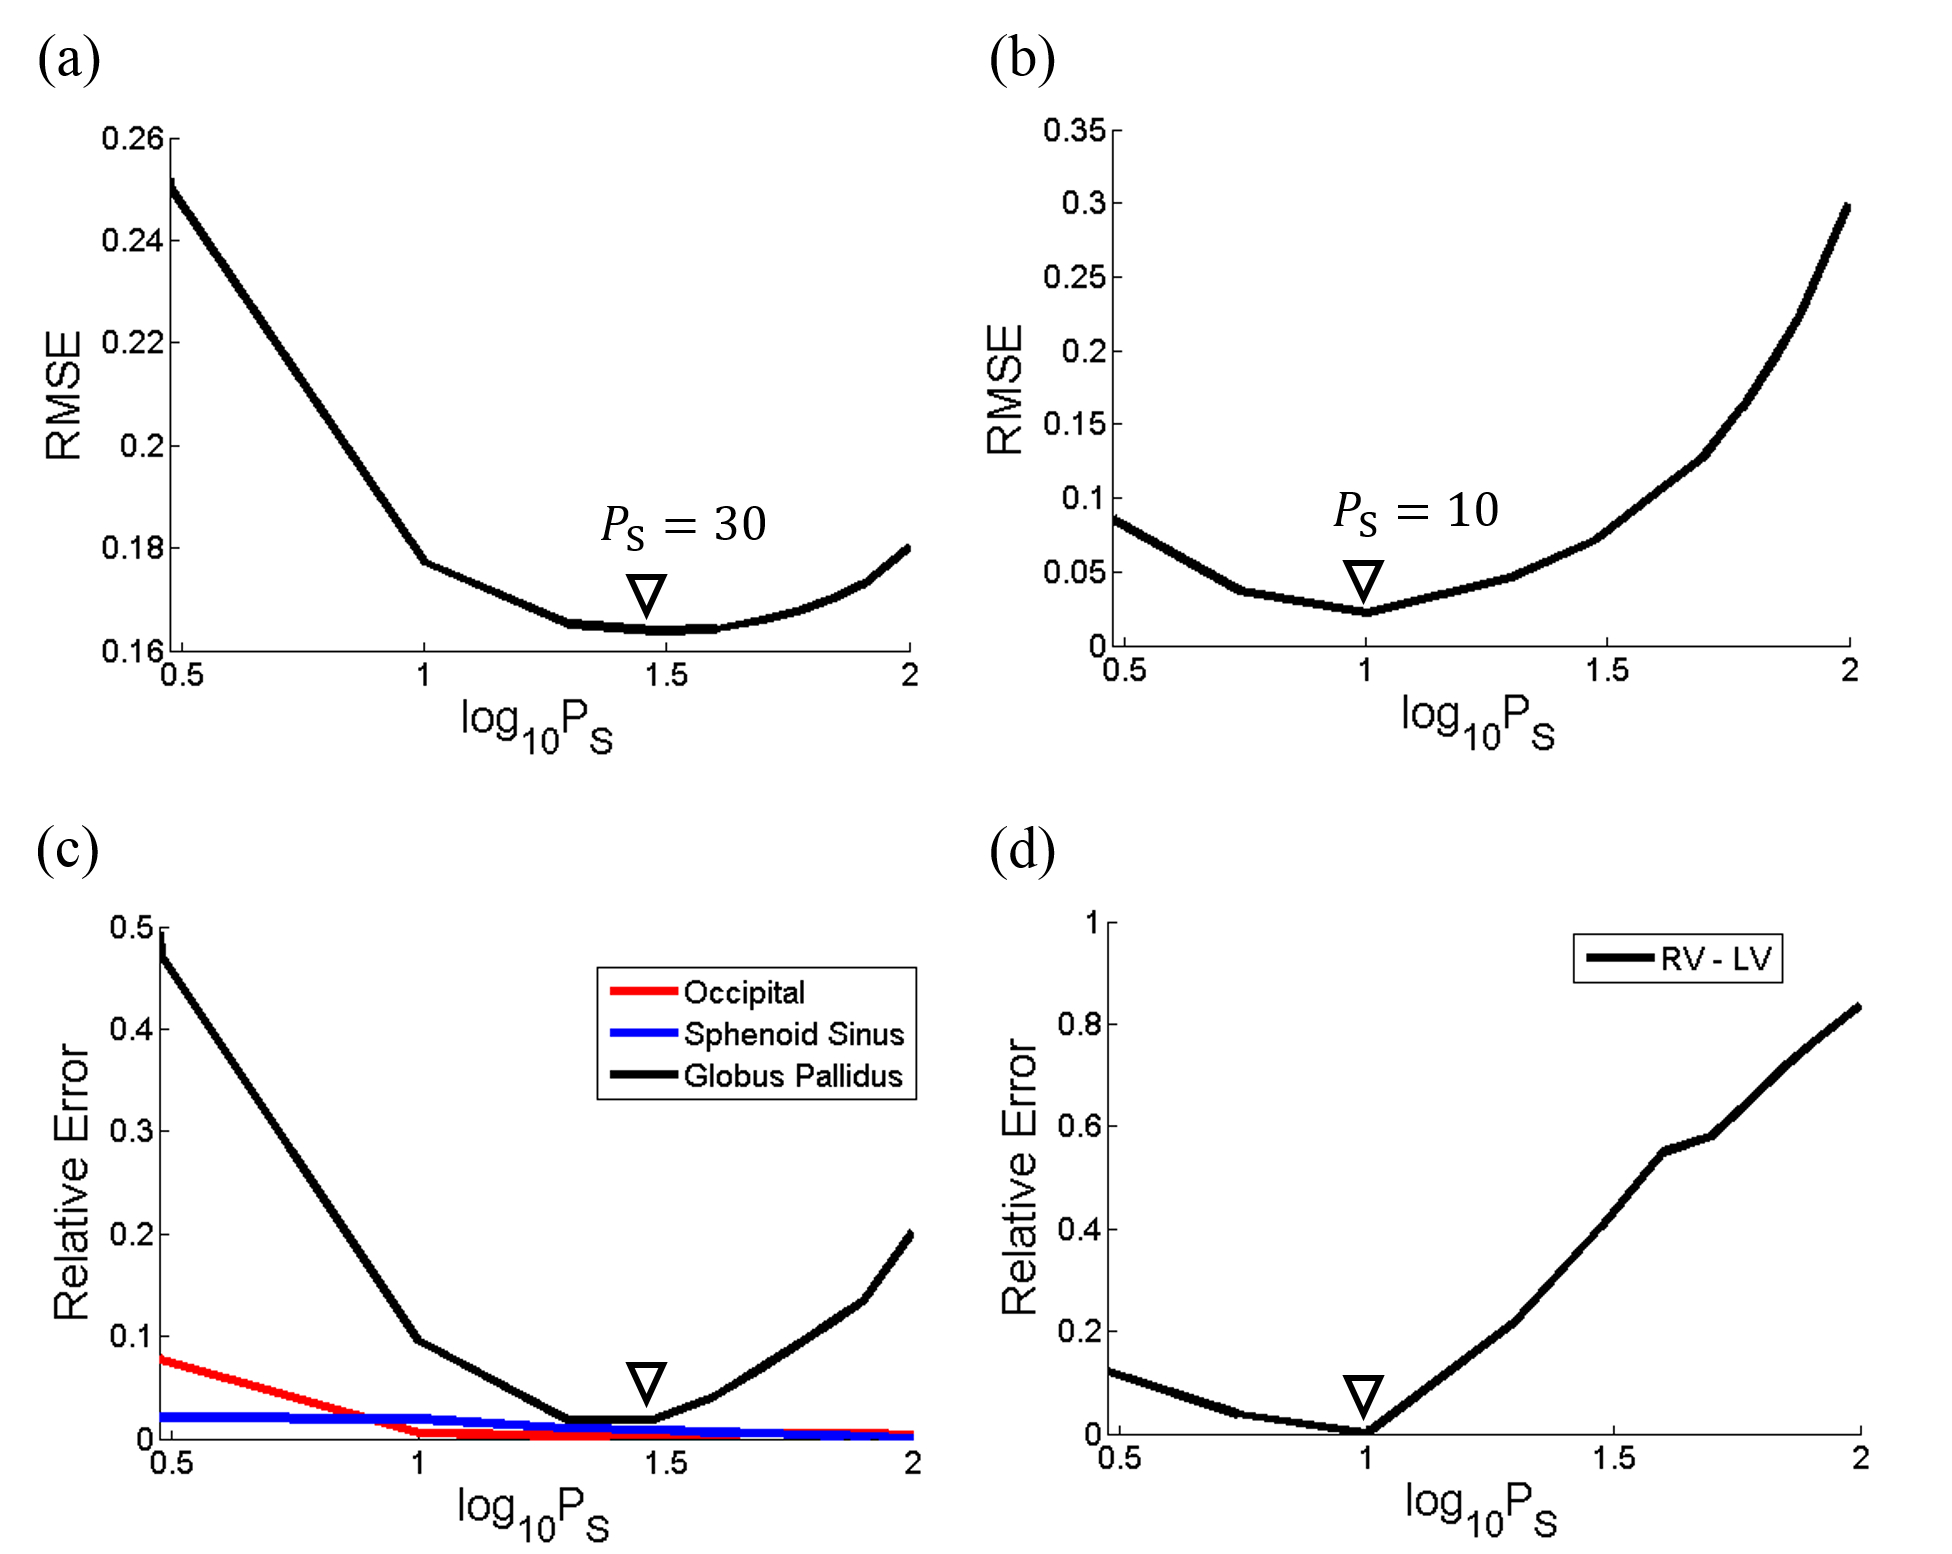
TFI was applied to estimate QSM for the entire head or chest, and solved using Gauss-Newton-Conjugate-Gradient. The optimal $$$P_S$$$ was chosen to minimize the root-mean-square-error (RMSE) between true and estimated susceptibility maps after 300 CG iterations, respectively in each simulation. $$$\lambda=0.003$$$ was used. Susceptibility within ROI of different tissue was measured and compared with truth.
The optimized TFI was tested in vivo on a head scan (3T GE, Waukesha, WI; Multi-echo 3DGRE; $$$0.5\times0.5\times0.5\ \mathrm{mm^3,\ TE_1=4.5ms,\ \triangle TE=4.5ms,\ nTE=10}$$$) and a cardiac scan (1.5T GE, Waukesha, WI; Multi-slice multi-echo 2D-FGRE; $$$1.25\times1.25\times5\ \mathrm{mm^3,\ TE_1=3.6ms,\ \triangle TE=2.2ms,\ nTE=8}$$$). Tissue susceptibility was measured using manually drawn ROI.
Results
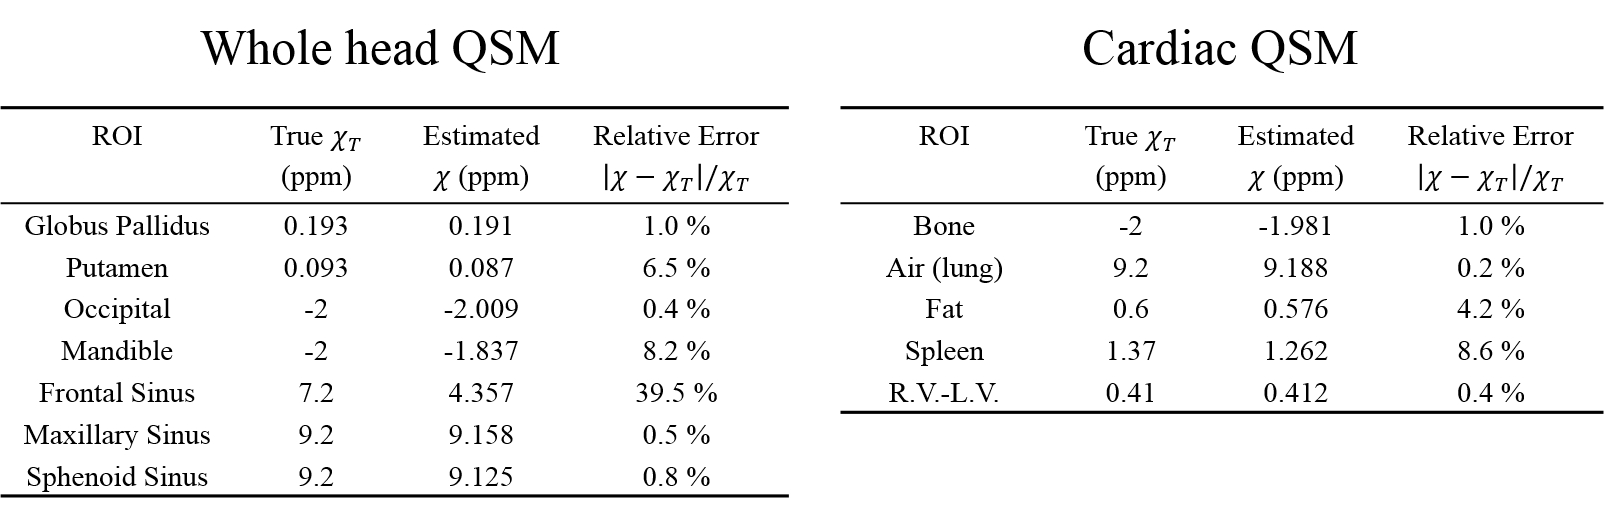
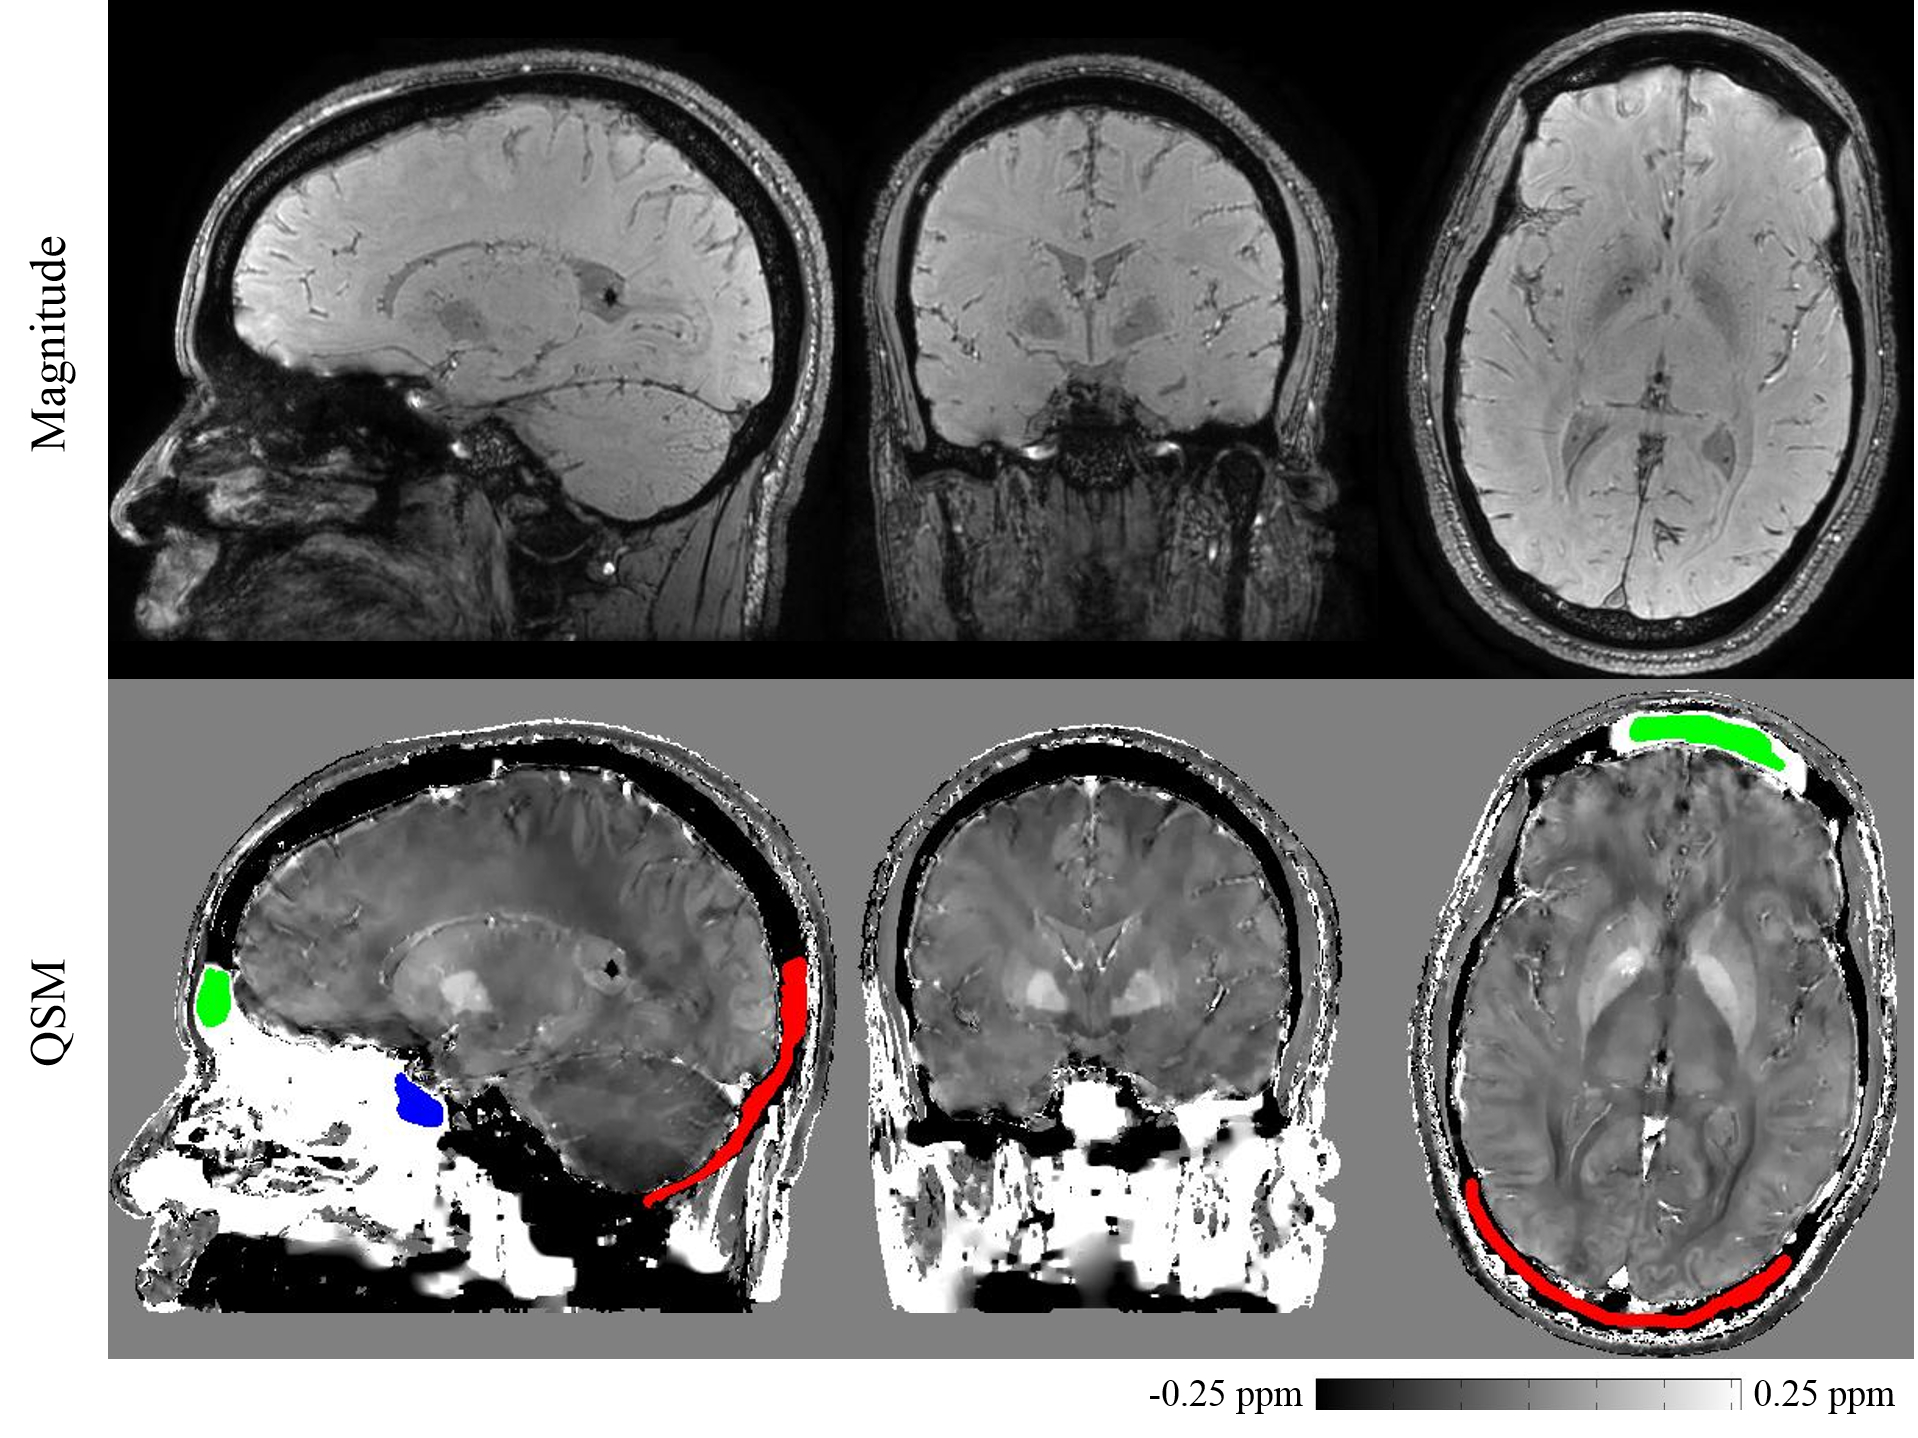
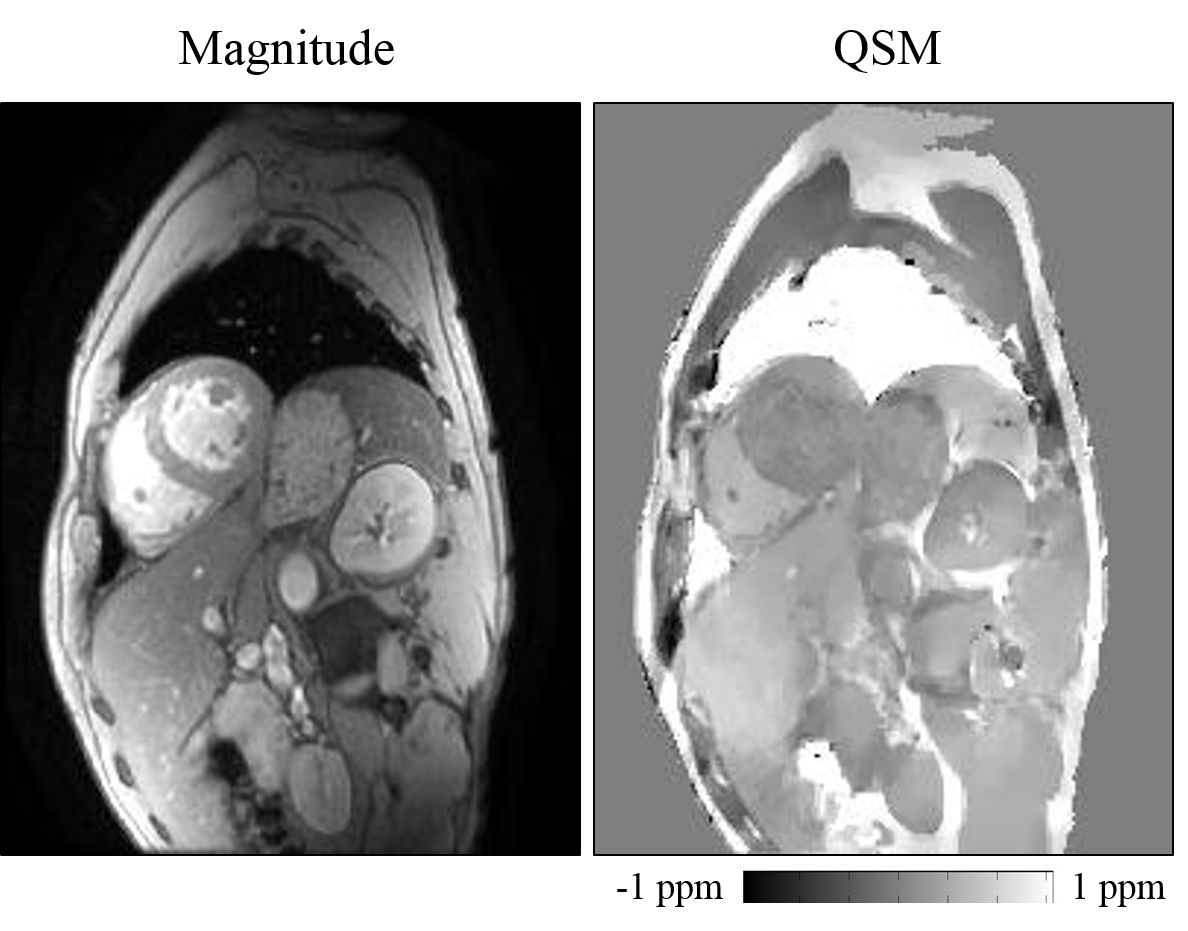
Fig.2 shows that, optimal $$$P_S$$$ was 30 for head and 10 for cardiac, by minimizing RMSE between the estimated and true susceptibility. Relative error in measuring occipital skull (bone) and sphenoid sinus (air) was always below 10% regardless of $$$P_S=3\sim100$$$, while globus pallidus was sensitive to $$$P_S$$$ and its error could easily surpass 10% if $$$P_S<10$$$ or $$$P_S>50$$$. In cardiac simulation, relative error in measuring difference of blood susceptibility between right and left ventricle, $$$\chi_{RV-LV}$$$, was below 12% when $$$P_S<10$$$, but drastically increases with larger $$$P_S$$$. Detailed measurements with optimal $$$P_S$$$ were listed in Fig.3, with relative error below 9% for most tissue except for the frontal sinus, for which the error was significant (39.5%). In vivo whole head QSM ($$$P_S=30$$$) was shown in Fig.4, where mean susceptibility was 7.89ppm for sphenoid sinus, -2.19ppm for occipital skull and 3.87ppm for frontal sinus. In vivo cardiac QSM ($$$P_S=10$$$) was shown in Fig.5, with a difference of 0.39ppm between RV and LV.Discussion
The optimized preconditioner in our simulations minimized the RMSE within 300 CG iterations, which represented the average computing effort of TFI. Tissue with weak susceptibility, such as brain or blood, was more sensitive to varied preconditioner, compared to strong sources like bone or air. The difference in optimal preconditioning weights (30 and 10) reflects different magnitudes of susceptibility contrast in each application as suggested in Fig.3 (Head: brain (0~0.2ppm) versus air/bone (2~9ppm); Chest: soft tissue (0.4~1.4ppm) versus air/bone (2~9ppm)) . The significant error for frontal sinus might be caused by the absence of edge information between the sinus and surrounding skull, which could be ameliorated by the use of ultra-short echo time (UTE) 5 sequence for bone signal acquisition. Future work will be conducted on calibration of TFI measurement in vivo.Conclusion
Preconditioned Total Field Inversion is optimized using numerical simulation for accurate susceptibility measurement of both strong and weak sources in applications of whole head QSM and cardiac QSM. The experimental preconditioner choice is demonstrated in vivo and provides guidance of parameter selection for in vivo TFI application.Acknowledgements
We acknowledge support from NIH grants R01 NS072370, R01 NS090464 and R01 NS095562.References
1. Liu, Z, et al. Preconditioned total field inversion (TFI) method for quantitative susceptibility mapping. MRM. 2016. DOI:10.1002/mrm.26331.
2. Wen, Y, et al. In vivo Quantitative Susceptibility Mapping (QSM) in cardiac MRI. ISMRM. 2016. p0417.
3. Zubal, G, et al. Computerized three-dimensional segmented human anatomy. Med Physics. 1994. 21(2): 299-302.
4. National Biomedical Imaging Archive (NBIA). Available from: https://imaging.nci.nih.gov/ncia/login.jsf.
5. Du, J, et al. Short T2 contrast with three-dimensional ultrashort echo time imaging. MRI. 2011. 29(4): 470-482
Figures