3658
Variation of Regions of Interest (ROIs) using different tools for automatic ROI generation: The impact on reported magnetic susceptibility values in QSM1Medical Physics and Biomedical Engineering, University College London, London, United Kingdom, 2Leonard Wolfson Experimental Neurology Centre, University College London, Institute of Neurology, United Kingdom, 3Institute of Nuclear Medicine, UCLH-NHS Foundation Trust, United Kingdom
Synopsis
Automatic Region of Interest (ROI) generation is useful for large clinical studies using Quantitative Susceptibility Mapping (QSM) as this allows mean susceptibility values for anatomical regions to be reported without manual intervention.
Several methods to generate ROIs are compared in this work. We found that methods based on T1 contrast showed little variation whether a typical magnitude image from a susceptibility protocol or a structural MPRAGE image was used. An additional method based on a QSM atlas showed greater variability in ROIs.
Mean susceptibility values for ROIs were shown to vary greatly depending on the method used to generate ROIs.
Introduction
Studies using Quantitative Susceptibility Mapping (QSM) are now being carried out for numerous research and clinical applications. Magnetic susceptibility values in brain regions such as those within the deep gray matter are often of interest. Additionally, as susceptibility values are relative, selection of a suitable reference region is necessary. Automatic Region of Interest (ROI) generation is desirable for large studies in which manual ROI definition is impractical. Here we applied three methods and assessed the similarity between ROIs and their average susceptibility values.Methods
Susceptibility maps (SMs) were calculated from 9 3D GRE phase images (parameters along with MPRAGE in Fig 1; all subjects aged 69) collected as part of an ongoing PET-MRI study of ageing (GRE images will be referred to as Ageing Study - AS). Complex fitting1 of the phase data resulted in a frequency map and residual wraps were removed using PRELUDE2. The local frequency was extracted using PDF3 and the susceptibility calculated using Tikhonov regularisation4 with PSF correction factor5 and regularisation parameter 0.05.
FSL FIRST6 and the GIF (Geodesic Information Flows) online tool7-9 which rely on T1-weighted images, were used for ROI generation. An alternative approach known as Eve10-13 was also used; in this method the Eve atlas templates (either Eve-magnitude or Eve-SM) were coregistered with the AS or MPRAGE images. NiftyReg14,15 was used to perform the coregistration using an affine registration as an initialisation for non-linear registration. The resulting transformation was then applied to Eve ROIs to generate ROIs in AS space.
For all three tools we assessed the difference between using AS-magnitude images (with little T1-contrast) and structural T1-weighted MPRAGE images to generate regions. MPRAGE images were coregistered to AS space before applying the ROI generation when using FIRST and Eve. However, as GIF parcellation had previously been performed in MPRAGE space, the labels were propagated to AS space.
The difference between using the coregistration of Eve-magnitude with AS-magnitude images and the coregistration of Eve-SM with AS-SM to propagate the Eve Atlas labels was assessed.
All combinations investigated and corresponding figures are shown in figure 2.
Results
Mean Dice Similarity Coefficients ($$$\mathsf{DSC}=\mathsf{2}\frac{\mathsf{A}∩\mathsf{B}}{\mathsf{A}∪\mathsf{B}}$$$) and mean absolute differences in average susceptibility within common ROIs using MPRAGE versus AS-magnitude are shown in figure 3a. Both FIRST and GIF gave small variations in ROIs. However, Eve ROIs and susceptibilities differed greatly depending on whether MPRAGE or AS-magnitude images were used.
Propagation of Eve labels resulted in very different ROIs depending on whether AS-SM or AS-magnitude were used for coregistration (Fig 3b).
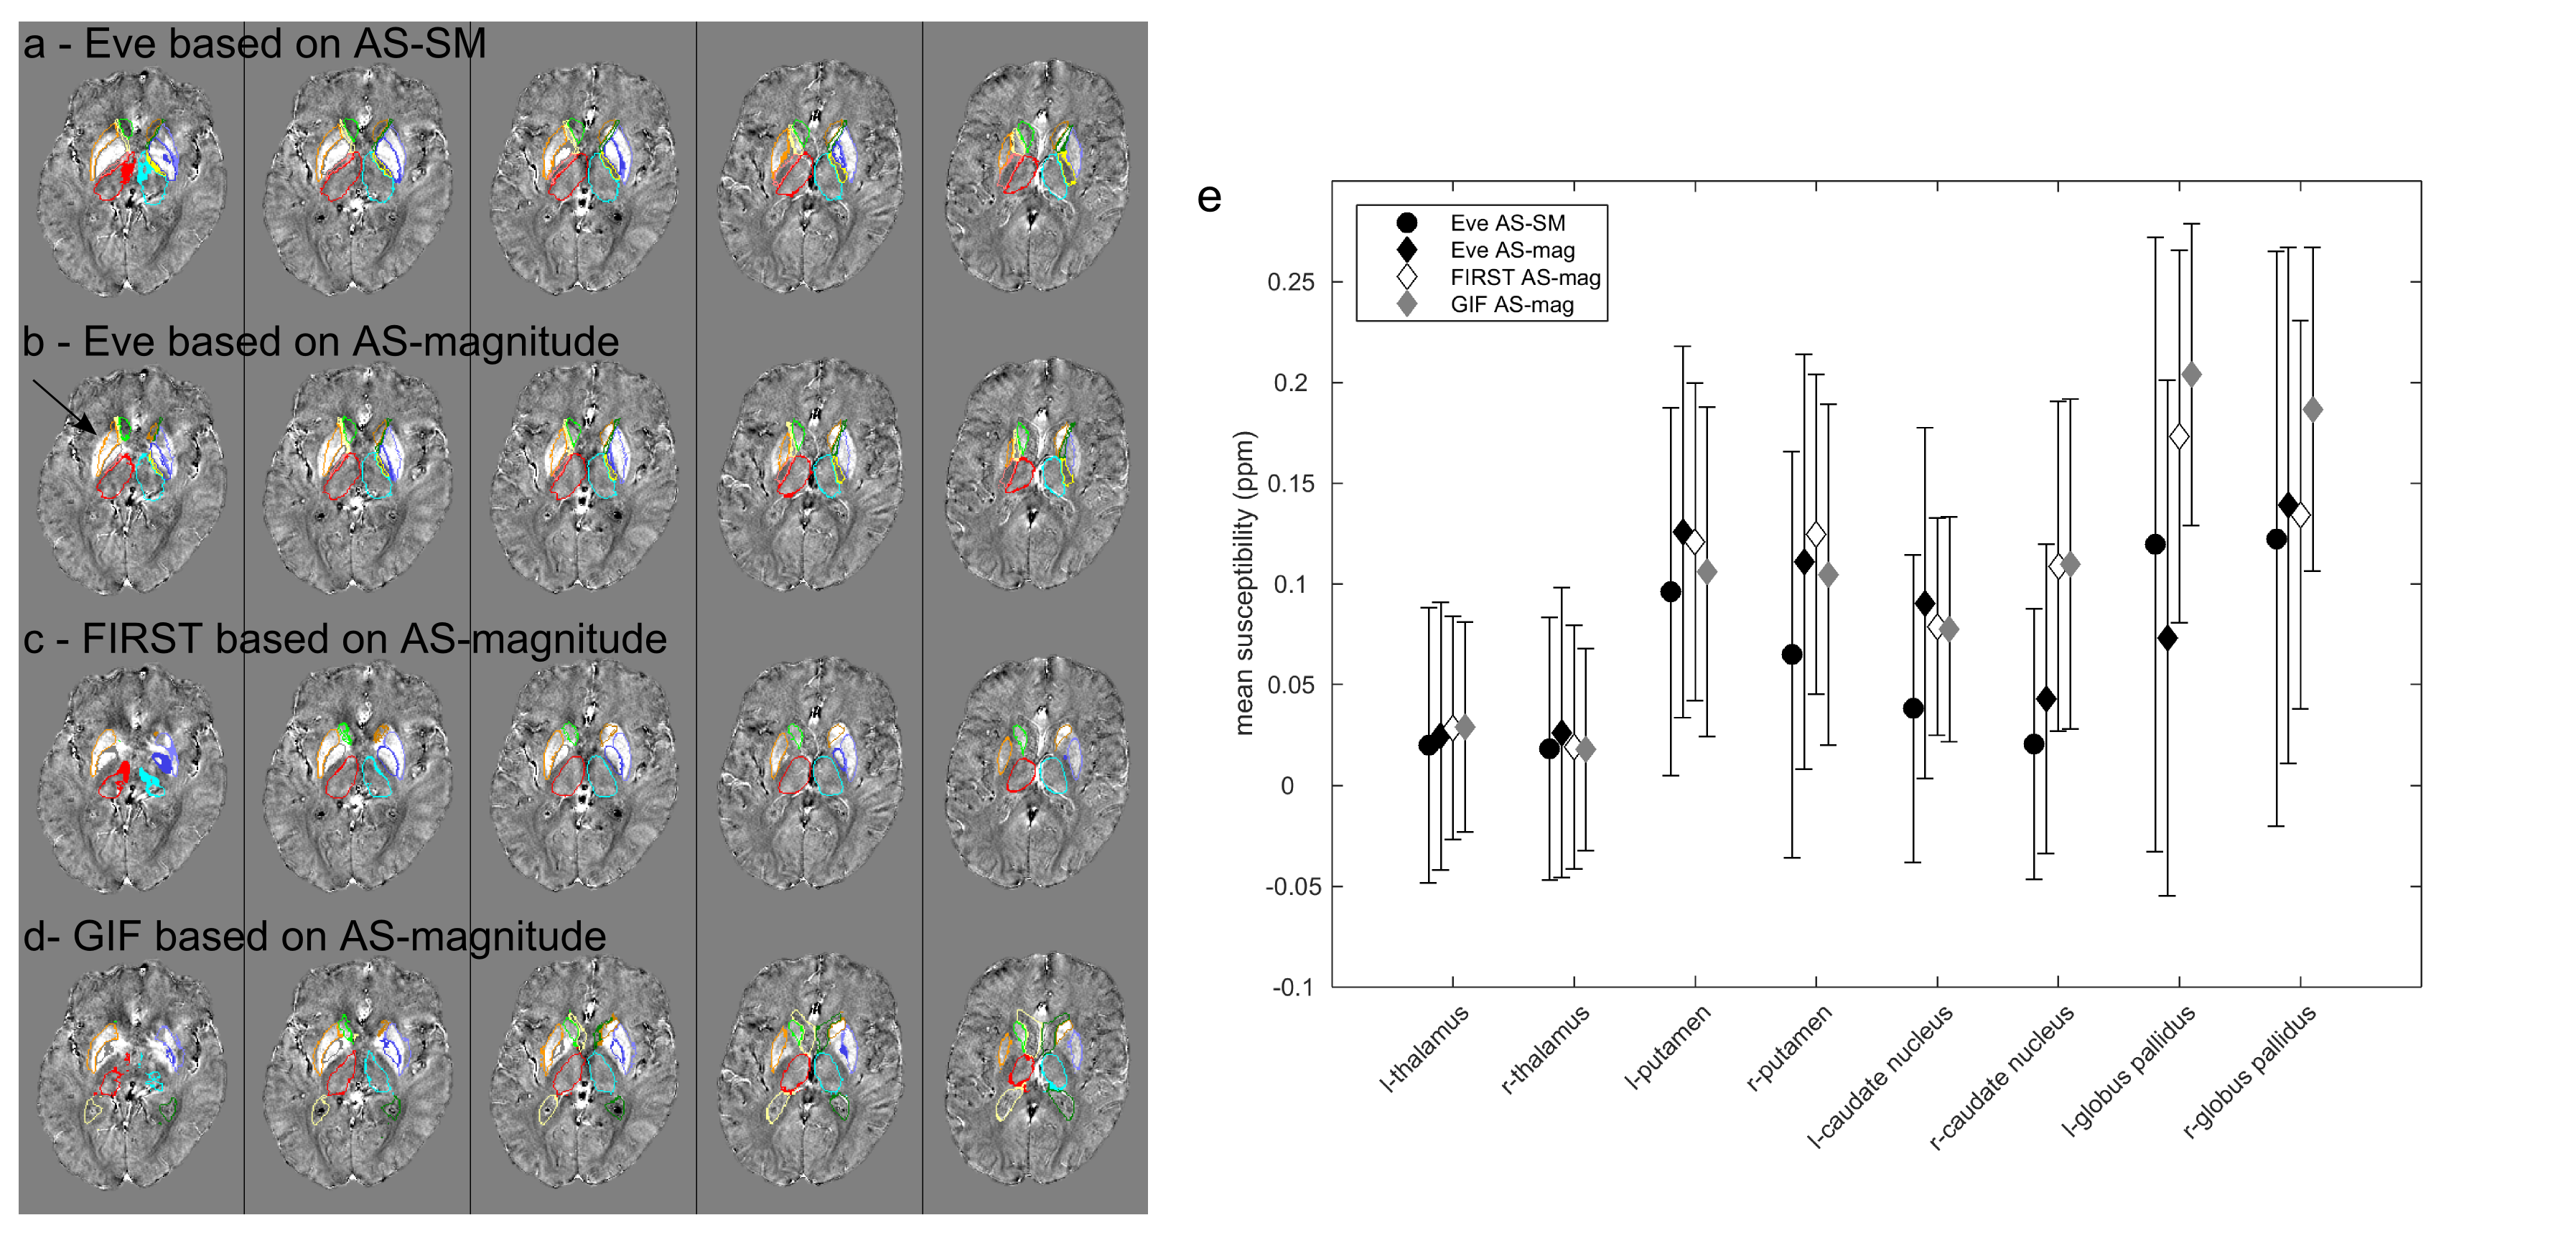
ROIs for a single subject using all three methods are shown in figure 4 with mean susceptibility values in each region. Incorrect label propagation is displayed in figure 4b.
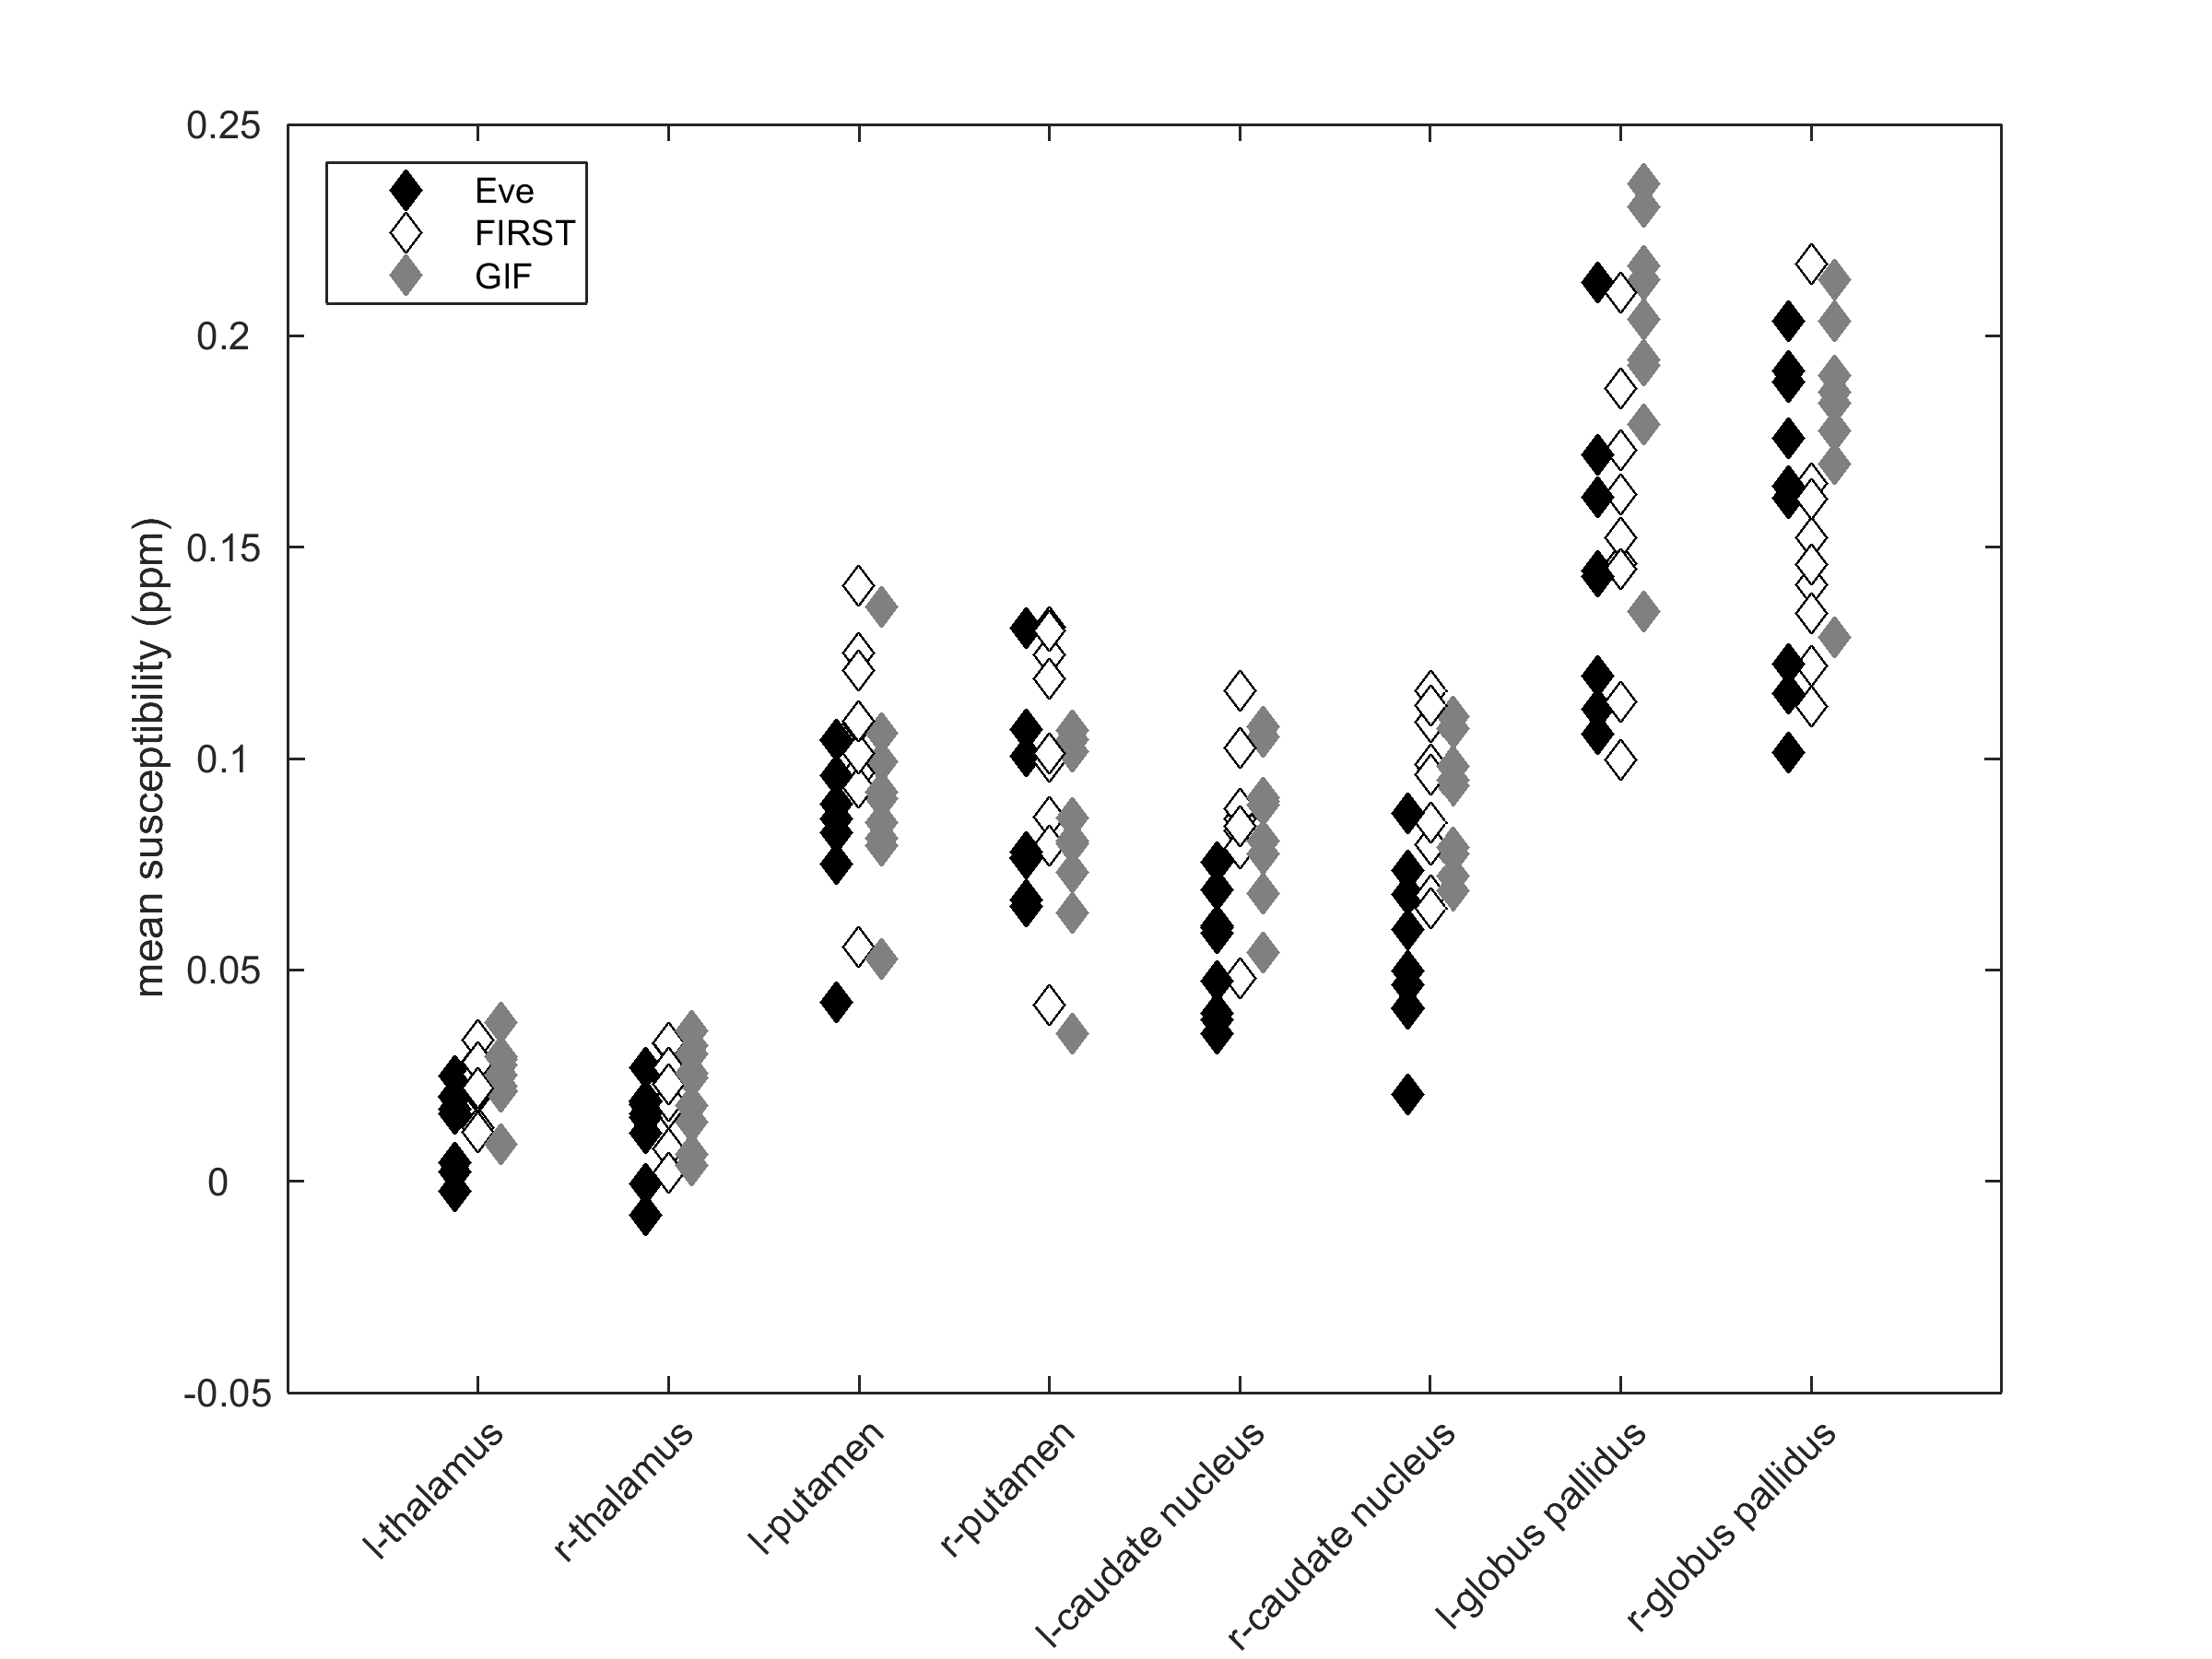
A comparison of Eve, FIRST and GIF mean susceptibility values for all subjects is shown in figure 5.
Discussion
FIRST and GIF ROIs were similar whether MPRAGE and AS-magnitude was used (Fig 3a). This suggests that although there was poor T1-contrast in the AS-magnitude images, the acquisition of an additional structural image may not be necessary.
The Eve ROIs showed larger differences depending on whether MPRAGE or AS-magnitude images were used. Neither AS-magnitude nor MPRAGE was well matched to the Eve-magnitude contrast due to different imaging parameters10. Additionally, the Eve ROIs showed great differences dependent on whether magnitude or SM images were used for coregistration (Fig 3b). The Eve and AS SM images were more visually similar than the magnitude images, which may make SM-based coregistration more successful (Fig 4). A further limitation may be that the participants in this study were much older than the subjects used to create the Eve-SM.
The comparison of Eve, FIRST and GIF all using AS-magnitude (Fig 5), shows that average susceptibility values across a study depend on the ROI method used. In general, GIF ROIs were seen to be smaller than ROIs from Eve or FIRST. The Globus Pallidus and Caudate Nucleus varied the most with ROI generation method, whereas the Thalamus ROIs showed low variation across methods as well as a small standard deviation in mean susceptibility values across subjects.
Conclusion
These results indicate that the choice of automatic ROI generation tool could affect conclusions drawn based on average susceptibilities within regions in large SM studies. This makes it difficult to directly compare susceptibilities between studies using different automatic segmentation tools.
Future work includes using the Eve Atlas MPRAGE image (downloadable as part of the Eve Atlas), which may result in more accurate coregistration, and scoring of regions by neuroradiologists to select the most anatomically appropriate ROIs for susceptibility value reporting in this study.
Acknowledgements
No acknowledgement found.References
[1] Liu et al. "Nonlinear formulation of the magnetic field to source relationship for robust quantitative susceptibility mapping." Magn Reson Med 69(2) (2013)
[2] Jenkinson, "Fast, automated, N-dimensional phase-unwrapping algorithm", Magn Reson Med 49(1) (2003)
[3] Liu et al. "A novel background field removal method for MRI using projection onto dipole fields (PDF)", NMR Biomed 24(9) (2011)
[4] Kressler et al. "Quantitative susceptibility map reconstruction from MR phase data using bayesian regularization: validation and application to brain imaging" IEEE transactions on medical imaging 29(2) (2010)
[5] Schweser et al. "Toward online reconstruction of quantitative susceptibility maps: superfast dipole inversion." Magn Reson Med 69(6) (2013)
[6] Patenaude et. al. "A Bayesian model of shape and appearance for subcortical brain segmentation." NeuroImage, 56(3) (2011)
[7] Cardoso et.al. "Geodesic Information Flows: Spatially-variant graphs and their application to segmentation and fusion" IEEE Transactions on Medical Imaging, 34(9) (2015)
[8] Prados et.al "NiftyWeb: web based platform for image processing on the cloud" Proc. Intl. Soc. Mag. Reson. Med. 24 (2016)
[9] http://cmictig.cs.ucl.ac.uk/niftyweb/
[10] Lim et al. "Human brain atlas for automated region of interest selection in quantitative susceptibility mapping: application to determine iron content in deep gray matter structures." Neuroimage 82 (2013)
[11] Mori, Susumu, et al. "Stereotaxic white matter atlas based on diffusion tensor imaging in an ICBM template." Neuroimage 40(2) (2008)
[12] Mori et al. "White matter atlases based on diffusion tensor imaging." Current opinion in neurology 22(4) (2009)
[13] Oishi et al. "Atlas-based whole brain white matter analysis using large deformation diffeomorphic metric mapping: application to normal elderly and Alzheimer's disease participants." Neuroimage 46(2) (2009)
[14] Modat et al. "Global image registration using a symmetric block-matching approach." Journal of Medical Imaging, 1(2), (2014)
[15] Modat et al. "Fast free-form deformation using graphics processing units." Computer Methods And Programs In Biomedicine, 98(3) (2010)
Figures
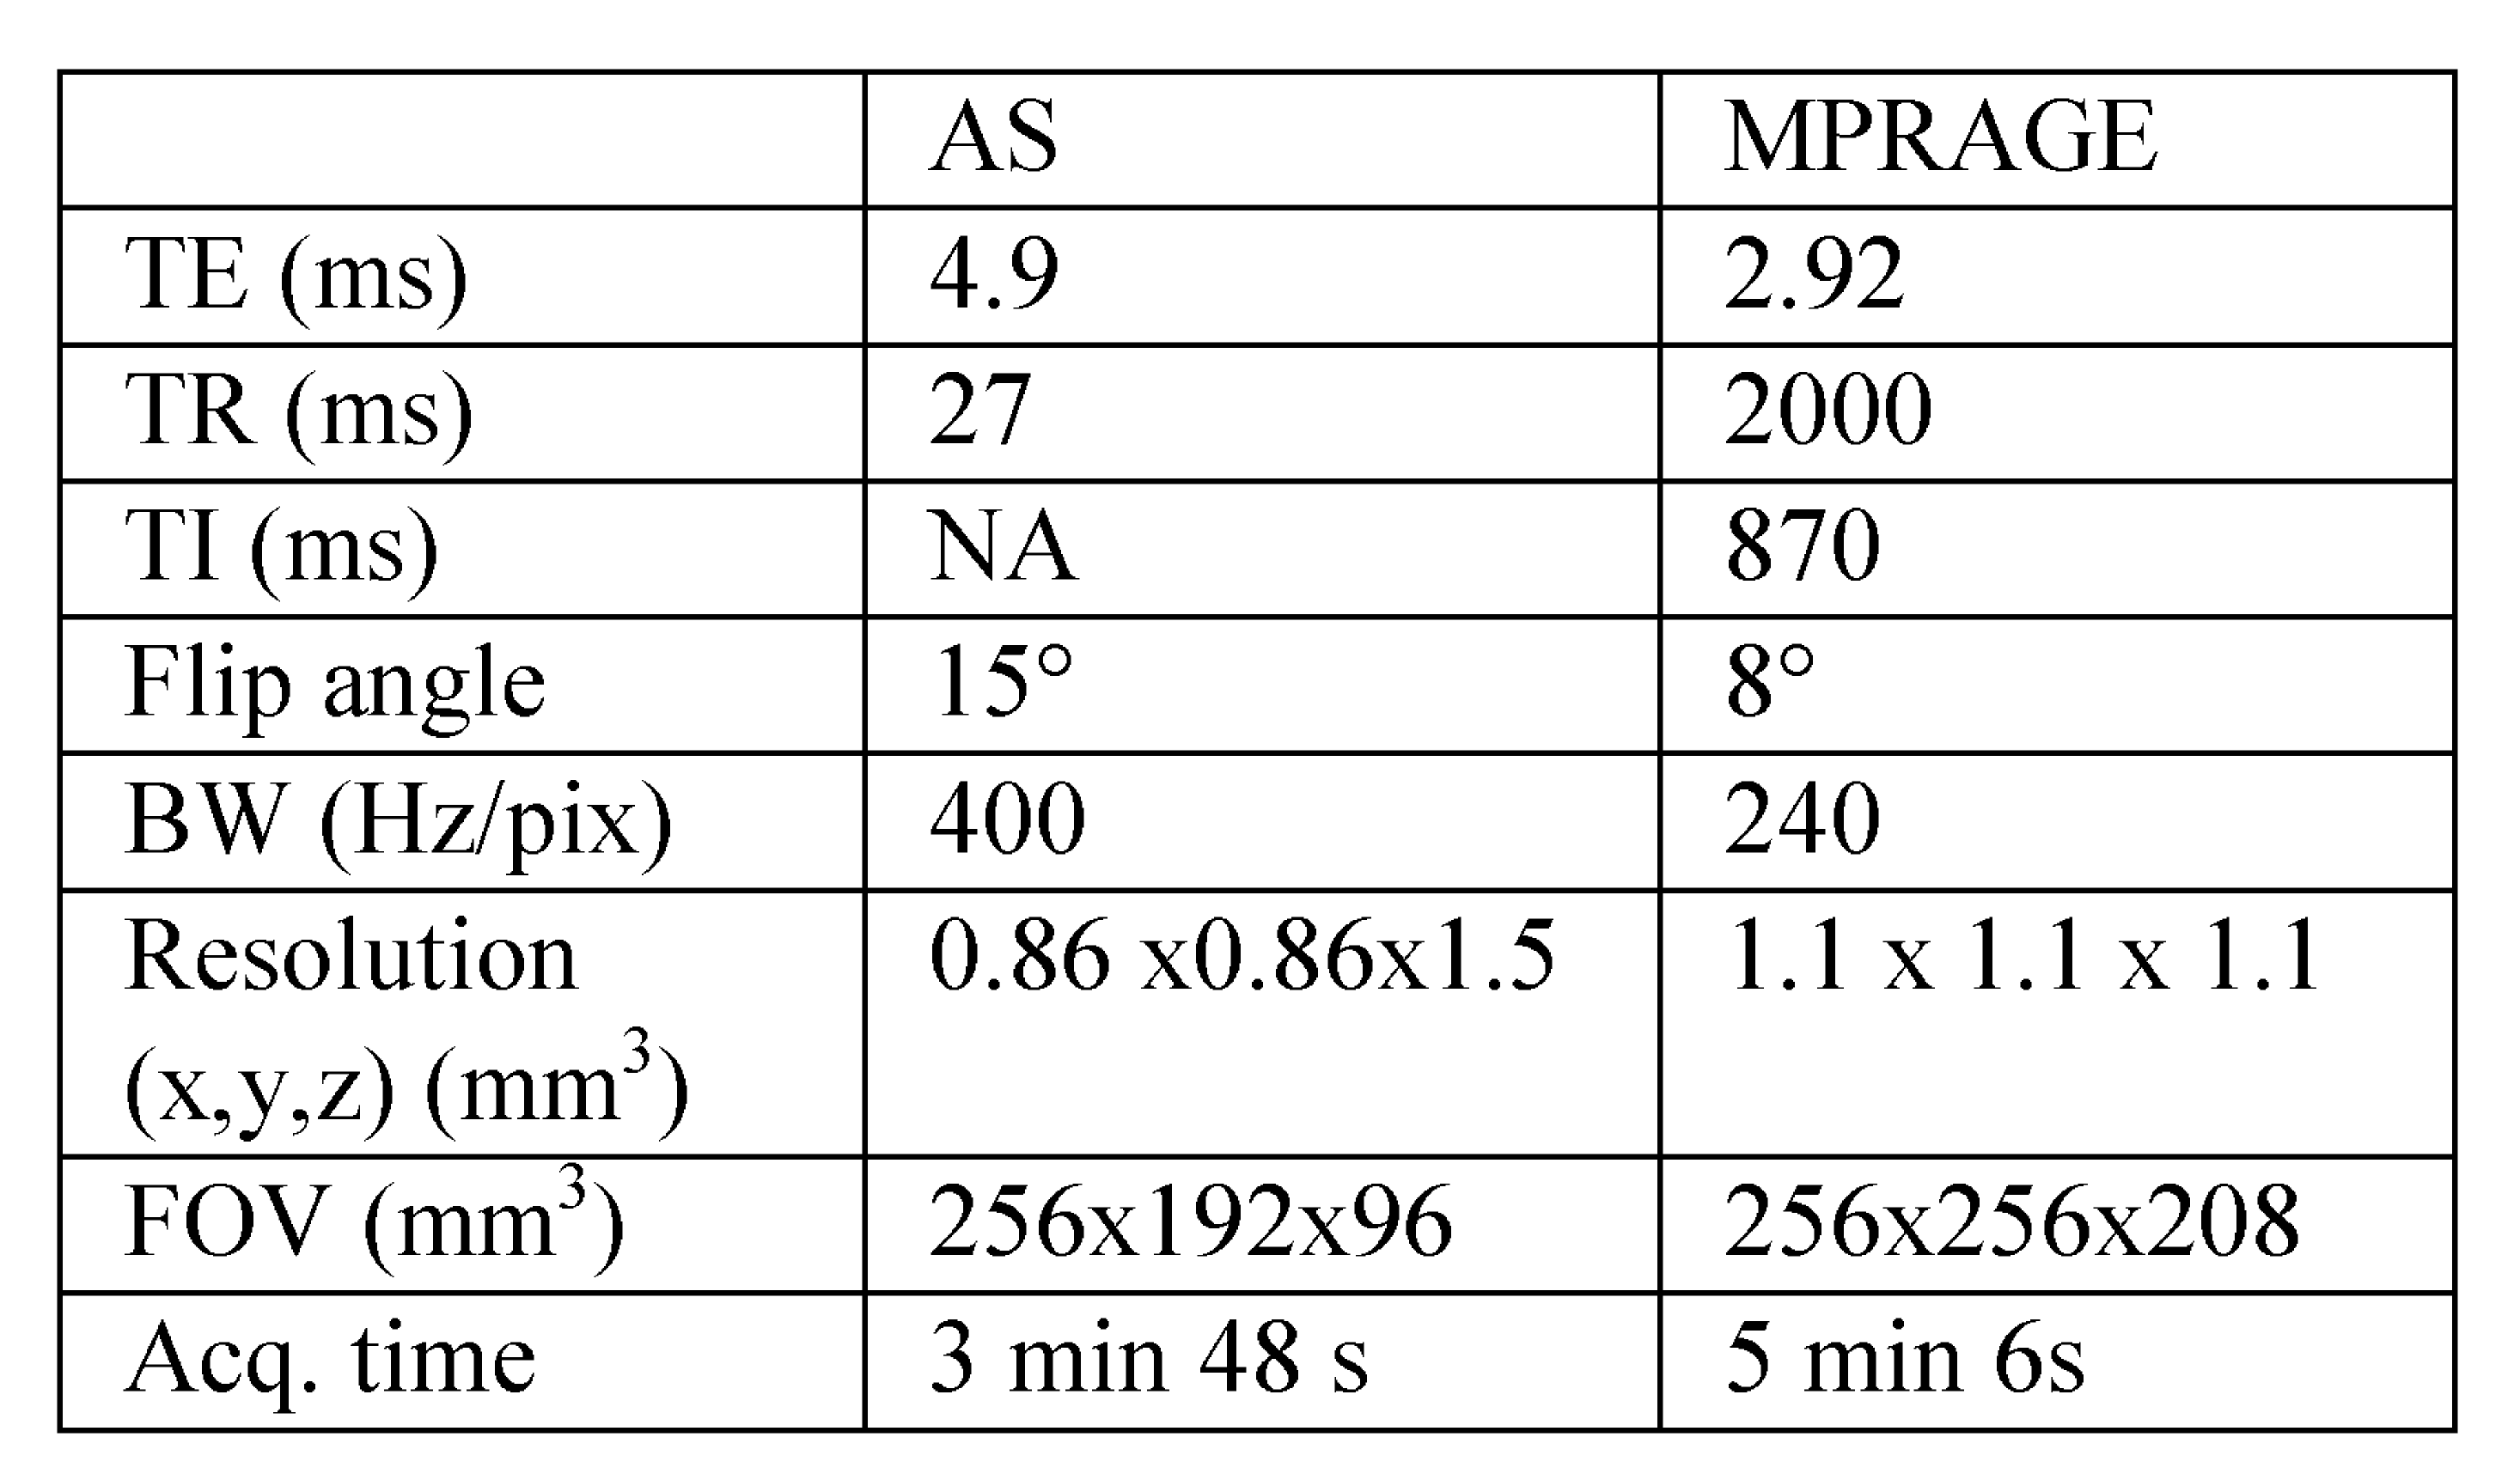
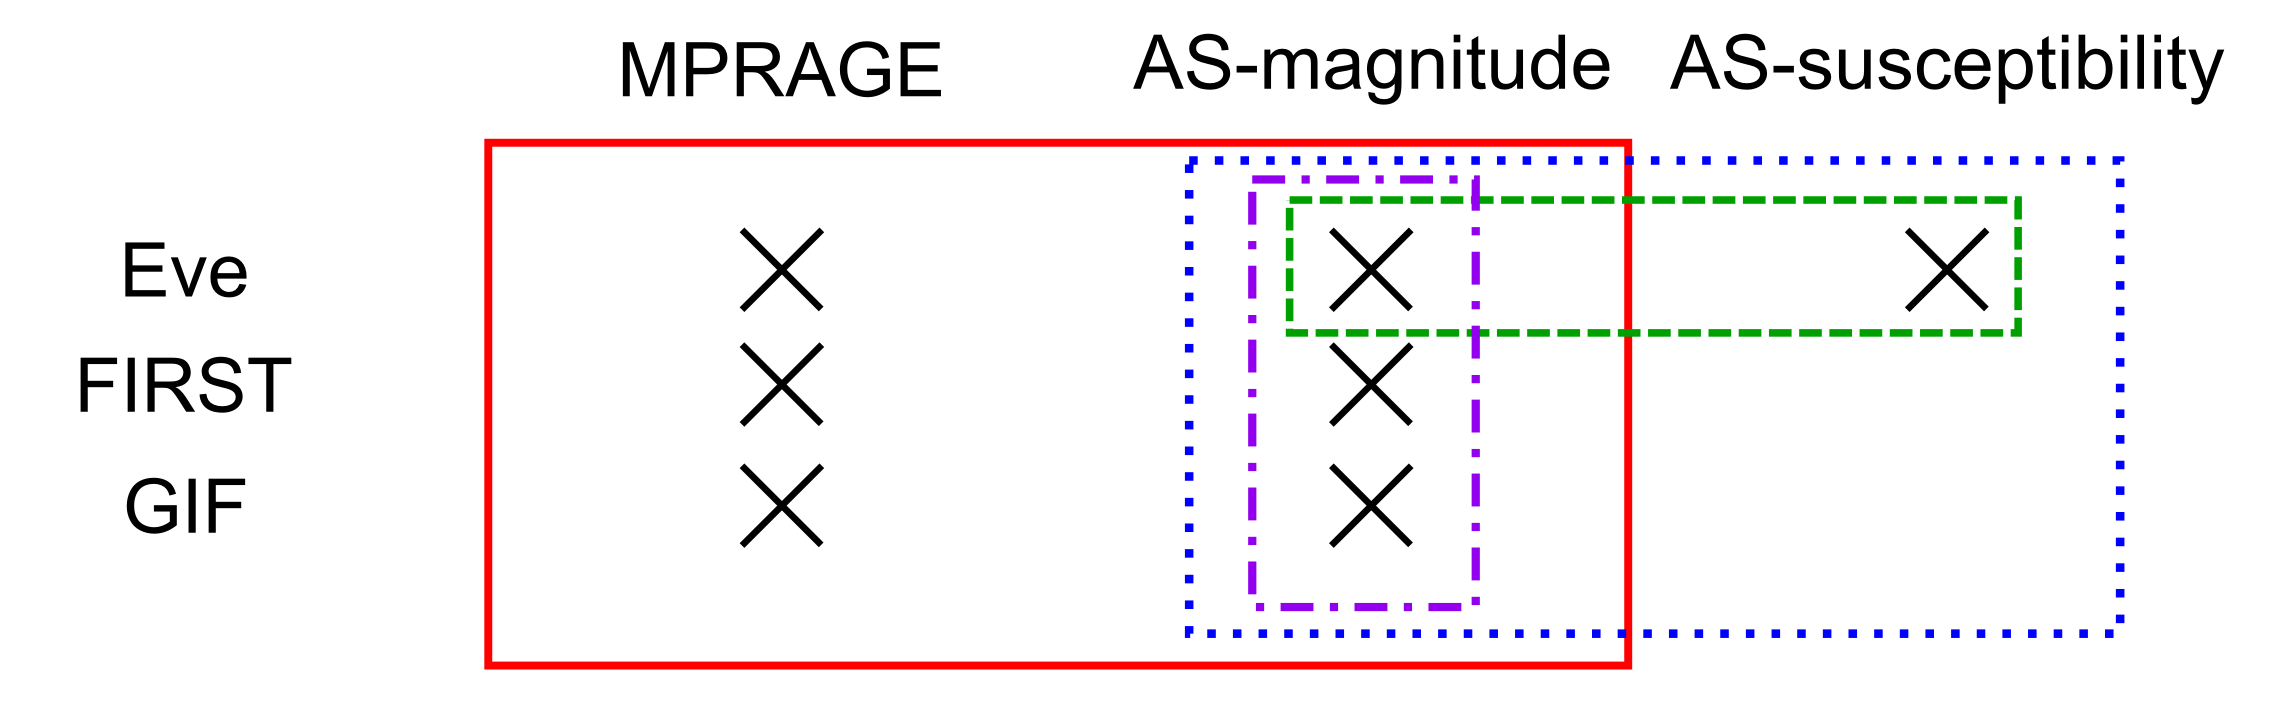
Figure 3:
Column a) Mean DSCs (top) and absolute differences in mean susceptibility (bottom) between AS-magnitude and MPRAGE generated ROIs for all regions across all subjects using Eve, FIRST and GIF.
Column b) Mean DSCs (top) and absolute differences in mean susceptibility (bottom) between AS-magnitude and AS-SM generated ROIs for all regions across all subjects using Eve.
(ALIC: Anterior limb of internal capsule, PLIC: Posterior limb of internal capsule)