3657
Quantitative susceptibility mapping: phase images and microstructure1E010 Radiology, German Cancer Research Center, Heidelberg, Germany, 2Neuroradiology, University Hospital Heidelberg, Heidelberg, Germany, 3Schaller Research Group, University of Heidelberg and German Cancer Research Center, Heidelberg, Germany
Synopsis
In this work, the effect of inhomogeneous microstructure on quantitative susceptibility mapping (QSM) is simulated for typical microstructural geometries. The results suggest that the susceptibility of blood-filled capillaries can not be measured using quantitative susceptibility mapping due to the symmetry of the local Larmor frequency around a capillary. However, numerical simulations show that the concentration of spherically-shaped magnetic particles (contrast agents) is determinable with QSM. These results are therefore essential for a detailed analysis of quantitative susceptibility images.
Target audience
The present work targets investigators and clinicians with an interest in measuring microstructure with quantitative susceptibility mapping.Purpose
Quantitative susceptibility mapping (QSM) uses phase images and a sophisticated reconstruction algorithm to obtain quantitative susceptibility values in the examined tissue (see e.g. [1]). For a non-constant susceptibility distribution inside a voxel, the measured susceptibility is not a weighted average of the susceptibility distribution but depends on the geometrical structure of the tissue. In this work we compare real and reconstructed susceptibilities of intravoxel susceptibility distributions of networks of capillaries and of randomly distributed spherical magnetic perturbers (labelled cells).Methods
The local Larmor frequency $$$\omega(\mathbf{r})$$$ depends on a convolution of the susceptibility distribution $$$\chi(\mathbf{r})$$$ and the dipole kernel $$$\mathcal{D}(\mathbf{r}) = \frac{3\cos^2(\theta)-1}{r^3}$$$ as $$$\omega(\mathbf{r}) = \gamma B_0\left[\chi \ast \mathcal{D} \right] (\mathbf{r})$$$ [2], such that the signal $$$M(t)$$$ within a voxel with volume $$$V$$$ is given as: $$M(t) = \int_V d^3\mathbf{r} \exp\left(-\mathrm{i}\gamma B_0 t \left[\chi \ast \mathcal{D} \right] (\mathbf{r})\right)\,.$$ Thus, susceptibility effects on the MR signal are non-local.
We used different typical susceptibility distribution $$$\chi(\mathbf{r})$$$ for blood-filled capillaries and magnetically labelled particles and calculated and simulated the signal $$$M(t)$$$. The phase was obtained by a linear fit of $$$\mathrm{arg}(M(t))$$$ for short times. Phase results were used as a basis of the reconstruction algorithm and the obtained reconstructed susceptibilities were compared with the initial susceptibility distributions.
Due to the BOLD-effect, the susceptibility inside blood-filled capillaries differs from the susceptibility of the outer tissue. Yablonskiy and Haacke found an analytic expression that describes the signal decay for such infinitely long, parallel capillaries [3]. They reported that the phase information is only determined by the susceptibility of the outer tissue.
To simulate a real distribution of capillaries in brain tissue we used single plane illumination microscopy (SPIM) data sets with a resolution of $$$3.2\mu m \times 3.2 \mu m \times 5\mu m$$$ of a healthy mouse brain with a field of view of $$$1308\times1076\times776$$$ voxels (see Fig.1a). Details about the SPIM methods are provided in [4]. We divided the field of view in isotropic cubes with side length of $$$320 \mu m$$$, calculated the volume fraction $$$\eta$$$ of capillary volume to total volume and determined the reconstructed susceptibility.
We further simulated magnetically labelled cells as randomly distributed spheres with constant radius and determined the volume fraction and the reconstructed susceptibility.
Results
Capillary radii as determined from the SPIM data were distributed as shown in Fig.1b, with mean capillary radius $$$8.70 \mu m\pm 0.02 \mu m$$$. Figure 1c demonstrates the influence of different volume fractions $$$\eta$$$ on the reconstructed susceptibility $$$\chi_R$$$: over a range of $$$\eta=0-0.3$$$, reconstructed susceptibilities did not significantly differ from the susceptibility $$$\chi_o$$$ of the tissue that surrounds the capillaries with intrinsic susceptibiliy $$$\chi_i$$$. QSM is therefore 'blind' for intravoxel capillary networks.
Another example of an intravoxel distribution of magnetic perturbers is the random arrangement of spherical magnetic particles, e.g. in magnetic particle imaging or iron-oxide accumulations in neurodegenerative disease. For this geometry, Yablonskiy and Haacke as well as Ziener et al. derived a linear relation between the volume fraction $$$\eta$$$ and the reconstructed susceptibility $$$\chi_R$$$ [3,5]. We could verify this linear dependency in our simulations as shown in Fig. 2: the proportionality was determined as $$$\chi_R =(1.171\pm 0.006)\eta[\chi_i-\chi_o] + \chi_o$$$, which is close to the findings of Ziener et. al (cf. Eq. (8) in [5]).
Discussion
We analyzed the dependency of QSM on intravoxel microscopic susceptibility distributions to reveal that the reconstructed susceptibility is not necessarily a weighted mean of the susceptibility distribution but depends on the shape of the magnetic perturbers.
Distributions of blood-filled capillaries did not have an effect on the reconstructed susceptibility, possibiliy due to the symmetry of the local Larmor frequency around the capillaries (see Fig. 3): positive and negative parts of the two-dimensional dipole field possess the same strength. Therefore, the frequency distribution is symmetric such that the phase is only determined by the outer susceptibility.
In contrast, for accumulations of spherical magnetic objects such as ferromagnetic contrast agents, the reconstructed suscepitbility was found to be linearly dependent on the volume fraction. In general, diffusion effects of water molecules around the magnetic perturber influences the signal evolution. For increasing diffusion effects, the experiences local Larmor frequency becomes more symmetric corresponding to a reduced sensitivity to the microstructure. Our results may prove helpful for a thorough and detailed interpretation of QSM results.
Acknowledgements
This work was supported by grants from the Deutsche Forschungsgemeinschaft (Contract Grant number: DFG ZI 1295/2-1 and DFG KU 3555/1-1). F. T. Kurz was supported by a postdoctoral fellowship from the medical faculty of Heidelberg University and the Hoffmann-Klaus foundation of Heidelberg University.References
[1] A. Deistung, F. Schweser, B. Wiestler, M. Abello, M. Roethke, F. Sahm, W. Wick, A. M. Nagel, S. Heiland, H. P. Schlemmer, M. Bendszus, J. R. Reichenbach, A. Radbruch. Quantitative susceptibility mapping differentiates between blood depositions and calcifications in patients with glioblastoma. PloS one, 8:e57924, 2013.
[2] J. P. Marques and R. Bowtell. Application of a Fourier-based method for rapid calculation of field inhomogeneity due to spatial variation of magnetic susceptibility. Concepts Magn Reson Part B Magn Reson Eng, 25:65–78, 2005.
[3] D. A. Yablonskiy and E. M. Haacke. Theory of NMR signal behavior in magnetically inhomogeneous tissues: the static dephasing regime. Magn Reson Med, 32:749–763, 1994.
[4] M. O. Breckwoldt et al. Correlated magnetic resonance imaging and ultramicroscopy (MR-UM) is a tool kit to assess the dynamics of glioma angiogenesis. eLife 5:e11712, 2016.
[5] C. H. Ziener, W. R. Bauer, P. M. Jakob. Transverse relaxation of cells labeled with magnetic nanoparticles. Magn Reson Med, 54:702–706, 2005.
Figures
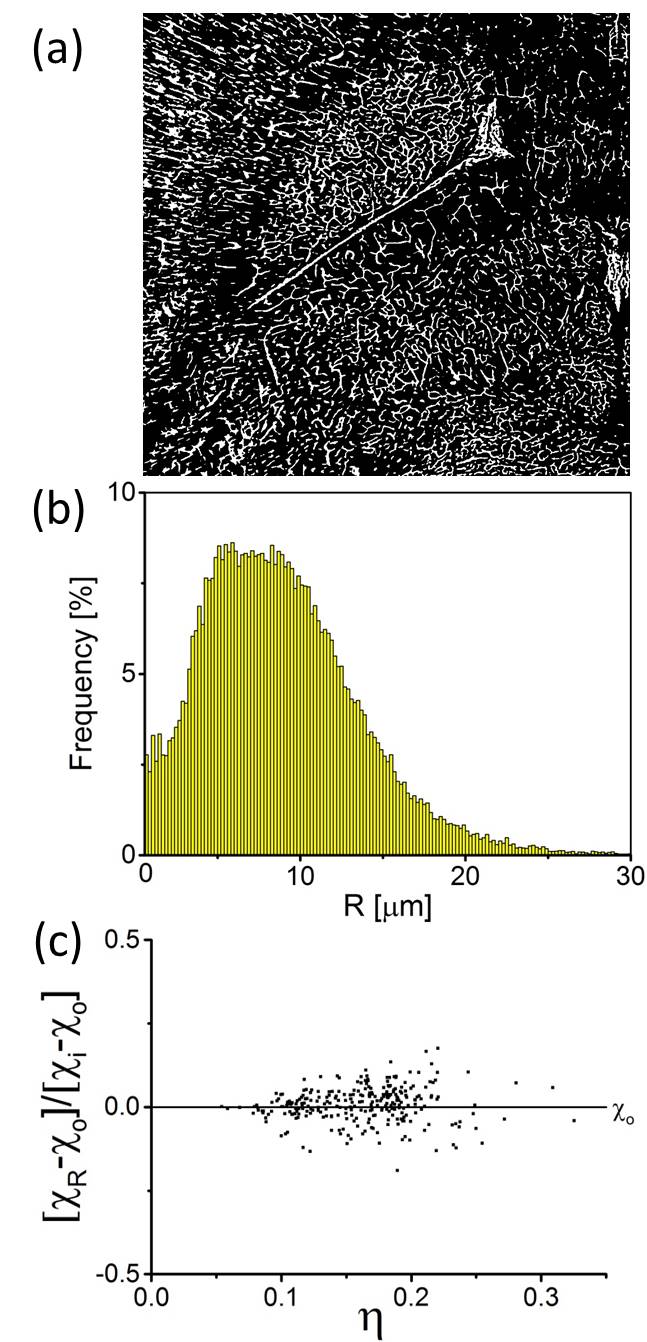
Fig.1: (a) Capillaries in healthy mouse brain. (b) Radius distribution with mean radius $$$ 8.70\mu m \pm0.02\mu m$$$ (c) Reconstructed susceptibility $$$\chi_R$$$ in dependence on volume fraction $$$\eta$$$; $$$\chi_i$$$: susceptibility inside the capillaries, $$$\chi_o$$$: susceptibility outside the capillaries.

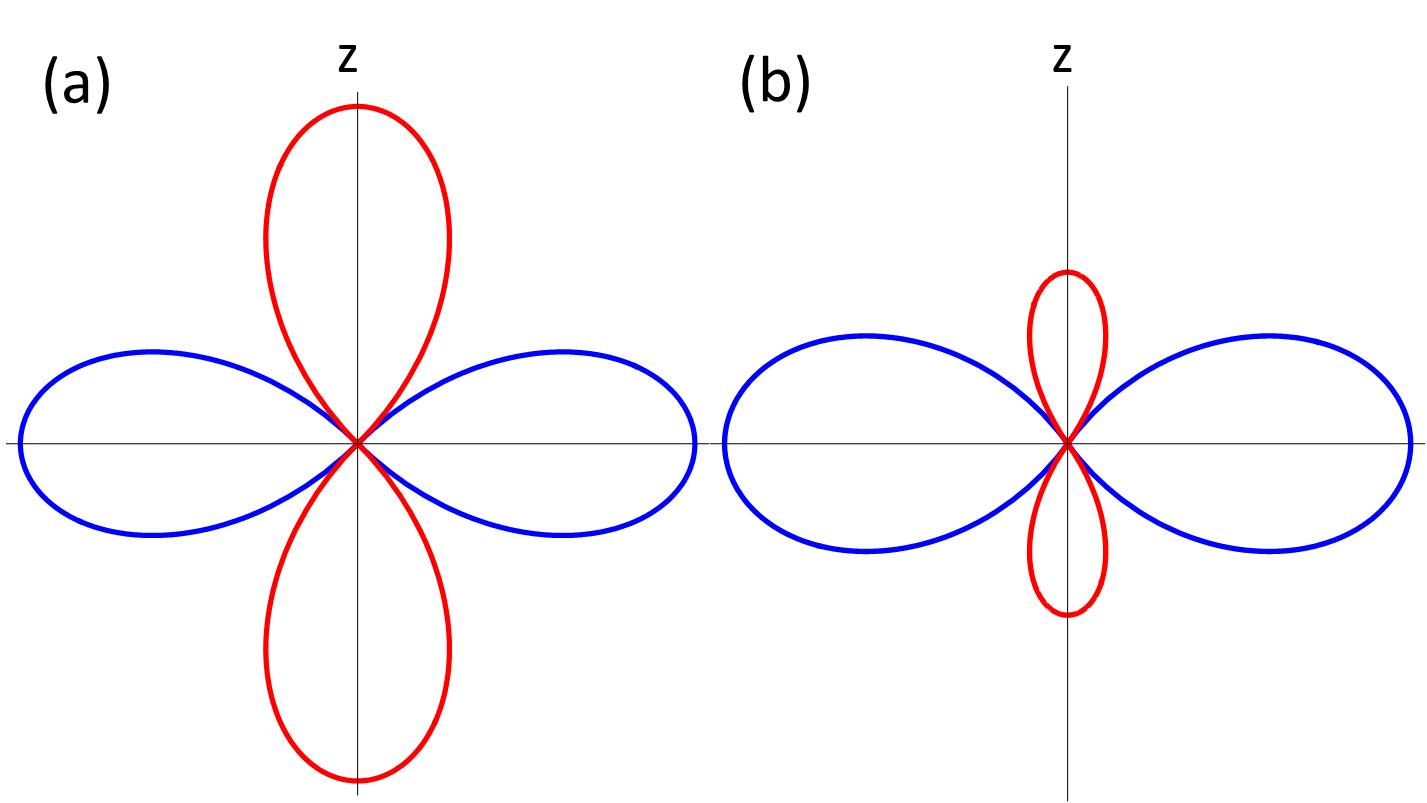
Fig.3: (a) The two-dimensional dipole field around a capillary is proportional to $$$2\cos^2(\theta)-1$$$ and, thus, negative (red) and positive (blue) part of the dipole field have the same strength. (b) The positive part of the three-dimensional dipole field is larger than the negative part since it is proportional to $$$3\cos^2(\theta)-1$$$.