3656
Comparison of quantitative susceptibility mapping methods for evaluating cerebral microbleeds at 3T and 7T1UC Berkeley-UCSF Graduate Program in Bioengineering, University of California, Bekeley and University of California, San Francisco, San Francisco, CA, United States, 2Department of Radiology, University of California, San Francisco, 3Global Applied Science Laboratory, GE Healthcare
Synopsis
There is a growing interest in using QSM to detect and quantitatively evaluate cerebral microbleeds (CMBs). We compared several algorithms proposed in recent years for QSM on patients with CMBs after radiation therapy at 3T and 7T by quantitatively analyzing the noise and contrast of the susceptibility maps. Although RESHARP+ iLSQR had the least noise among methods, CMB and vessel contrast were more affected by incomplete background field removal, especially at 7T.
Purpose
Cerebral microbleeds (CMBs) are a form of vascular injury that have been observed years after receiving radiation therapy in patients with brain tumors. Traditionally, CMBs are identified using Susceptibility-Weighted Imaging (SWI)1, a qualitative method for CMB detection. Quantitative susceptibility mapping (QSM)2 is an emerging technique that enables quantitative investigation of local tissue susceptibility using the same T2*-weighted acquisition to achieve accurate quantification of CMB susceptibility that could help determine their prognostic value on cognitive outcomes. Despite its promise as quantitative biomarker, QSM is faced with many challenges, including its dependence on preprocessing of the raw phase data and the ill-posed nature of the inverse problem. The goal of this study was to test the robustness of the 3 readily available background field removal algorithms (RESHARP3, PDF4, HARPERELLA5) and 2 dipoles source inverse methods (iLSQR6, QSIP7) proposed in recent years for generating QSM maps from single-echo T2* images at two field strengths in patients with radiation-induced CMBs.Methods
Acquisition: Eleven patients with radiation-induced CMBs were scanned on 3T and 7T scanners on the same day using an 8-channel receive coil with a GRAPPA-based single echo 3D-flow compensated SPGR sequence. For the 3T scans, an R=2 acceleration factor and TE/TR=28/46ms were used, while the 7T scans had an R=3 and TE/TR=16/50ms. All scans has a flip angle 20°, 16 autocalibrating lines, 24cm FOV, and 0.5x0.5x2mm resolution.
Reconstruction: Image reconstruction was performed using in-house Matlab-based programs developed by our group. The raw phase from multiple coils were first unwrapped using a Laplacian-based method coil-by-coil and then combined using a magnitude image weighted-average. Three background field removal algorithms were applied on the unwrapped phase: PDF, RESHARP and HARPERELLA. The resultant local phase was then used as input of iLSQR to solve for susceptibility. The QSIP algorithm was applied directly to the unwrapped phase data.
Analysis: To quantify noise characteristics, rectangular regions-of-interest (ROIs) with relatively homogeneous susceptibility values in normal-appearing white matter were selected after coregistration with FSL’s FLIRT using 12 degrees-of-freedom8. In order to compare contrast among methods, line profiles through transverse sections of veins and the center of CMBs were obtained from maximum intensity-projected maps (through 8mm) and the height/FWHH (full-width-at-half-height) was calculated. Six line profiles through veins and one profile for CMBs were selected from each patient. Kruskal-Wallis and Wilcoxon signed-rank tests were employed to test for statistically significant differences among methods.
Results
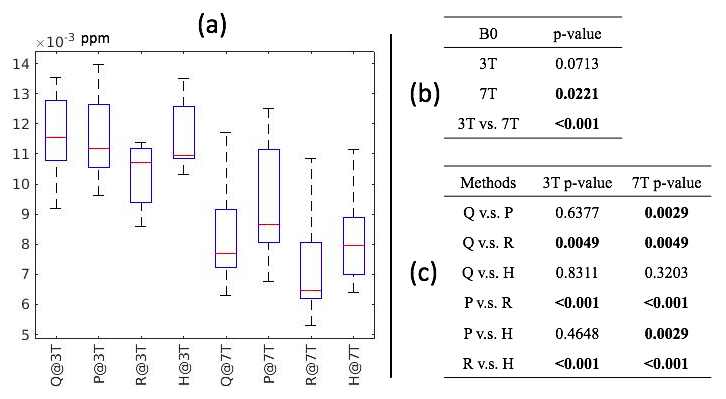
Noise Variance: Figure 1a shows the mean standard deviation (MSD) of noise for each method. A significant difference in MSD was observed among methods at 7T, while only a trend was seen at 3T (Figure 1b). At both field strengths, RESHARP+ iLSQR had significantly lower noise compared to all other methods (p<0.005; Figure 1c). Although the other methods had comparable noise levels at 3T, significant differences in MSD were observed among most methods at 7T, with varying levels of statistical significance.
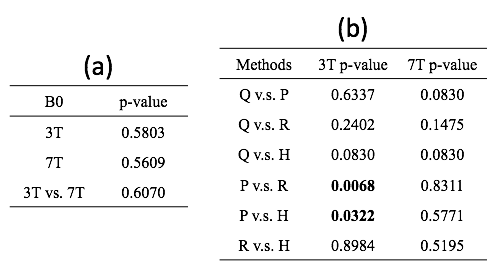
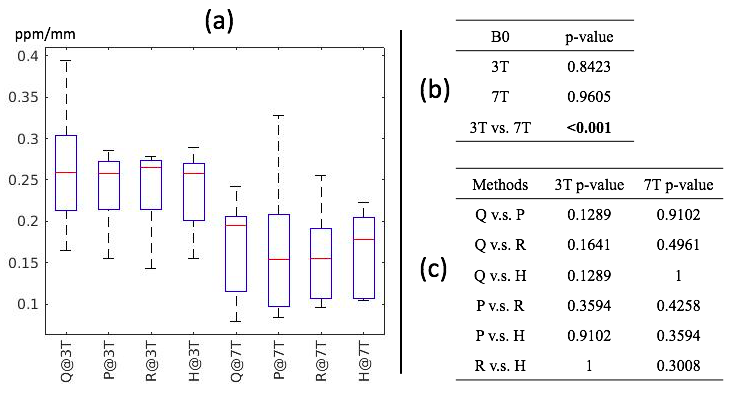
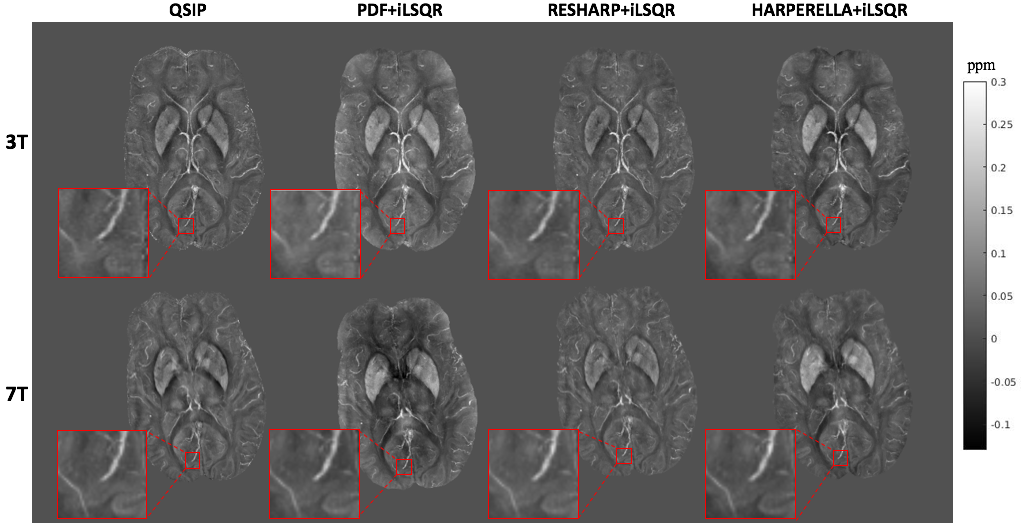
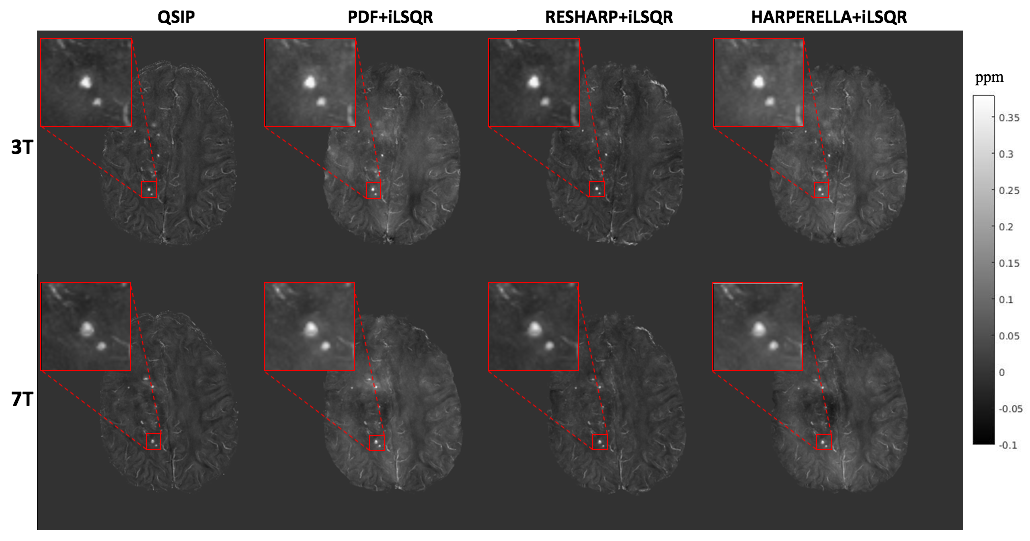
Contrast: Although the variation in vessel contrast among QSM methods was not significantly different (Fig 2a,b) when considering all of the methods together, vessel contrast was significantly elevated with RESHARP compared to PDF background field removal at 3T only. Although no significant variations in CMB contrast were observed (Figure 3) at either field strength, CMB contrast on QSM images at 7T were significantly lower than at 3T for all methods, despite the increased contrast observed with field strength on SWI images. Visual comparison of the QSM maps and detailed view of veins and CMBs are displayed in Figure 4 and Figure 5, respectively.
Discussion
Although the parallel imaging acceleration factor was higher at 7T, the QSM at 7T still had lower noise variance than at 3T, suggesting that higher field strengths may improve the signal-to-noise ratio of QSM. At 3T, RESHARP+ iLSQR maps had less noise compared to all methods, and improved vessel contrast compared to PDF+ iLSQR, however at 7T, the performance of all methods to remove the background field is degraded, resulting in no differences in contrast among methods. Although QSIP resulted in overall more uniform maps that were robust to residual background field, only a trend towards increased contrast was observed with this method at both field strengths. Of note is that only about 50% of CMBs that were identified on SWI images were visible on QSMs, regardless of method.Conclusion
This work suggests that selection of QSM method can influence the quality of maps obtained that could potentially affect the ability of automated algorithms to correctly detect and quantify CMBs. Future work will compare with additional QSM methods using multi-echo data.Acknowledgements
This study was supported by GE Healthcare and National Institutes of Health (NIH) through Grant R01 HD079568.References
1. Lupo J, et al. 7-Tesla susceptibility-weighted imaging to assess the effects of radiotherapy on normal-appearing brain in patients with glioma. Int J Radiat Oncol Biol Phys. 2012;82(3): 493-500.
2. Schweser F, et al. Foundations of MRI phase imaging and processing for Quantitative Susceptibility Mapping (QSM). Z Med Phys. 2016;26(1): 6-34.
3. Sun H, et al. Background field removal using spherical mean value filtering and Tikhonov regularization. Magn Reson Med. 2014;71(3): 1151-1157.
4. Liu T, et al. A novel background field removal method for MRI using projection onto dipole fields (PDF). NMR Biomed. 2011;24(9): 1129-1136.
5. Li W, et al. Integrated Laplacian-based phase unwrapping and background phase removal for quantitative susceptibility mapping. NMR Biomed. 2014;27(2): 219-227.
6. Li W, et al. A method for estimating and removing streaking artifacts in quantitative susceptibility mapping. Neuroimage. 2015;108: 111-122.
7. Poynton C, et al. Quantitative susceptibility mapping by inversion of a perturbation field model: correlation with brain iron in normal aging. IEEE T Med Imaging. 2015;34(1): 339-353.
8. Jenkinson M, et al. Improved optimization for the robust and accurate linear registration and motion correction of brain images. Neuroimage. 2002;17(2): 825-841.
Figures