3654
Image Quality Improvement by Applying Retrospective Motion Correction on Quantitative Susceptibility Mapping and R2*1Medical Physics Group, Institute of Diagnostic and Interventional Radiology, Jena University Hospital - Friedrich Schiller University Jena, Jena, Germany, 2Empirical Inference, Max Planck Institute for Intelligent Systems, Tübingen, Germany, 3High-Field MR, Max Planck Institute for Biological Cybernetics, Tübingen, Germany, 4Section of Experimental Neurology, Department of Neurology, Essen University Hospital, Essen, Germany, 5Center of Medical Optics and Photonics, Friedrich Schiller University Jena, Jena, Germany, 6Michael Stifel Center for Data-driven and Simulation Science Jena, Friedrich Schiller University Jena, Jena, Germany
Synopsis
The aim of this study was to quantitatively assess the improvement of image quality on motion corrupted quantitative susceptibility mapping (QSM) and the effective transverse relaxation rate (R2*) maps, after applying retrospective motion correction. Image quality was assessed using the following metrics: SNR in different brain tissues, histogram analysis, and linear correlation between susceptibility and R2* values in subcortical structures.
Purpose
Quantitative susceptibility mapping (QSM)1-4 is a new MRI post-processing technique to quantify the bulk magnetic susceptibility of tissues using the phase images from T2*-weighted gradient echo (GRE) data. As a multi-echo GRE pulse sequence is commonly used for QSM data acquisition, the effective transverse relaxation rate, R2*, which is sensitive to iron content in brain tissue as well5, can be calculated as a valuable by-product from the magnitude images of the multi-echo GRE data. However, the multi-echo GRE scanning time for whole brain coverage with high spatial resolution is rather long (more than 7 minutes), making the acquisition vulnerable to head movement, particularly in patients with involuntary motions. The motion corrupted GRE magnitude and phase images would impair the calculation of QSM and R2* maps. In this study, we applied retrospective motion correction to solve this problem, and quantified the improvement of image quality on QSM and R2* maps.Materials and Methods
Data acquisition
Five healthy subjects and five patients with schizophrenia were scanned on a 3T Siemens whole-body MRI scanner with a commercial 12-channel head coil. Multi-echo GRE data was acquired with sequence parameters: TE1/TE2/TE3/TE4/TR = 9ms/17ms/26ms/34ms/41ms, flip angle 17°, voxel resolution of 0.6×0.6×1.8 mm3 with matrix size of 288×384×80, and total acquisition time of 11:48 min:sec. Head motion occurred during the scans. MP-RAGE with 1 mm isotropic resolution was additionally acquired (with no motion) and was used for automated tissue segmentation.
Motion correction
We addressed the problem of motion artifacts correction with GradMC6, an autofocusing-based, data-driven retrospective motion correction method. We applied GradMC on multi-channel combined GRE raw data to correct rigid head movements. GradMC operates by solving an optimization problem, where the optimized parameters are the unknown motion parameters (6 DOF, 3 translations and 3 rotations).
Data processing
QSM and R2* maps were calculated for both original and motion corrected GRE data. QSM was generated using V-SHARP7 (Sophisticated Harmonic Artifact Reduction for Phase data with varied radius) and HEIDI8 (Homogeneity Enabled Incremental Dipole Inversion). Susceptibility values were not explicitly referenced to a specific anatomical structure to avoid potential errors introduced by reference structures in case of no motion correction. R2* maps were calculated by mono-exponential fitting of the magnitude signal decay.
Image analysis
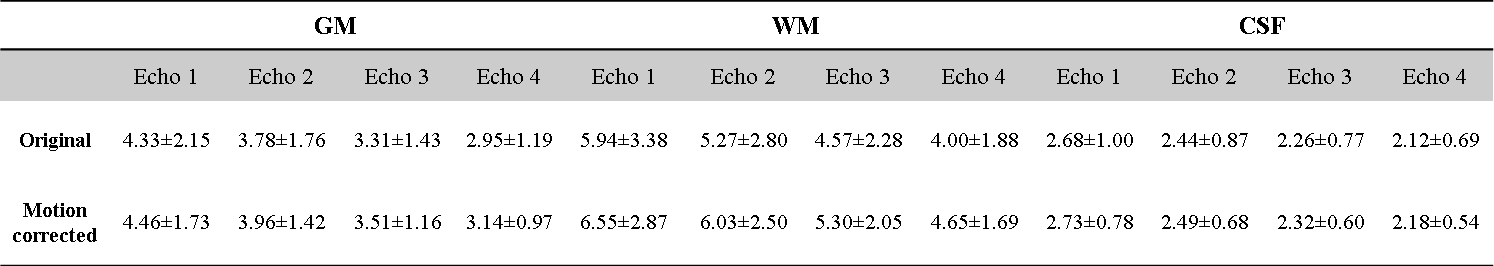
Different brain structures were used in the analysis of image quality. Gray matter, white matter and cerebrospinal fluid (CSF) were segmented on T1w images using FSL-FAST9 (FMRIB's Automated Segmentation Tool). Six subcortical structures, including accumbens, caudate, globus pallidus, hippocampus, putamen and thalamus, were automatically segmented on T1w images using modified version10 of FSL-FIRST11 (FMRIB's Integrated Registration and Segmentation Tool), where nonlinear registration using ANTs12 was used to replace the default linear registration. All segmented ROIs were transformed to the QSM / R2* space for both original and motion corrected data, where the transformation matrix was obtained by rigid registration of the corresponding magnitude images of the first echo and T1w images. To quantify the improvement of image quality before and after motion correction, we evaluated the signal-to-noise ratios (SNR = μ/σ, μ is the mean value and σ is the standard deviation) for each echo in gray matter, white matter and CSF. We investigated the histograms of susceptibility and R2* in white matter and compared their full width at half maximum (FWHM). Finally, we investigated the correlation of susceptibility and R2* values in the subcortical structures.
Results
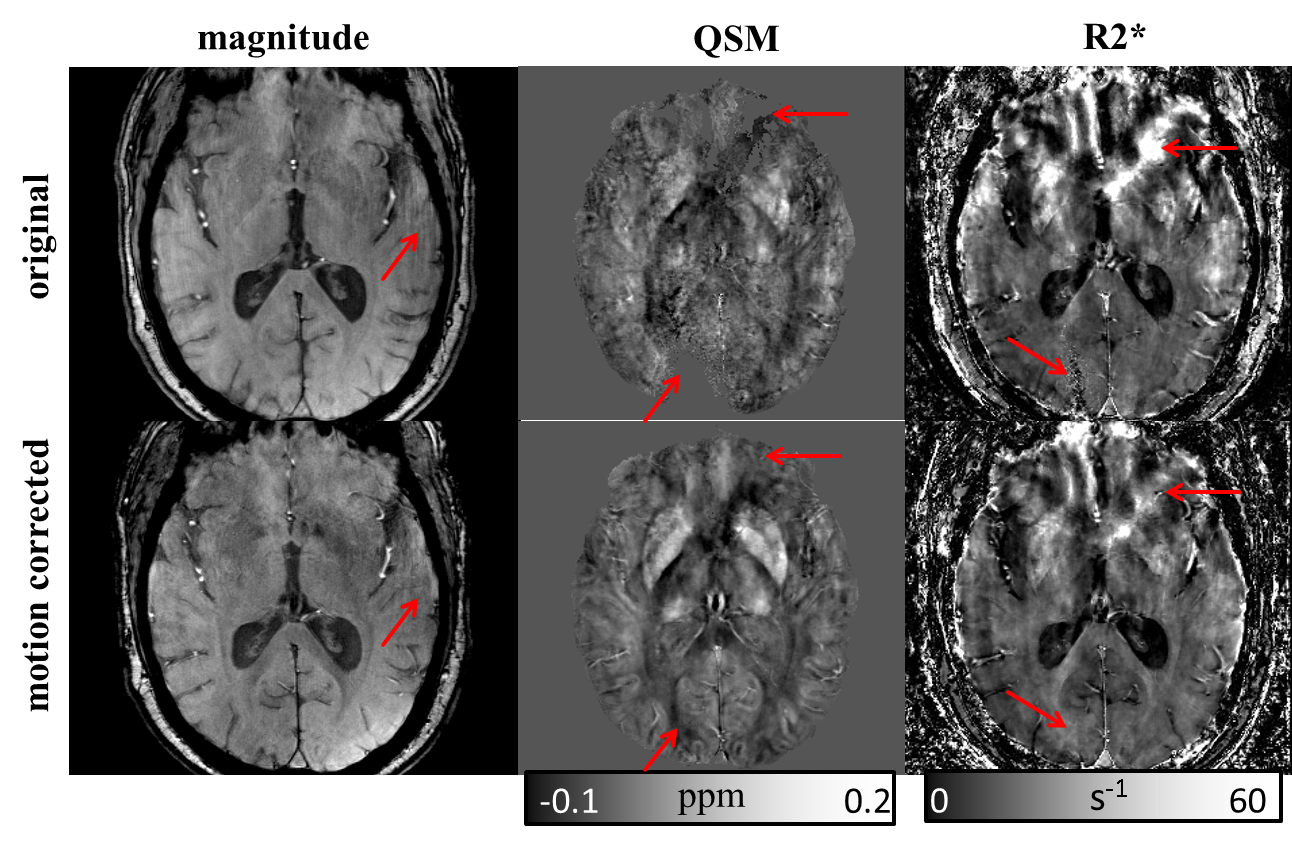
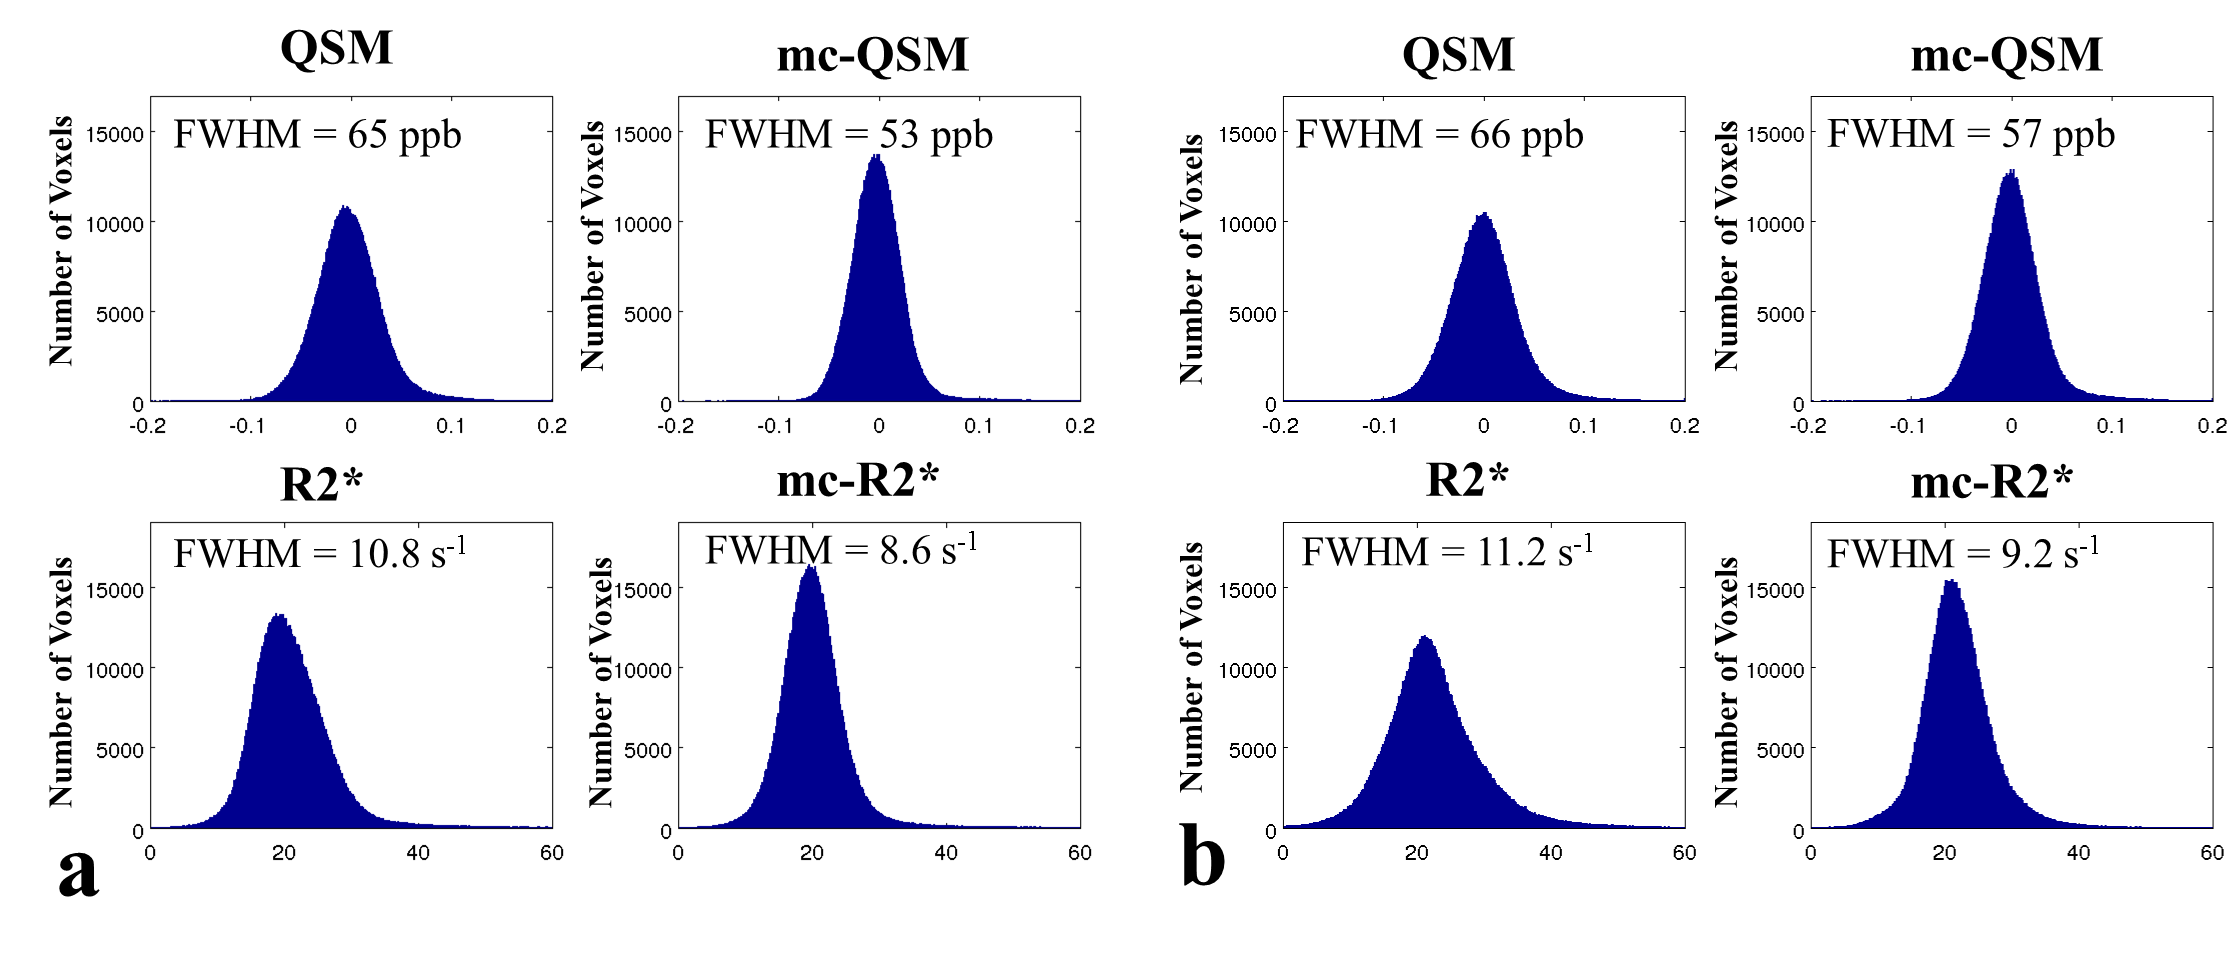
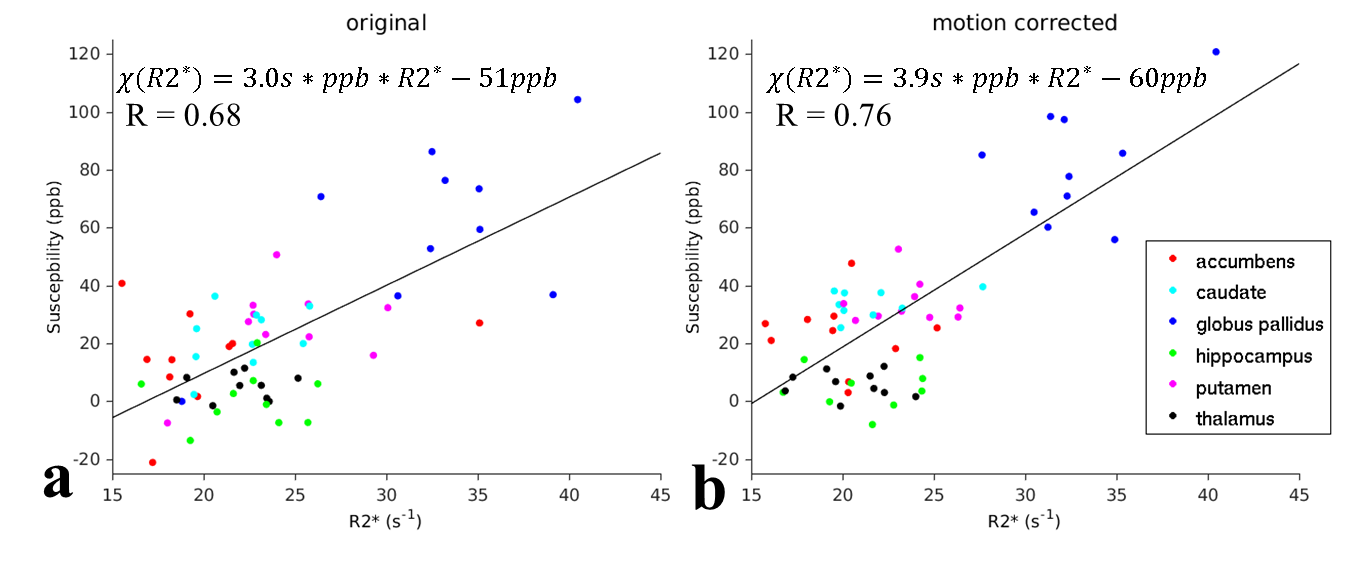
Fig. 1 shows one example of GRE magnitude, QSM and R2* maps before and after motion correction. The motion corrected GRE data provided more voxels with reliable phase information for QSM calculation. Table 1 summarizes the SNR improvement on different brain tissues after motion correction. Fig.2 shows the improved histogram distributions of QSM and R2* maps with smaller FWHM on one healthy subject and one patients. Similar trends were also observed for the other subjects. Finally, an improved correlation between motion corrected susceptibility and R2* is presented in Fig. 3 for subcortical structures. Linear regression reveals a 11.8% higher correlation value and an increase of the slope by 30% after motion correction.
Discussion and Conclusion
After applying retrospective motion correction on these motion corrupted GRE data, we observed consistent improvements in different image metrics: higher SNRs in different brain tissues, more compact histogram distribution with smaller FWHM, and a higher correlation between susceptibility and R2* in subcortical structures. These results demonstrate the benefits of retrospective motion correction on QSM and R2* when acquired data is affected by subject motion.Acknowledgements
X.F. is supported by a stipend from the Graduate Academy at the Friedrich Schiller University Jena (Landesgraduiertenstipendium). A.D. acknowledges support from the German Research Foundation (DFG, DE2516/1-1).References
1. Deistung A, Schweser F, Reichenbach JR. Overview of quantitative susceptibility mapping. NMR in biomedicine. 2016.
2. Haacke EM, Liu S, Buch S, Zheng W, Wu D, Ye Y. Quantitative susceptibility mapping: current status and future directions. Magnetic resonance imaging. 2015;33(1):1-25.
3. Reichenbach J, Schweser F, Serres B, Deistung A. Quantitative susceptibility mapping: concepts and applications. Clinical neuroradiology. 2015;25(2):225-30.
4. Wang Y, Liu T. Quantitative susceptibility mapping (QSM): Decoding MRI data for a tissue magnetic biomarker. Magnetic resonance in medicine : official journal of the Society of Magnetic Resonance in Medicine / Society of Magnetic Resonance in Medicine. 2014.
5. Langkammer C, Krebs N, Goessler W, Scheurer E, Ebner F, Yen K, et al. Quantitative MR imaging of brain iron: a postmortem validation study. Radiology. 2010;257(2):455-62.
6. Loktyushin A, Nickisch H, Pohmann R, Scholkopf B. Blind retrospective motion correction of MR images. Magnetic resonance in medicine : official journal of the Society of Magnetic Resonance in Medicine / Society of Magnetic Resonance in Medicine. 2013;70(6):1608-18.
7. Schweser F, Deistung A, Lehr BW, Reichenbach JR. Quantitative imaging of intrinsic magnetic tissue properties using MRI signal phase: an approach to in vivo brain iron metabolism? NeuroImage. 2011;54(4):2789-807.
8. Schweser F, Sommer K, Deistung A, Reichenbach JR. Quantitative susceptibility mapping for investigating subtle susceptibility variations in the human brain. NeuroImage. 2012;62(3):2083-100.
9. Zhang YY, Brady M, Smith S. Segmentation of brain MR images through a hidden Markov random field model and the expectation-maximization algorithm. IEEE transactions on medical imaging. 2001;20(1):45-57.
10. Feng X, Deistung A, Hagemeier J, Dwyer MG, Zivadinov R, Reichenbach JR, et al., Abnormal brain anatomy can introduce considerable bias to studies relying on FIRST – An improved segmentation pipeline Proceedings of the International Society for Magnetic Resonance in Medicine; 2015; Toronto.
11. Patenaude B, Smith SM, Kennedy DN, Jenkinson M. A Bayesian model of shape and appearance for subcortical brain segmentation. NeuroImage. 2011;56(3):907-22.
12. Avants BB, Tustison NJ, Song G, Cook PA, Klein A, Gee JC. A reproducible evaluation of ANTs similarity metric performance in brain image registration. NeuroImage. 2011;54(3):2033-44.
Figures