3653
Localization of the implanted brachytherapy titanium seeds in presence of calcification on MR images using Quantitative Susceptibility Mapping (QSM) and 3D K-means clustering1Medical Physics, Ryerson University, Toronto, ON, Canada, 2Medical Physics, Sunnybrook Health Science Centre, Toronto, ON, Canada, 3Medical Physics, Sunnybrook Health Sciences Centre, Toronto, ON, Canada, 4Physical Sciences, Sunnybrook Research Institute, Toronto, ON, Canada, 5Meinig school of Biomedical Engineering, Cornell University, Ithaca, NY, United States, 6Radiology, Weill Medical College of Cornell University, New York, NY, United States, 7Radiology, Nagoya City University Hospital, Nagoya, Japan, 8Odette Cancer Centre, Sunnybrook Health Sciences Centre, Toronto, ON, Canada, 9Radiation oncology, University of Toronto, Toronto, ON, Canada, 10Physics, Ryerson University, Toronto, ON, Canada, 11Medical Biophysics, University of Toronto, Toronto, ON
Synopsis
Post‐implant dosimetry is an important quality assurance for prostate low‐dose‐rate (LDR) permanent seed brachytherapy. Despite the superior soft tissue contrast in MRI that is required for tumor delineation, there are some unresolved issues with seed depiction on MR images as they appear as signal void. In addition, calcified regions have similar characteristics on MR images making them indiscernible. This work investigates the feasibility of an MR-only workflow based on quantitative susceptibility mapping (QSM) and 3D k-means clustering for post-implant localization of the seeds.
Purpose
To evaluate different quantitative susceptibility mapping (QSM) techniques along with 3D K-means clustering as a MRI_only workflow for post-implant localization of brachytherapy seeds.Introduction
Low‐dose‐rate (LDR) brachytherapy is a well-established treatment for localized prostate tumor; The prescribed dose is delivered to the tumor through implantation of several radioactive sources encapsulated in a titanium shell (known as seed). The quality of the implant and volumetric dose distribution is evaluated one month1 following the implantation in a process known as post‐implant dosimetry. Currently CT is employed for post-implant dosimetry3,4; despite providing excellent contrast for the seeds and prostatic calcifications (manifestation of 88.8%2), the inferior soft tissue contrast of CT results in significant uncertainty in the outlining the prostate volume and consequently error in prostate dose calculation5. To benefit from superior soft tissue contrast offered by MRI, a combined CT‐MRI workflow is often used for post‐implant dosimetry, which increases operational costs and is subject to registration/fusion errors. Many efforts have been made to generate positive contrast for the seeds. However, proposed methods either require significant hardware/software modifications or have several limitations6-11.
In this study various quantitative susceptibility mapping (QSM) techniques were assessed and the most efficient QSM pipeline was fed into the 3D k-means clustering algorithm to determine the position of the seeds.
Methods
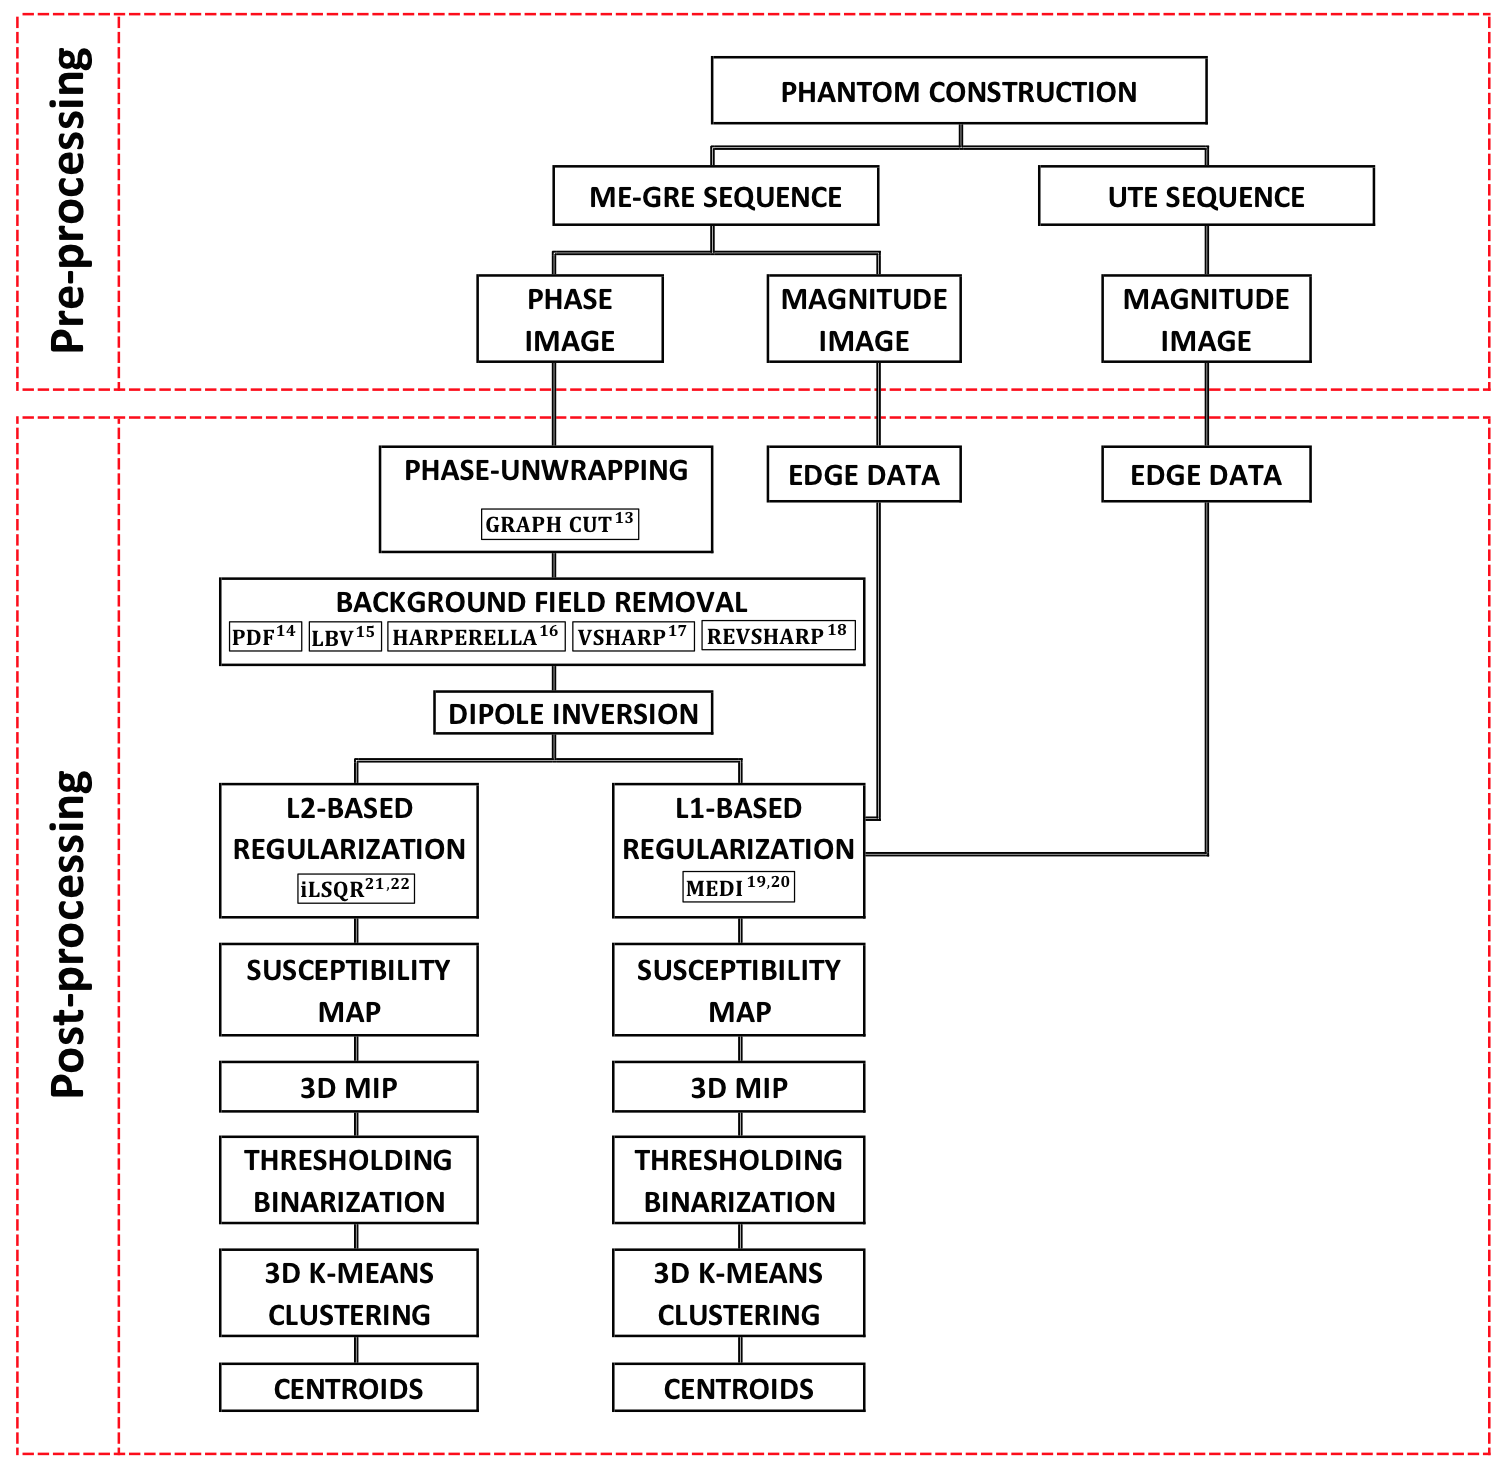
The employed pre/post-processing pipeline is summarized in Figure 1.
Phantom construction: a tissue mimicking phantom was constructed using 3% Agar, 22.2 μM/Kg GdCl3, 0.29% NaCl and 0.03% NaN3. Twenty stranded iodine‐125 (IsoAid Advantage TM) dummy seeds (4.5mmx0.8mm) were placed at different orientations. Three pieces of calcifications obtained from sheep bone with similar composition to human bone12 (8.2mm, 6mm and 2mm) were implanted in the phantom.
MRI
acquisitions:
Imaging was performed on a 3T MR Philips Achieva scanner using an 8‐channel head array coil. The first sequence was 3D multi-echo GRE with following parameters: TR=50ms,
TEs=2:4:30 (8 echoes), ETL=8,
bandwidth=543 Hz/pixel, FA=15o, isotropic
spatial resolution of 0.7 mm3 and
number-of
-averages=1. The second
sequence was ultrashort echo time (UTE) with the same resolution and
TE/TR=0.078/40ms.
Post-processing: the post processing was performed in five main
steps:
1- Phase unwrapping using graph-cut method13
2- Background field removal using different techniques : Projection onto Dipole Field14, Laplacian Boundary Value15, HARmonic PhasE REmovaL using LAplacian operator (HARPERELLA)16, Varying sphere Sophisticated Harmonic Artefact reduction for Phase (VSHARP)17 , Regularization Enabled Varying sphere Sophisticated Harmonic Artefact reduction for Phase data18
3- Dipole inversion using two methods: Morphology Enabled Dipole Inversion (MEDI) with L1-based regularization algorithm19,20 , L2-based regularization algorithm21 using iterative Least Square Root (iLSQR)22
4- 3D Maximum Intensity Projection (MIP) of the susceptibility map and thresholding
5- 3D K-means clustering and finding centroids of each cluster (seed)
Results and Discussion
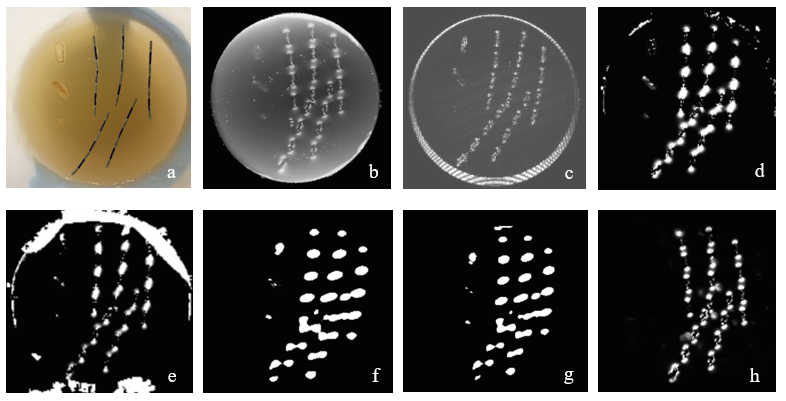
Figure 2 shows the constructed phantom and thresholded 3D MIP of the unwrapped/background (BG) subtracted local field maps using different methods. The REVSHARP technique generated the most consistent background subtracted local field map (for seeds with same orientation). PDF and LBV methods were not quite successful in calculation of the local field on phantom/background boundaries. On thresholded local field maps generated by HARPERELLA and VSHARP methods, spatial resolution is poor and calcifications are not differentiable from seeds.
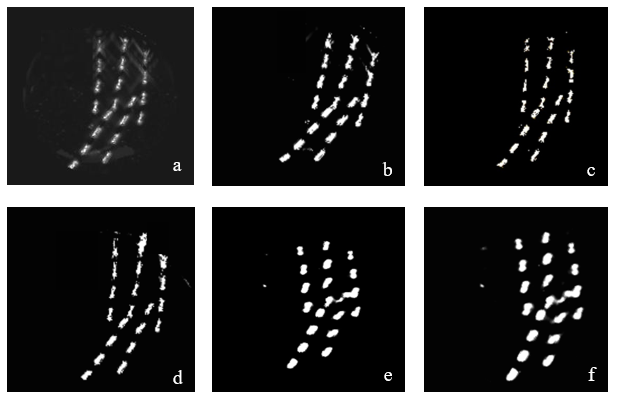
Figure 3 shows the calculated susceptibility maps. Employing edge information from magnitude data (MEDI) significantly improved the spatial resolution of the 3D map especially in lateral (R-L) direction. The edge data from the UTE image, improved the spatial resolution in longitudinal direction (S-I) compared to GRE magnitude image. The average length and width of the seeds in 3D susceptibility maps calculated using different methods are presented in Table 1. The “REVSHARP+MEDI+UTE ” generated the closest dimensions to the actual seed size and can easily differentiate between two closely placed seeds (≈3mm apart).
The 3D K-means clustering technique was able to calculate the seeds’ center coordinates on REVSHARP+MEDI+UTE 3D maps with less than 0.3% difference from the actual seed centers measured on the phantom. The clustering output on HARPERELLA and VSHARP based maps was not able to differentiate between the two seeds that were less than 3mm apart laterally .
Conclusion
Our results suggest that REVSHARP+MEDI+UTE is the most efficient QSM-based method to produce positive contrast for the seeds; 3D k-means clustering calculated the seeds centers with high accuracy. The limitation of the proposed method is that the clustering algorithm requires prior knowledge of the number of seeds (clusters) however, in practice if seed migration occurs (very rare) the number of implanted seeds may be more than the number of present seeds in prostate. Different unsupervised machine-learning algorithms are being developed/evaluated to detect seeds on 3D susceptibility maps.Acknowledgements
No acknowledgement found.References
1. Stock RG, Stone NN. Importance of post-implant dosimetry in permanent prostate brachytherapy. Eur Urol. 2002;41(4):434-439.
2. Collins Fekete C-A, Plamondon M, Martin A-G, Vigneault É, Verhaegen F, Beaulieu L. Calcifications in low-dose rate prostate seed brachytherapy treatment: post-planning dosimetry and predictive factors. Radiother Oncol. 2015;114(3):339-344. doi:10.1016/j.radonc.2015.01.014.
3. Nag S, Bice W, DeWyngaert K, Prestidge B, Stock R, Yu Y. The American Brachytherapy Society recommendations for permanent prostate brachytherapy postimplant dosimetric analysis. Int J Radiat Oncol Biol Phys. 2000;46(1):221-230.
4. Salembier C, Lavagnini P, Nickers P, et al. Tumour and target volumes in permanent prostate brachytherapy: a supplement to the ESTRO/EAU/EORTC recommendations on prostate brachytherapy. Radiother Oncol. 2007;83(1):3-10. doi:10.1016/j.radonc.2007.01.014.
5. Hayman O, Palmer A, Vigneri P, et al. CT-based post-implant dosimetry for I-125 prostate brachytherapy: a multi-centre audit in the UK and Ireland. J Radiother Pract. 2013;12(4):297-304. doi:10.1017/S1460396912000489.
6. de Leeuw H, Seevinck PR, Bakker CJG. Center-out radial sampling with off-resonant reconstruction for efficient and accurate localization of punctate and elongated paramagnetic structures. Magn Reson Med. 2013;69(6):1611-1622. doi:10.1002/mrm.24416.
7. Kuo N, Lee J, Tempany C, Stuber M, Prince J. MRI-BASED PROSTATE BRACHYTHERAPY SEED LOCALIZATION. Proceedings IEEE Int Symp Biomed Imaging. 2010;2010:1397-1400. doi:10.1109/ISBI.2010.5490259.
8. Martin GV, Pugh TJ, Mahmood U, et al. Are We Ready to Replace Postimplant CT Dosimetry? Permanent Prostate Brachytherapy Postimplant MRI Dosimetry Using Positive Contrast MRI Markers. Int J Radiat Oncol. 2016;96(2):E280-E281. doi:10.1016/j.ijrobp.2016.06.1328.
9. Varma G, Clough RE, Acher P, et al. Positive visualization of implanted devices with susceptibility gradient mapping using the original resolution. Magn Reson Med. 2011;65(5):1483-1490. doi:10.1002/mrm.22710.
10. Dahnke H, Liu W, Herzka D, Frank JA, Schaeffter T. Susceptibility gradient mapping (SGM): a new postprocessing method for positive contrast generation applied to superparamagnetic iron oxide particle (SPIO)-labeled cells. Magn Reson Med. 2008;60(3):595-603. doi:10.1002/mrm.21478.
11. Dong Y, Chang Z, Xie G, Whitehead G, Ji JX. Susceptibility-based positive contrast MRI of brachytherapy seeds. Magn Reson Med. 2015;74(3):716-726. doi:10.1002/mrm.25453.
12. Rehman I, Smith R, Hench LL, Bonfield W. Structural evaluation of human and sheep bone and comparison with synthetic hydroxyapatite by FT-Raman spectroscopy. J Biomed Mater Res. 1995;29(10):1287-1294. doi:10.1002/jbm.820291016.
13. Dong J, Chen F, Zhou D, Liu T, Yu Z, Wang Y. Phase unwrapping with graph cuts optimization and dual decomposition acceleration for 3D high-resolution MRI data. Magn Reson Med. March 2016:n/a-n/a. doi:10.1002/mrm.26174.
14. Liu T, Khalidov I, De Rochefort L, et al. A novel background field removal method for MRI using projection onto dipole fields (PDF). NMR Biomed. 2011;24:1129-1136. doi:10.1002/nbm.1670.
15. Zhou D, Liu T, Spincemaille P, Wang Y. Background field removal by solving the Laplacian boundary value problem. NMR Biomed. 2014;27(3):312-319. doi:10.1002/nbm.3064.
16. Li W, Avram A V, Wu B, Xiao X, Liu C. Integrated Laplacian-based phase unwrapping and background phase removal for quantitative susceptibility mapping. NMR Biomed. 2014;27(2):219-227. doi:10.1002/nbm.3056.
17. Wu B, Li W, Guidon A, Liu C. Whole brain susceptibility mapping using compressed sensing. Magn Reson Med. 2012;67(1):137-147. doi:10.1002/mrm.23000.
18. Kan H, Kasai H, Arai N, Kunitomo H, Hirose Y, Shibamoto Y. Background field removal technique using regularization enabled sophisticated harmonic artifact reduction for phase data with varying kernel sizes. Magn Reson Imaging. 2016;34(7):1026-1033. doi:10.1016/j.mri.2016.04.019.
19. Liu T, Liu J, de Rochefort L, et al. Morphology enabled dipole inversion (MEDI) from a single-angle acquisition: comparison with COSMOS in human brain imaging. Magn Reson Med. 2011;66(3):777-783. doi:10.1002/mrm.22816.
20. Liu J, Liu T, de Rochefort L, et al. Morphology enabled dipole inversion for quantitative susceptibility mapping using structural consistency between the magnitude image and the susceptibility map. Neuroimage. 2012;59(3):2560-2568. doi:10.1016/j.neuroimage.2011.08.082.
21. Bilgic B, Chatnuntawech I, Fan AP, et al. Fast image reconstruction with L2-regularization. J Magn Reson Imaging. 2014;40(1):181-191. doi:10.1002/jmri.24365.
22. Li W, Wu B, Liu C. Quantitative susceptibility mapping of human brain reflects spatial variation in tissue composition. Neuroimage. 2011;55(4):1645-1656. doi:10.1016/j.neuroimage.2010.11.088.
Figures