3651
Importance of reference in QSM and a new differential ROI reference method1Department of Electrical and Computer Engineering, Seoul National University, Seoul, Korea, Republic of, 2Department of Radiology, ASAN Medical Center, Korea, Republic of, 3Department of Radiology, Kyung Hee University Hospital at Gangdong, Korea, Republic of
Synopsis
In this study, we developed a computer simulation to demonstrate the importance of reference in QSM. The results show that QSM values are substantially affected by spatial coverage for reconstruction. Only when the data are referenced using a neighboring region, the QSM results provide correct susceptibility values. Additionally, we suggest a new “differential ROI” reference method. This approach reports the susceptibility value as a difference between two (neighboring) ROIs. We demonstrate this new approach for a Parkinson’s disease patient study.
Purpose
In QSM, reconstructed susceptibility values do not report the susceptibility difference from water or vacuum but have arbitrary offsets from reconstruction. Therefore, QSM values are often reported relative to that of reference in the same map. Previously, susceptibility maps were referenced to CSF (1-3) or white matter (4-7) or the mean of the whole brain QSM values (8,9). In a few studies, no reference has been reported (10). In this work, we demonstrate that QSM values are affected by scan and reconstruction parameters such as the coverage of the brain slices and the extent of brain mask to demonstrate the importance of a proper reference. Additionally, we propose a “differential” ROI reference as an alternative approach of setting a reference in QSM.Methods
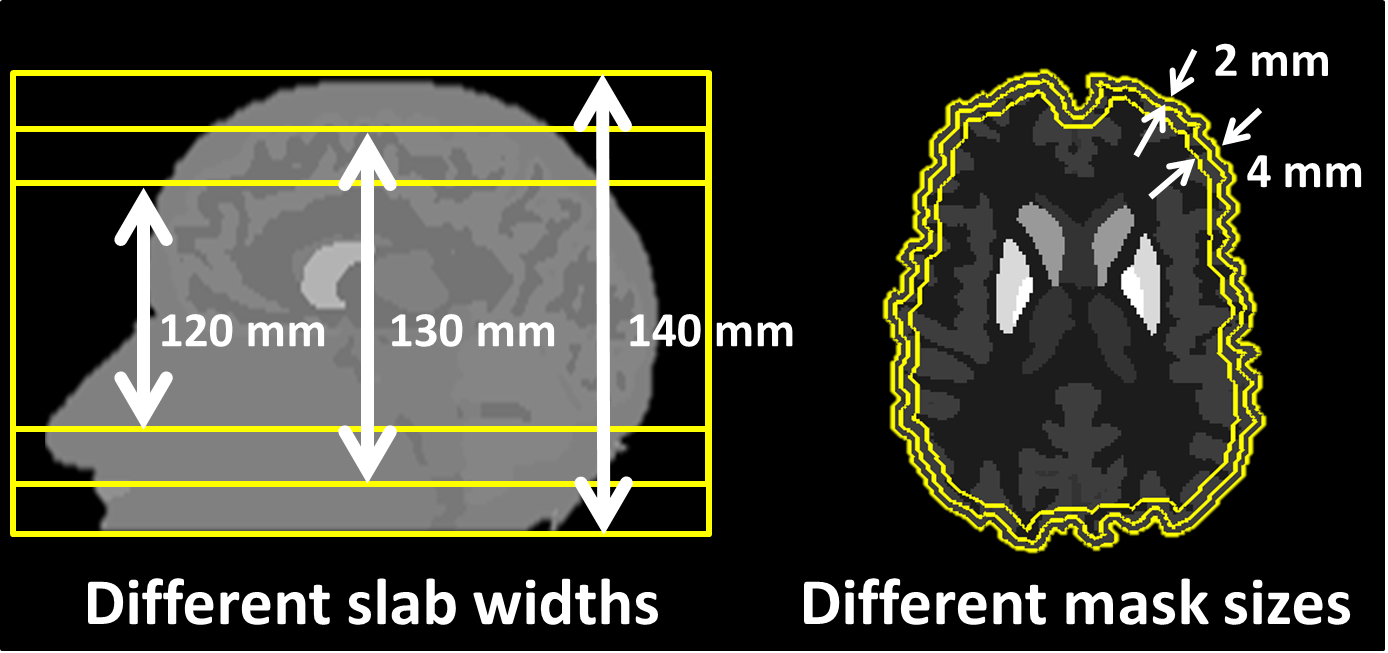
[Importance of Reference in QSM] To demonstrate the importance of a proper reference in QSM, a simulation phantom was developed using Zubal’s model (11) The susceptibility values were assigned as follows: Caudate nucleus (CN)=0.4ppm, Putamen (PU)=0.65ppm, Global pallidus (GP)=0.8ppm, CSF=0ppm, WM=-0.09 ppm, and GM=0.04ppm. Using the phantom, a magnetic field distribution was generated by convoluting the susceptibility map with a dipole kernel (12). Then, the results were reconstructed using a QSM algorithm (12) for three different slab widths (120 mm, 130 mm, and 140 mm) and three different mask sizes (0 mm, 2 mm, and 4 mm) (Fig. 1).
[Differential ROI Reference] As an alternative to conventional reference approaches, we propose a new “differential” ROI reference method. In this approach, we report the susceptibility difference between two (adjacent) ROIs and provide an interpretation of the results as “susceptibility difference” between “two ROIs”. This suggestion may sound trivial but has important implication particularly in group comparison because it no longer assumes that a “reference” region has no susceptibility difference between groups. In most studies, this assumption of no susceptibility difference in reference is asserted without any evidence. When the differential ROI reference is used with a proper interpretation (i.e. report group level difference in susceptibility difference between two ROIs), no such assumption is necessary. As an example of this new differential ROI reference, QSM results were compared between Parkinson disease patients (PD) and healthy controls.
Seventeen PD and eighteen age-matched controls were scanned at 3T using gradient-echo (TR=42.8ms, TE=3.4:6:21.4ms, matrix=352x352x80, resolution=0.625x0.625x2mm³. Susceptibility maps were reconstructed (1,13). For ROI analysis, all subject’s data were registered to the MNI template (14). Five deep gray matter regions (SN, RN, CN, GP, PU) were manually drawn. Student’s t-test was performed between the two groups for each pair of ROIs with multiple-comparison correction using FDR-BH (15).
Results
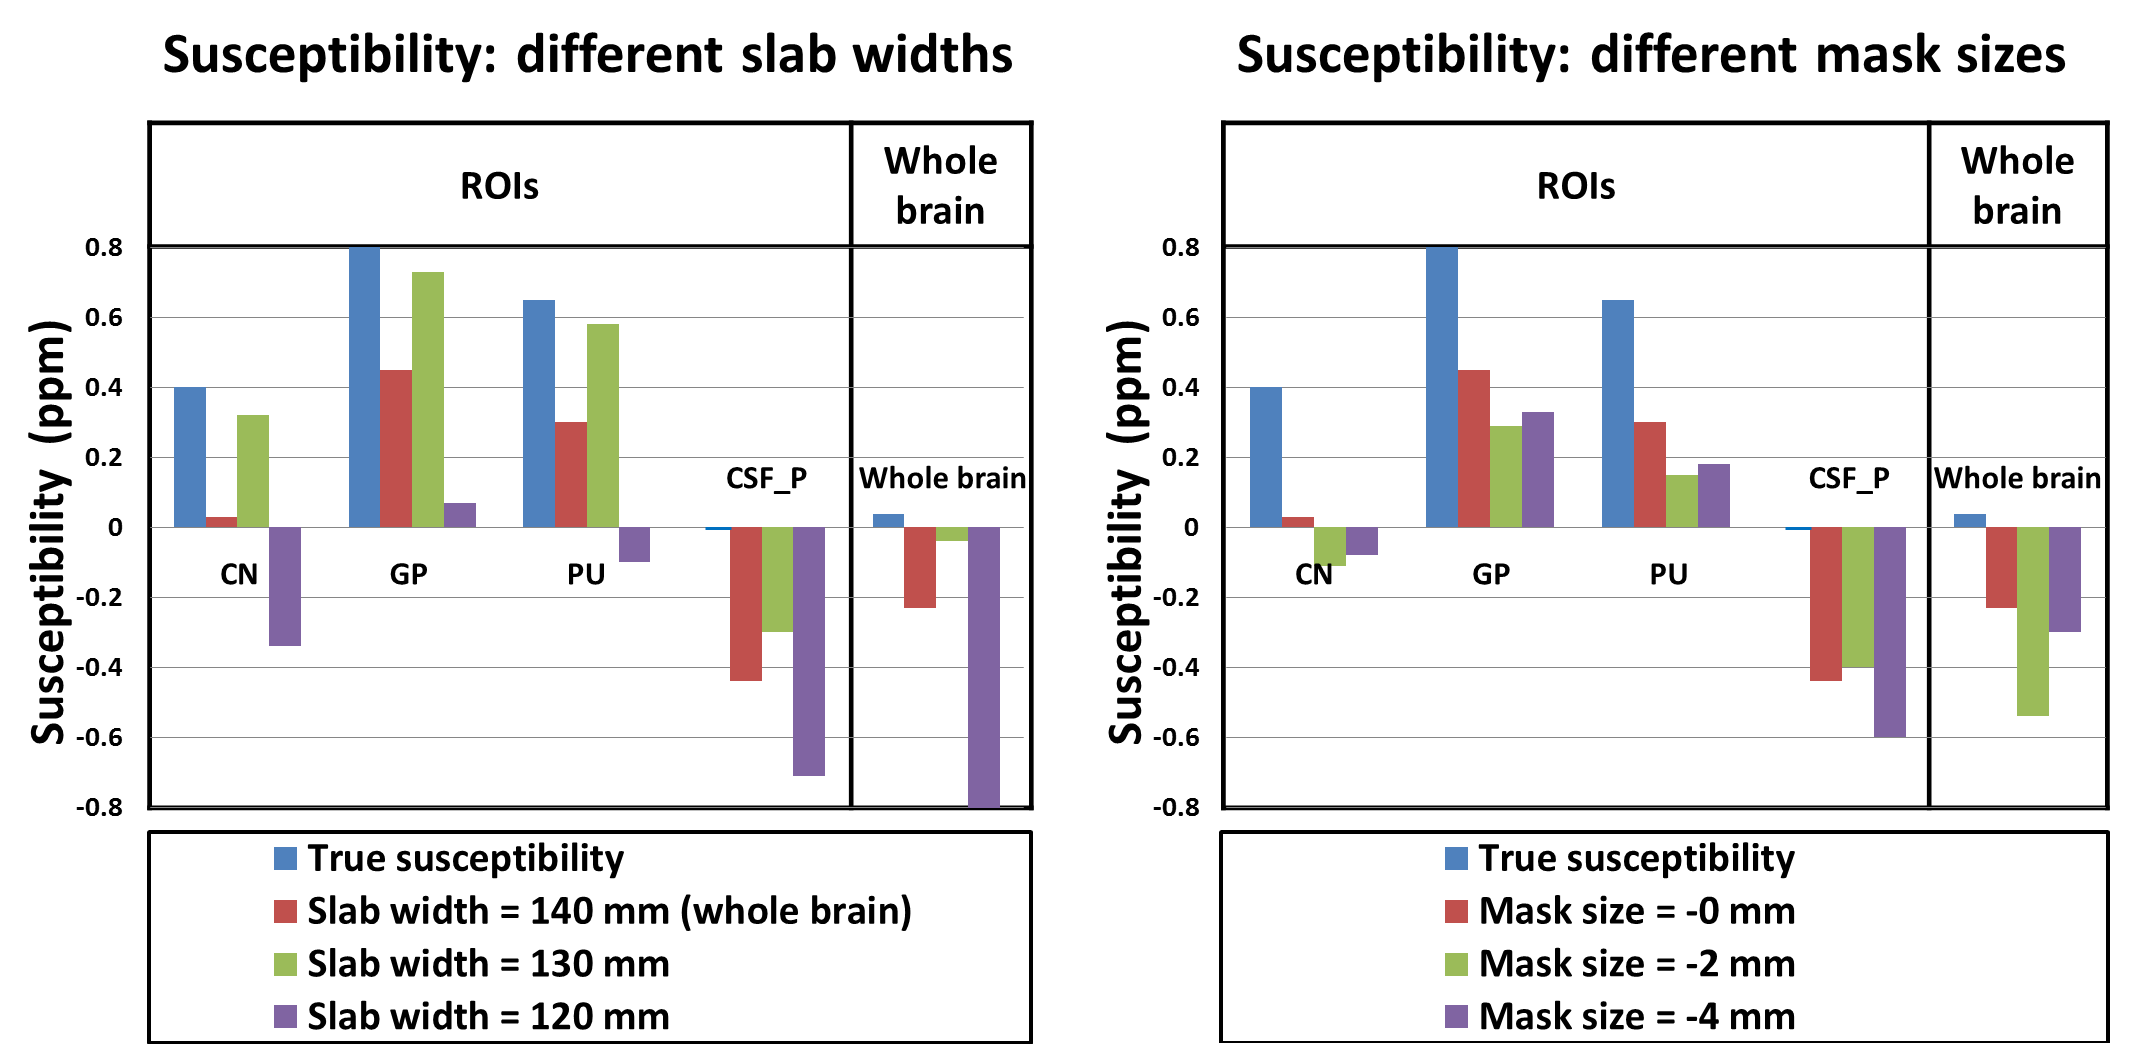
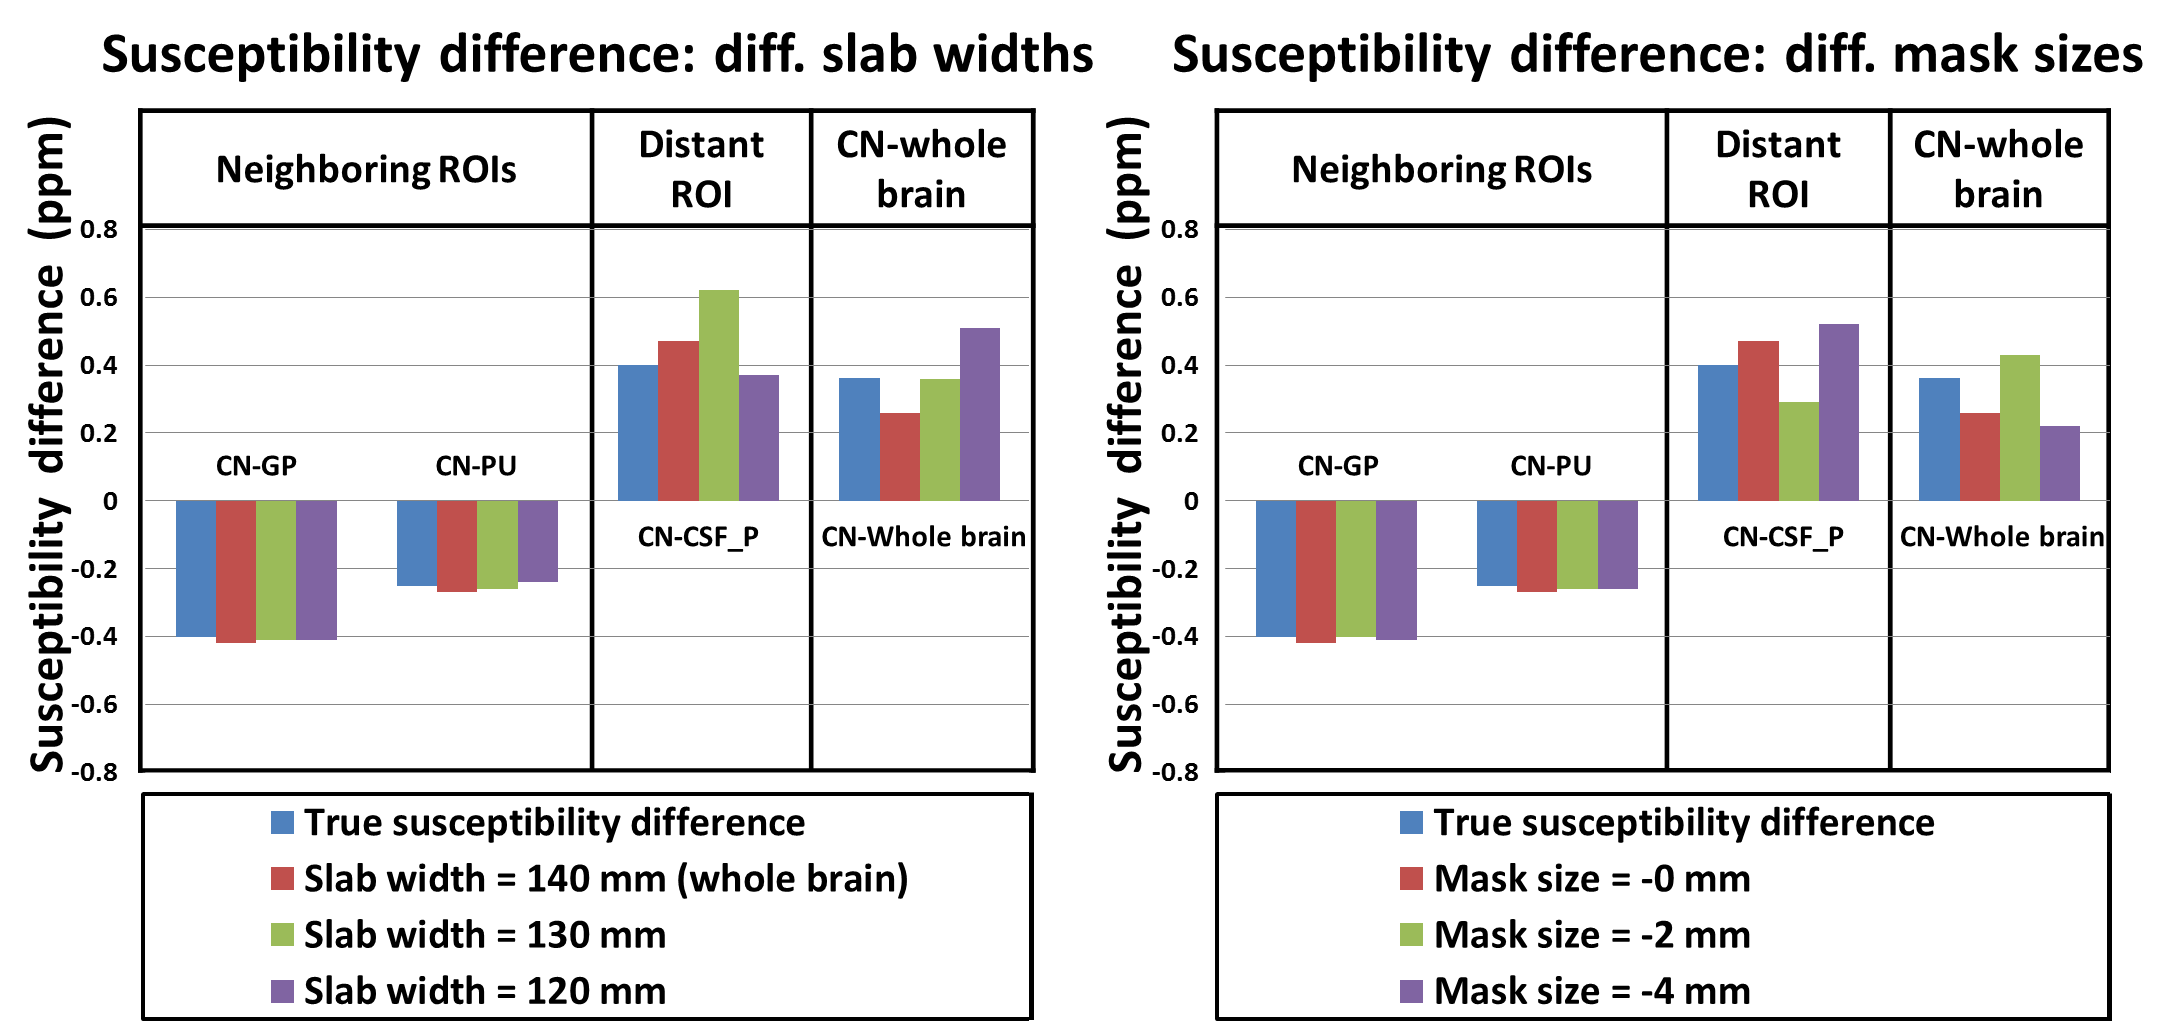
The simulation results are summarized in Figures 2 and 3. The mean susceptibility values in CN, GP, PU, CSF posterior (CSF_P) and whole brain varies substantially as the slab width and brain mask size changes. When the susceptibility values are referenced using physically neighboring references (e.g. CN referenced by GP; Figure 3), they become close to the correct values. On the other hand, if a distant reference or a whole brain reference is used, the susceptibility values are still affected by the slab widths and mask sizes. The errors are substantial (up to 55%), suggesting that it is important to use a proper reference.
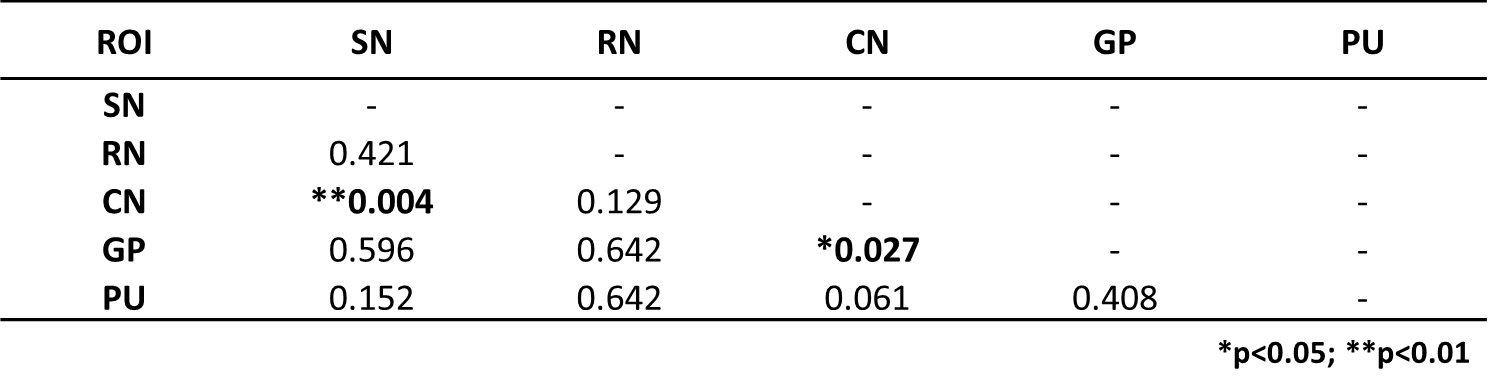
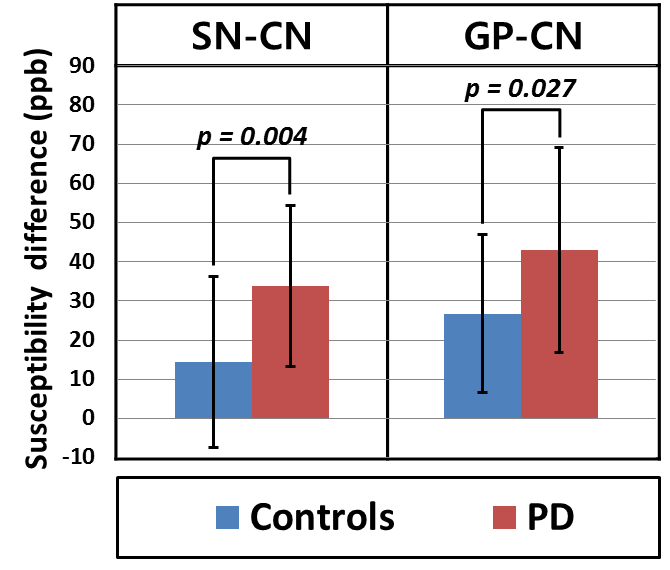
The t-test result of the PD data using the differential reference is summarized in (Table 1). The results show that compared to healthy controls, PD patients has statistically different susceptibility difference between SN and CN and between GP and CN. The susceptibility difference between SN and CN (or GP and CN) was significantly higher in the PD patients than in the healthy controls (Figure. 4).
Conclusion and Discussion
In this work, we demonstrated that a proper reference is essential in QSM and suggested differential ROI reference. In particular, the use of differential ROI reference avoids the assumption of equal susceptibility in reference between groups in a group comparison. This assumption is rarely validated and, therefore, is problematic. When the differential ROI reference is used, no such assumption is necessary. One draw of the differential ROI reference is interpretation which becomes verbose since the “susceptibility difference” between two regions is compared. For example, in previous studies, it is often stated that "ROI X is different between group A and group B." In the differential reference, one needs to state that "difference between ROI X and ROI Y is different between group A and group B." Note that the previous interpretation is incorrect since the QSM value in ROI X needs to be referenced to a region and the choice of the region significantly affects the results.Acknowledgements
This research was supported by the Brain Research Program through the National Research Foundation of Korea (NRF) funded by the Ministry of Science, ICT & Future Planning (NRF-2015M3C7A1031969) and the Brain Korea 21 Plus Project in 2016.
References
[1] Li, W., et al., Quantitative susceptibility mapping of human brain reflects spatial variation in tissue composition. Neuroimage. 2011; 55(4): 1645-1656.
[2] Lim, I. A., et al., Human brain atlas for automated region of interest selection in quantitative susceptibility mapping: application to determine iron content in deep gray matter structures. Neuroimage. 2013; 82: 449-469.
[3] Schweser, F., et al., Quantitative imaging of intrinsic magnetic tissue properties using MRI signal phase: an approach to in vivo brain iron metabolism?. Neuroimage. 2011; 54(4): 2789-2807.
[4] Barbosa, J. H. O., et al., Quantifying brain iron deposition in patients with Parkinson's disease using quantitative susceptibility mapping, R2 and R2. Magnetic resonance imaging. 2015; 33(5), 559-565.
[5] Langkammer, C., et al., Quantitative susceptibility mapping (QSM) as a means to measure brain iron? A post mortem validation study. Neuroimage. 2012; 62(3): 1593-1599.
[6] Al-Radaideh, A. M., et al., Increased iron accumulation occurs in the earliest stages of demyelinating disease: an ultra-high field susceptibility mapping study in clinically isolated syndrome. Multiple Sclerosis Journal. 2013; 19(7): 896-903.
[7] Straub, S., et al., Suitable reference tissues for quantitative susceptibility mapping of the brain. Magnetic Resonance in Medicine. (2016).
[8] Li, W., et al., A method for estimating and removing streaking artifacts in quantitative susceptibility mapping. Neuroimage. 2015; 108: 111-122.
[9] He, N., et al., Region-specific disturbed iron distribution in early idiopathic Parkinson's disease measured by quantitative susceptibility mapping. Human Brain Mapping. 2015; 36(11): 4407-4420.
[10 ] Li, Wei, et al. Differential developmental trajectories of magnetic susceptibility in human brain gray and white matter over the lifespan. Human brain mapping. 2014; 35(6): 2698-2713.
[11] Zubal, I. G., et al., High resolution, MRI-based, segmented, computerized head phantom. 1999; (No. ORISE--99-0164-Vol. 1; CONF-960536--PROC.-Vol. 1). ). Oak Ridge Associated Universities, TN (United States)
[12] Wang, Y., & Liu, T. Quantitative susceptibility mapping (QSM): decoding MRI data for a tissue magnetic biomarker. Magnetic resonance in medicine. 2015; 73(1): 82-101.
[13] Li, W., Wang, N., Yu, F., et al., A method for estimating and removing streaking artifacts in quantitative susceptibility mapping. Neuroimage. 2015; 108: 111-122.
[14] Avants, Brian B., Nick Tustison, and Gang Song. Advanced normalization tools (ANTS). 2009; Insight J 2: 1-35.
[15] Benjamini, Y., & Hochberg, Y. Controlling the false discovery rate: a practical and powerful approach to multiple testing. Journal of the royal statistical society. 1995; Series B (Methodological): 289-300.
Figures