3650
Paramagnetic ions quantification using QSM and EPR in human brainJeam Haroldo Oliveira Barbosa1, Rafael Emidio2, Ana Tereza Di Lorenzo Alho2, Maria Conception Garcia Otaduy2, Edson Amaro2, Fernando Barbosa Junior3, Oswaldo Baffa Filho1, and Carlos Ernesto Garrido Salmon1
1InBrain Lab, Department of Physics, Faculty of Philosophy, Sciences and Letters of Ribeirão Preto, University of Sao Paulo, Ribeirao Preto, SP, Brazil, 2Laboratory of Magnetic Resonance in Neuroradiology, LIM-44, Institute and Department of Radiology, University of Sao Paulo, Sao Paulo, SP, Brazil, 3Department of Clinical Analyses, Toxicology and Food Sciences, School of Pharmaceutical Sciences of Ribeirão Preto, University of Sao Paulo, Ribeirao Preto, SP, Brazil
Synopsis
QSM, R2* and R2 values for post-mortem intra and
Purpose:
To study the relationship between paramagnetic ion (Fe3+ and Cu2+) concentrations and image quantitative values (susceptibility, R2 and R2*) in deep gray matter regions for intra and extra cranial conditions. Additionally, we aim to identify the metalloproteins associate to these paramagnetic ions in healthy controls.Materials and Methods:
One phantom was built with individual finger latex balloons (length~9 cm, diameter=6mm) filled with different horse spleen ferritin (F4503, Sigma-Aldrich) solutions and embedded in a pure gelatin matrix (6%). Finally, the plastic vials were put inside a glass Becker filled with water (3L) and parallel oriented with main magnetic field. Three cognitively normal postmortem human brains (60±3years, two male, postmortem interval ≤15 hours) were in situ scanned using a 3T MR scanner: multi-gradient-echo sequence with 4 equally spaced echoes (TE=3.7-22.7ms); Turbo Spin Echo sequence with 12 equally spaced echoes (18-216ms), TR=3s. After 148±46 days, formalin-fixed brains were extra cranial scanned following the same imaging protocol. We calculated the susceptibility maps from phantom and human brain using methods described in previous works (1, 2). R2 and R2* were calculated using polynomial fitting. Several ROIs were manually drawn in the basal ganglia: substantia nigra, red nucleus, globus pallidus, putamen, caudate nucleus and thalamus. Thirty-six tissue freeze-dried samples from these regions in the basal ganglia were assessed using an Electron Paramagnetic Resonance (EPR) X-Band spectrometer (Jeol JES-FA-200) with a central magnetic field of 500mT, scanning field of 500mT, scan time of 15 minutes, modulation amplitude of 1mT and microwave power of 2mW. A reference EPR spectrum was acquired from a ferritin solution. Total metal concentrations (Fe, Cu, Zn, Al and Ca) were estimated by using inductively coupled plasma mass spectrometry technique in the tissue samples. EPR simulations were performed using the EasySpin® toolbox (3) to quantify the paramagnetic ions in the experimental spectrum (g-value and respective amplitude peak-to-peak normalized by mass).Results:
Fig.1 shows QSM, R2 and R2* maps for one post-mortem intra and extra cranial. Fig.2 shows raw and simulated EPR spectra for a freeze-dried sample of the globus pallidus from a post-mortem. Four main peak resonances were detected on the EPR spectrum in all studied brain regions with different amplitudes between them. The peaks were referent to ferritin (Fe3+, g=4.28 and g=2.0) and ceruloplasmin (Cu2+, gII=2.259 and g⊥=2.062) (Fig.2). Fig.3 shows linear correlations between intra and extra cranial relative susceptibility, R2* and R2 values with peak-to-peak amplitude of EPR resonance peaks at g=2.0 (Fe3+). No correlation was found for Fe3+ (g=4.28) and Cu2+. Fig.4 shows linear correlation between QSM, R2* and R2 values with total iron concentration in ferritin phantom and brain regions in intra and extra cranial post-mortem conditions. Fig.5-left shows the linear correlations between susceptibility values with R2* (s-1) for intra and extra cranial conditions. Fig.5-right shows the correlation between QSM intra and QSM extra cranial. No correlation was observed between quantitative susceptibility and relaxometry values with others quantified metals (Fig.4).Discussion and Conclusion:
QSM, R2* and R2 values for post-mortem intra and extra cranial human brain samples were statistically correlated with only total iron and Fe3+ present in ferritin; justified by the high iron concentration, at least 10 times bigger than cooper (4), in the basal ganglia regions. An identical finding was observed for extra cranial condition with a high correlation between QSM values for both conditions (Fig.5). Therefore, our results indicate the paramagnetic ion Fe3+ (g=2.0) from ferritin as the main metal to change image quantitative values, as suggested by Schenck (9).Acknowledgements
No acknowledgement found.References
1. Riederer, P. et al. (1989). J. Neurochem., 52, 515–20. 2. Sofic, E. etal. (1991). J. Neurochem., 56, 978–82. 3. Langkammer, C. et al. (2012). Neuroimage, 59, 1413–1419 4. Barbosa, J.H.O. et al. (2013). 2nd Int. Work. MRI Phase Contrast Quant. Susceptibility Mapp. 5. Zheng W. et al. (2013). NeuroImage, 78, 68–74 6. Liu, T. et al. (2011). Magn. Reson. Med., 66, 777–83 7. Stoll, S. et al. (2009). Phys. Chem. Chem. Phys., 11, 6614–25 8. Zecca, L. et al. (1996). Neuroscience, 73, 407–415 9. Zecca, L. et al. (1993). J Neural Transm, 5, 203–213 10. Shima, T. et al. (1997). Free Radic. Biol. Med., 23, 110–119. 11. Kubiak T., Current Topics in Biophysics,2013, 36, 7-13.Figures
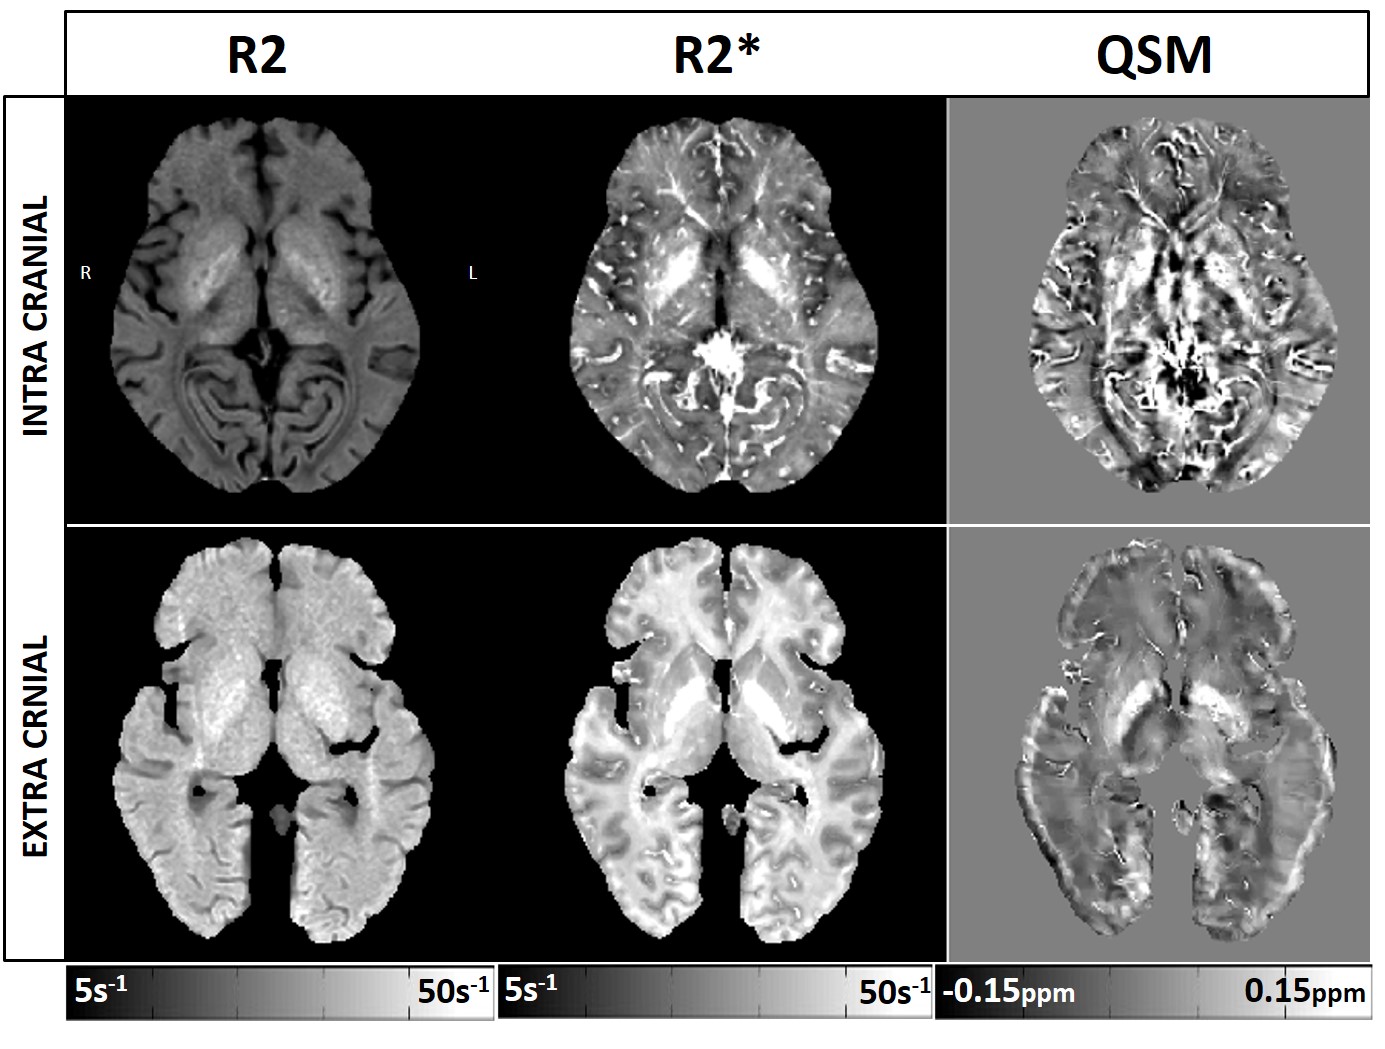
Fig.1: QSM, R2 and R2* maps from intra cranial and extra cranial image acquisitions of one post-mortem.
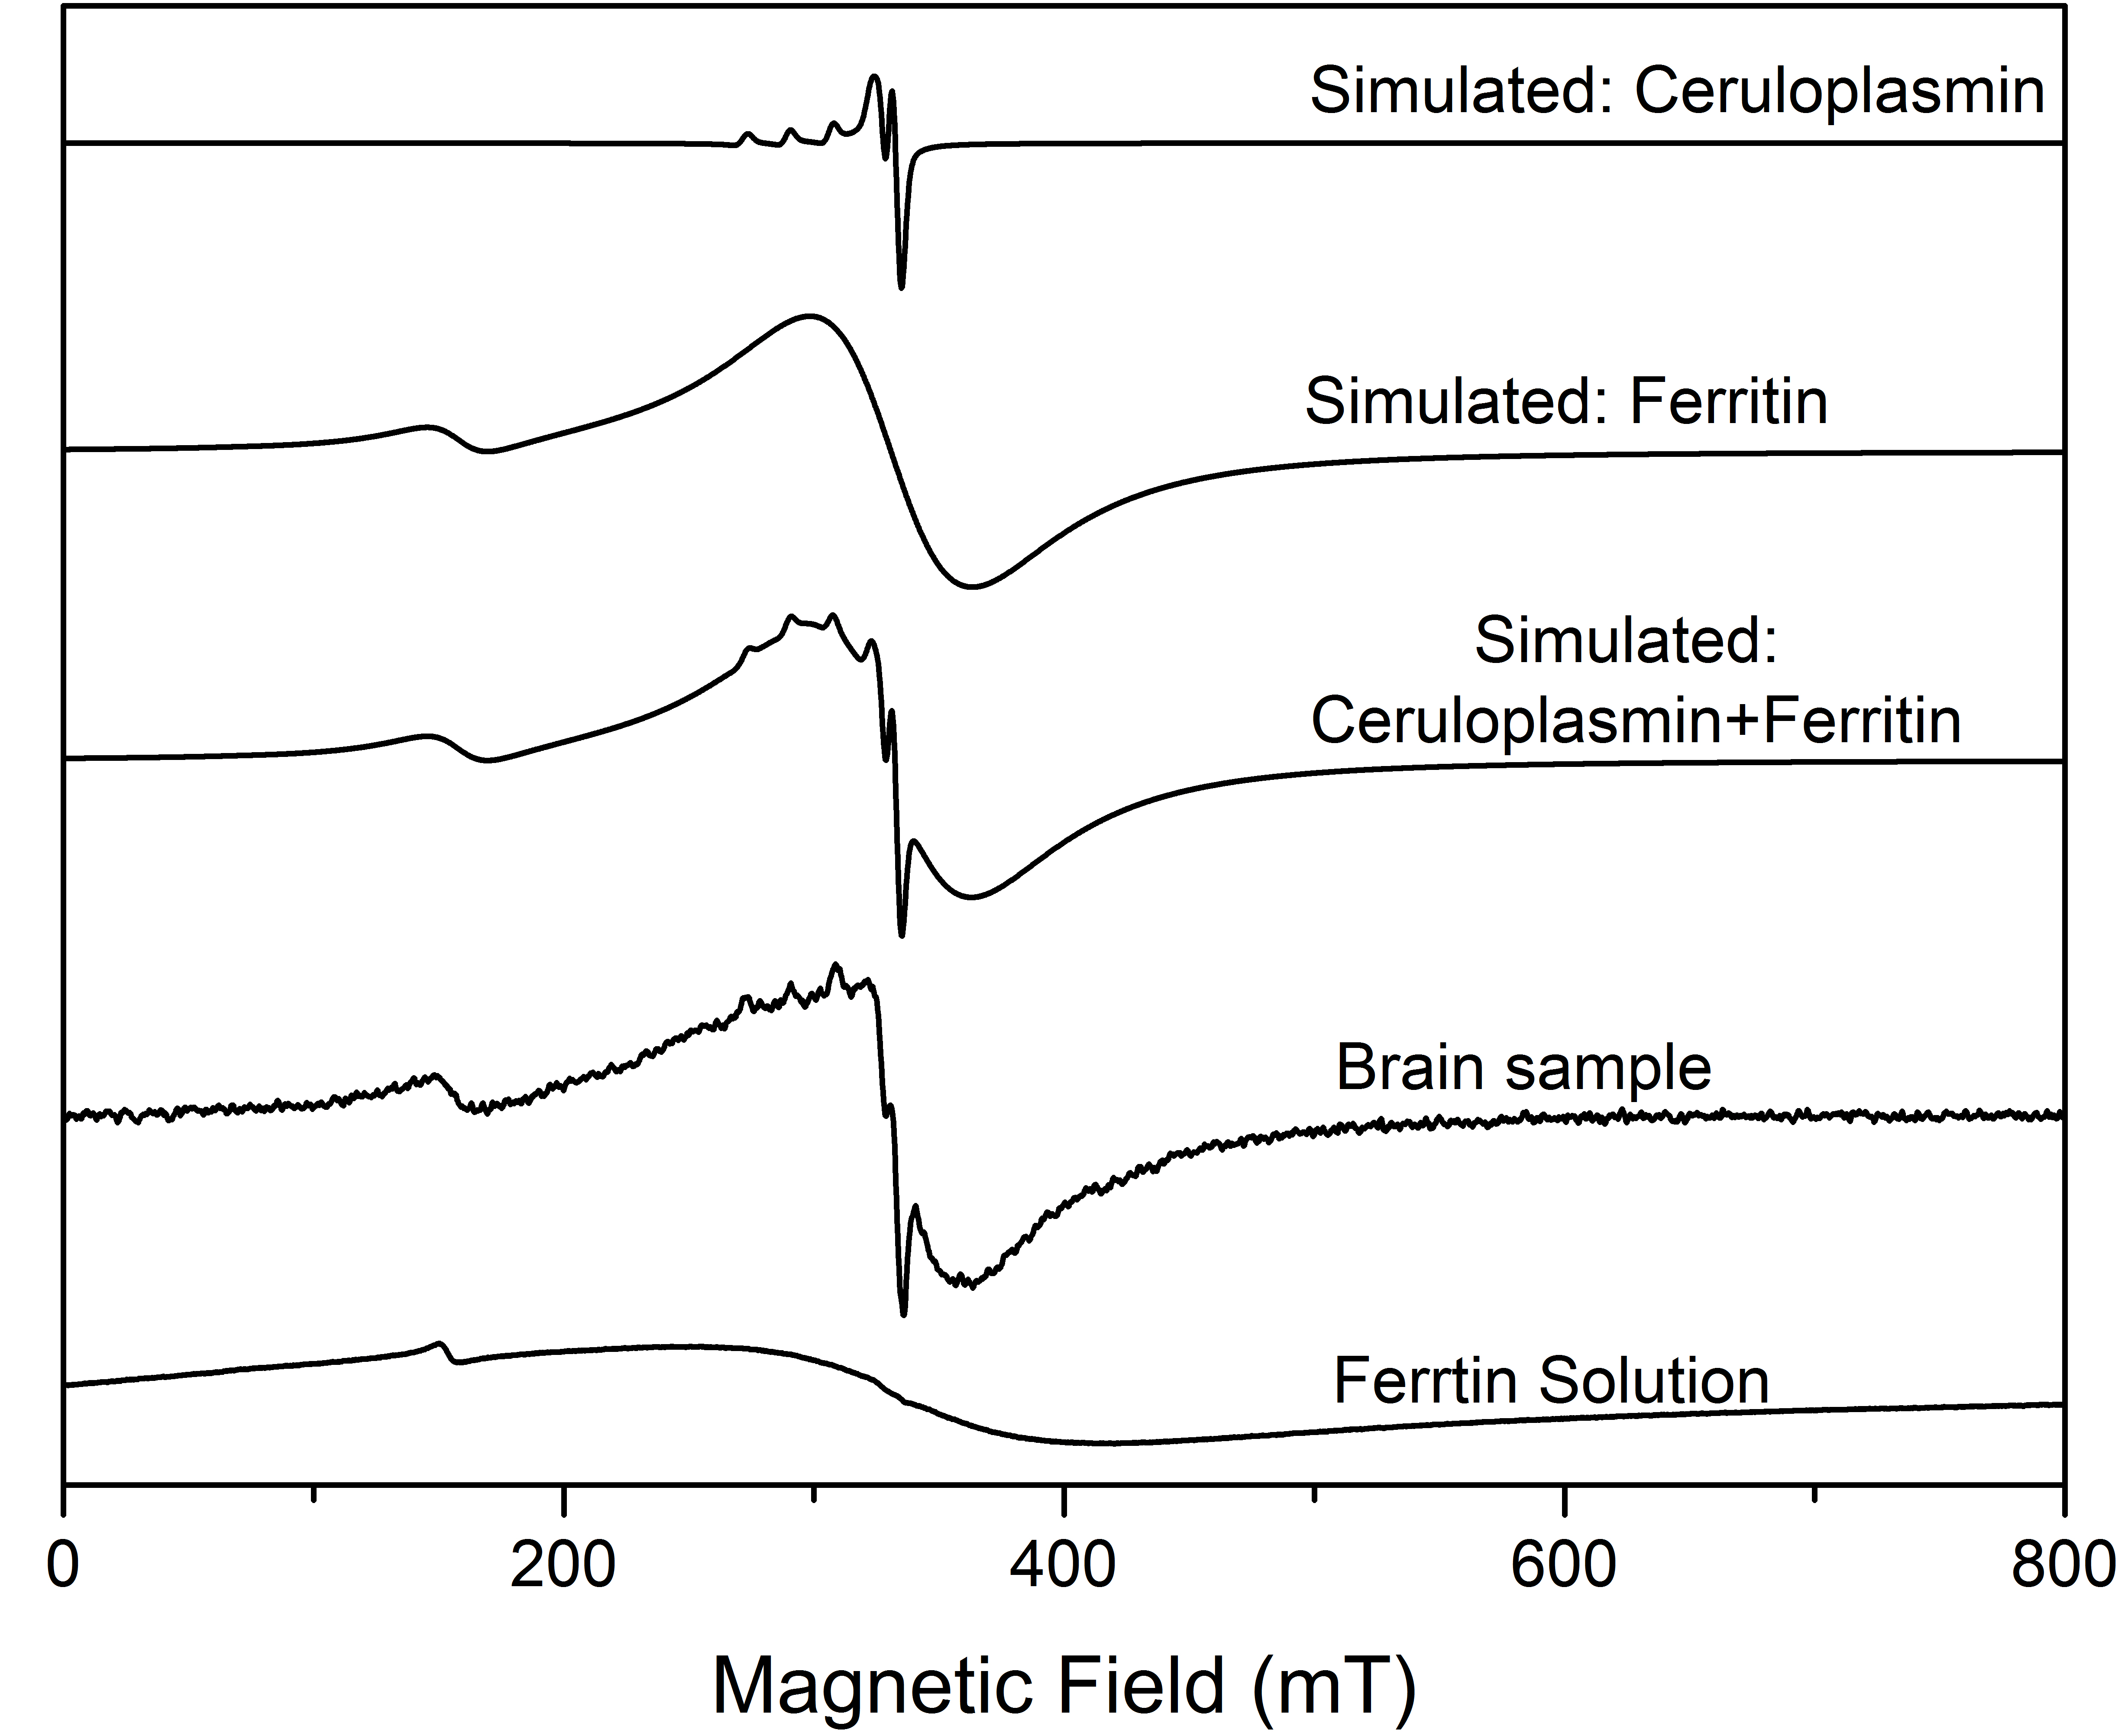
Fig.2: Simulated and raw EPR spectra of the freeze-dried sample of the
GP from a post-mortem in room temperature. The resonance peaks are identified
on the isolated simulated spectra.

Fig.3: Linear regression between intra and extra cranial relative susceptibility, R2* and R2 values with peak-to-peak amplitude of the EPR resonance peaks at g=2.0 (Fe3+). Dashed line represents the linear fitting for all subjects. The linear equation and squared correlation coefficient are inserted on each plot. Brain samples were taken from post-mortem 1 (red), 2 (blue) and 3 (black). Substantia nigra (SN), red nucleus (RN), globus pallidus (GP), putamen (PUT), caudate nucleus (CN), thalamus (THA) and white matter (WM).
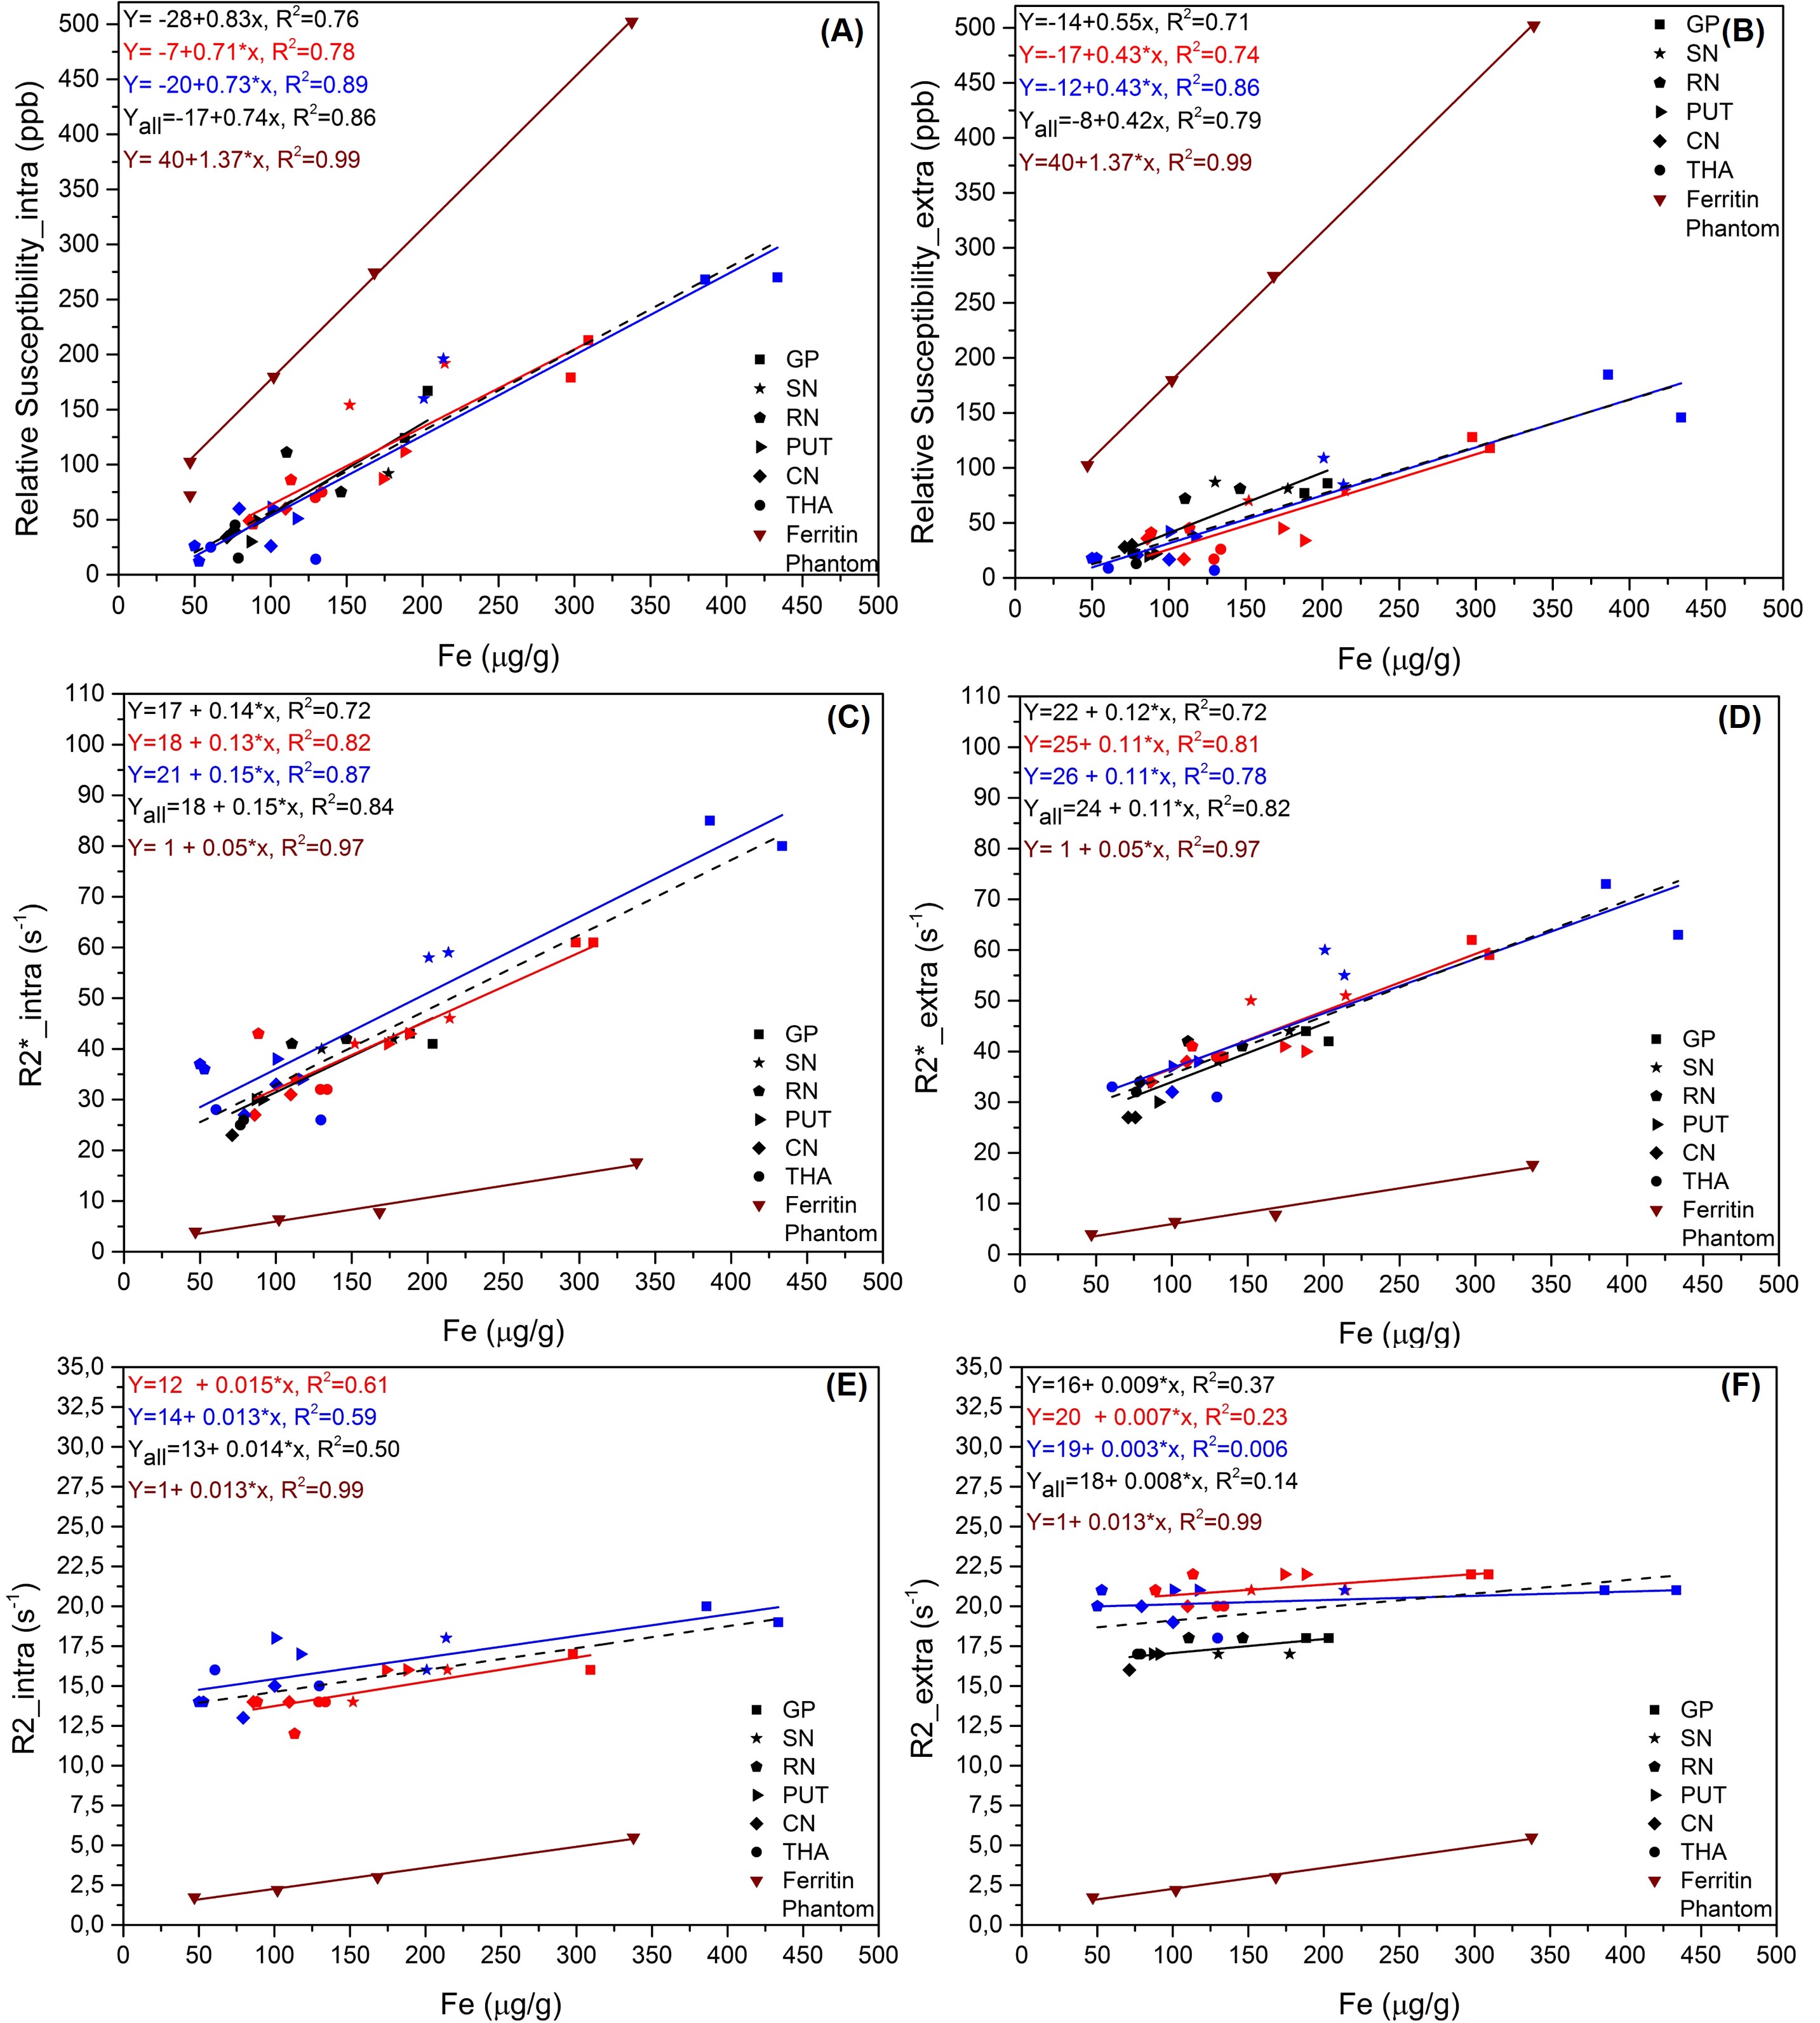
Fig.4: Linear regression between QSM, R2* and R2 values with total Fe
concentration. Dashed lines represent linear fittings for all subjects. The
linear equation and squared correlation coefficient for all the cases are
inserted on each plot. Brain samples were taken from post-mortem 1 (red), 2
(blue) and 3 (black). Substantia nigra (SN), red nucleus (RN), globus pallidus
(GP), putamen (PUT), caudate nucleus (CN), thalamus (THA) and white matter (WM).
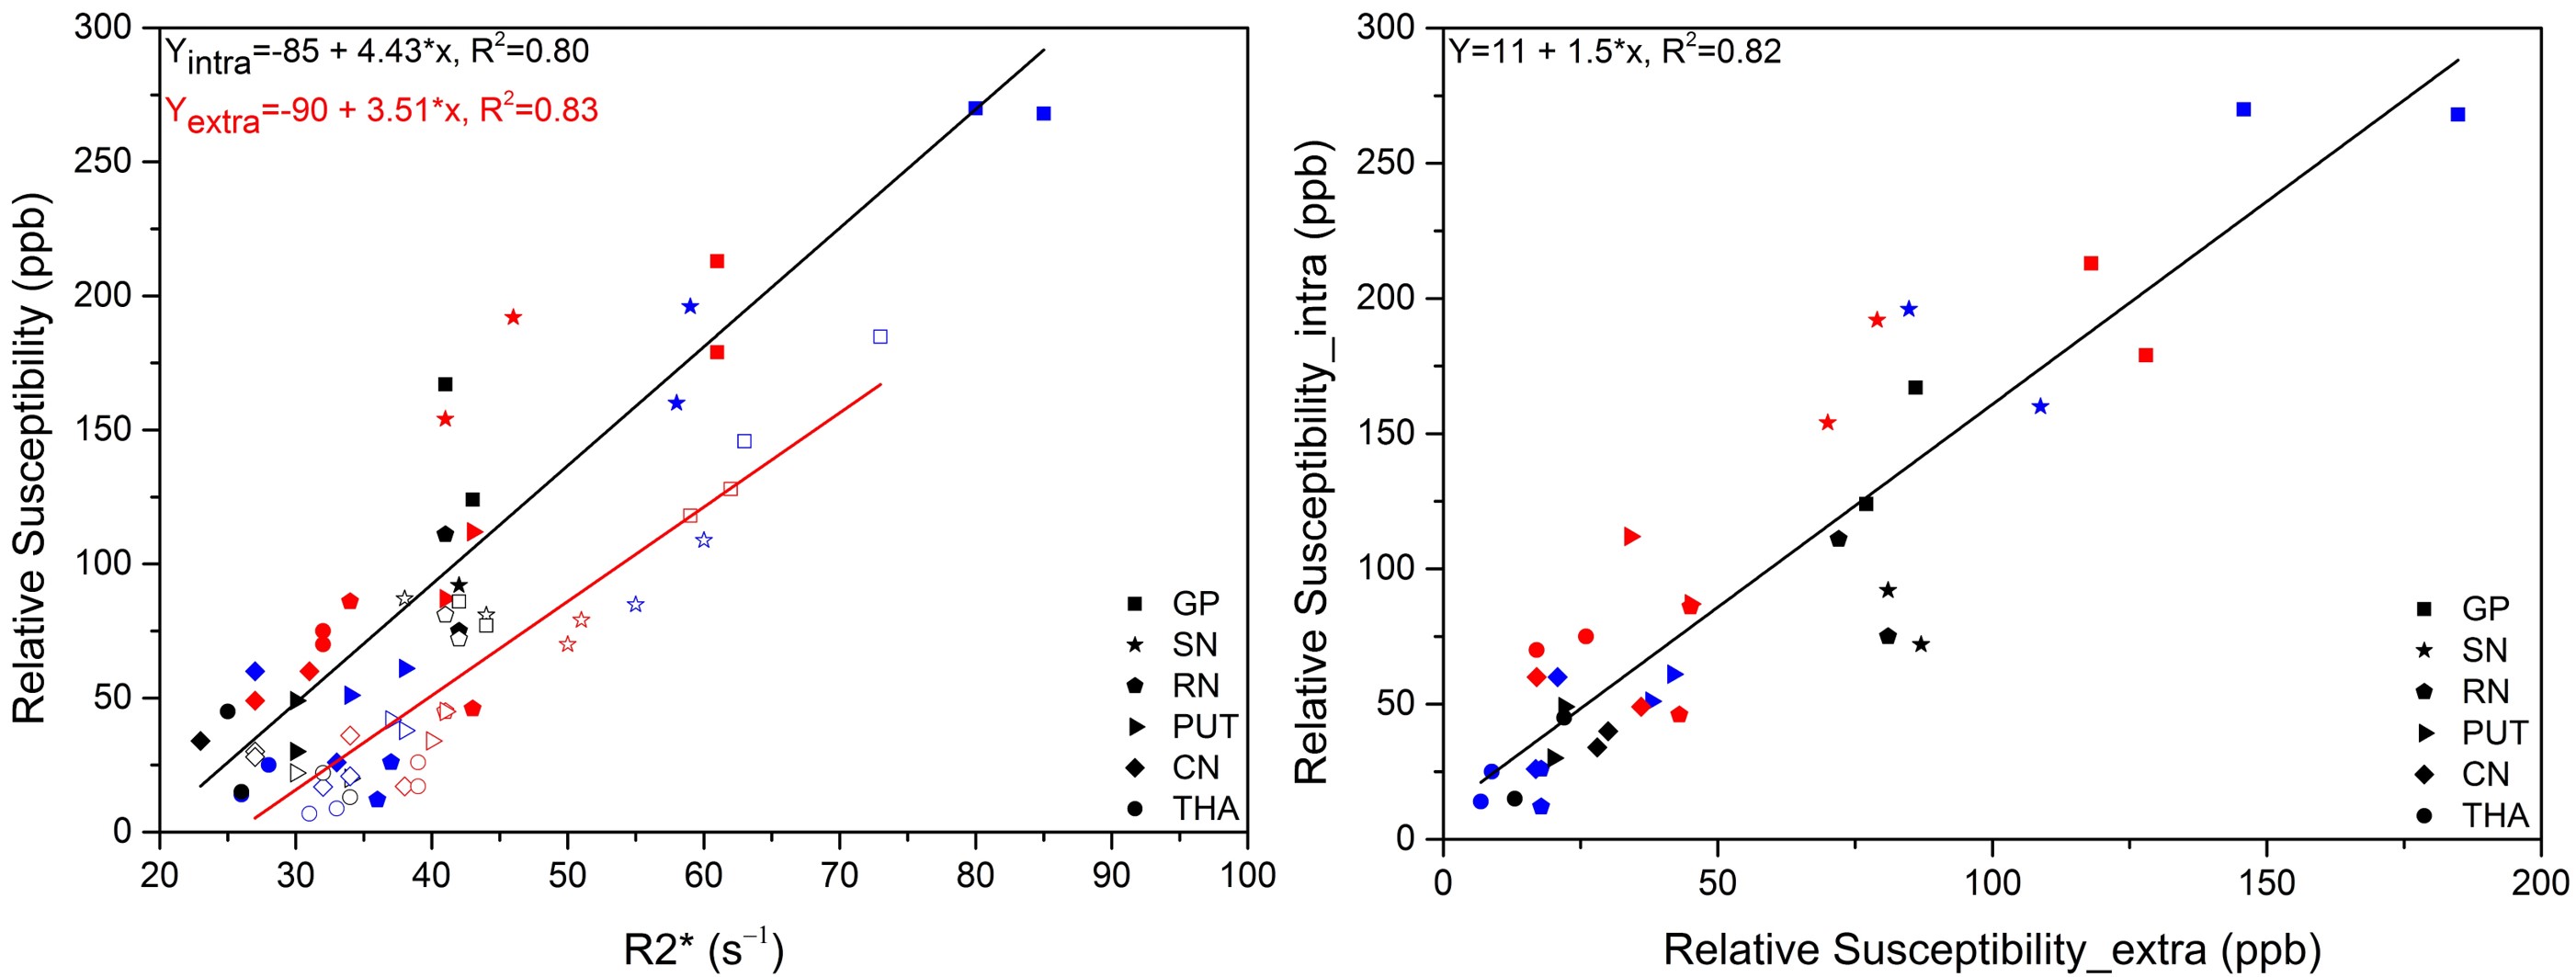
Fig.5: Intra and extra
cranial susceptibility values plotted versus R2* values intra e extra (left)
and between themselves (right). Brain samples were taken from post-mortem 1
(red), 2 (blue) and 3 (black). Substantia nigra (SN), red nucleus (RN), globus
pallidus (GP), putamen (PUT), caudate nucleus (CN), thalamus (THA) and white
matter (WM).