3649
Does Total Iron Content in Deep Brain Nuclei Really Increase in Healthy Aging? A Study Based on Quantitative Susceptibility Mapping.1University of California, Berkeley, berkeley, CA, United States, 2Department of Radiology, Ruijin Hospital, Shanghai Jiaotong University School of Medicine, People's Republic of China
Synopsis
The crucial role of iron for normal neurological function in human brain has been well recognized. The iron concentration evolution trajectories in human brain deep nucleus have been shown monotonously increased with aging. However, previous studies concern only on iron concentration. At the same time, atrophy occurs in healthy ageing brains. These two competing effects raise an interesting possibility that the total iron content in deep brain nuclei may decrease. Surprisingly, the iron content, investigated by QSM, in globus pallidus, substantia nigra and red nuclei appear to decrease after the iron content reaching a peak.
INTRODUCTION
The crucial role of iron for normal neurological function in human brain has been well recognized. It is essential in oxidative metabolism and is a cofactor in the synthesis of neurotransmitters and myelin. In both histological and in-vivo studies, a continuous growth of iron deposition in deep brain nuclei with aging have been reported. The iron concentration evolution trajectories in human brain deep nucleus can be approximately fitted using an exponential growing function 1, 2. However, previous studies concern only on iron concentration in the brain tissue. At the same time, atrophy occurs in healthy ageing brains. These two competing effects raise an interesting possibility that the total iron content in deep brain nuclei may decrease. In this work, we investigate the evolution of total iron amount in deep gray matters of normal aging using quantitative susceptibility mapping (QSM). Surprisingly, instead of monotonously increasing, the iron content in globus pallidus (GP), substantia nigra (SN) and red nuclei (RN), where the iron concentration is the highest in human brain, appear to decrease after the iron content reaching a peak at around 48-58 years-old.METHOD
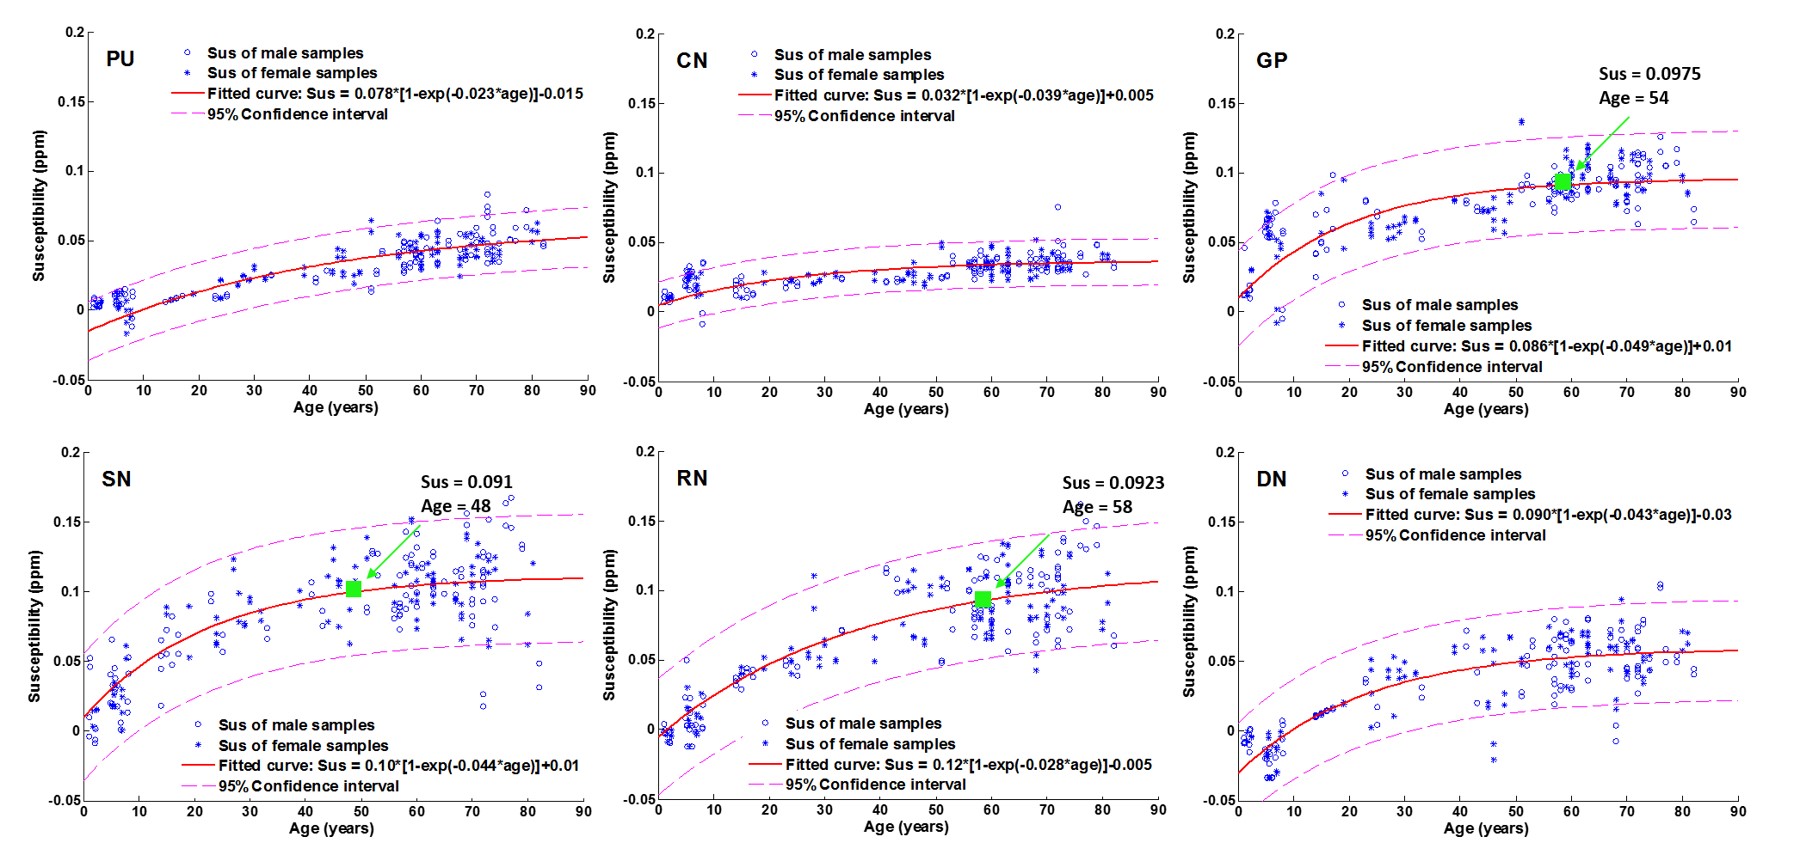
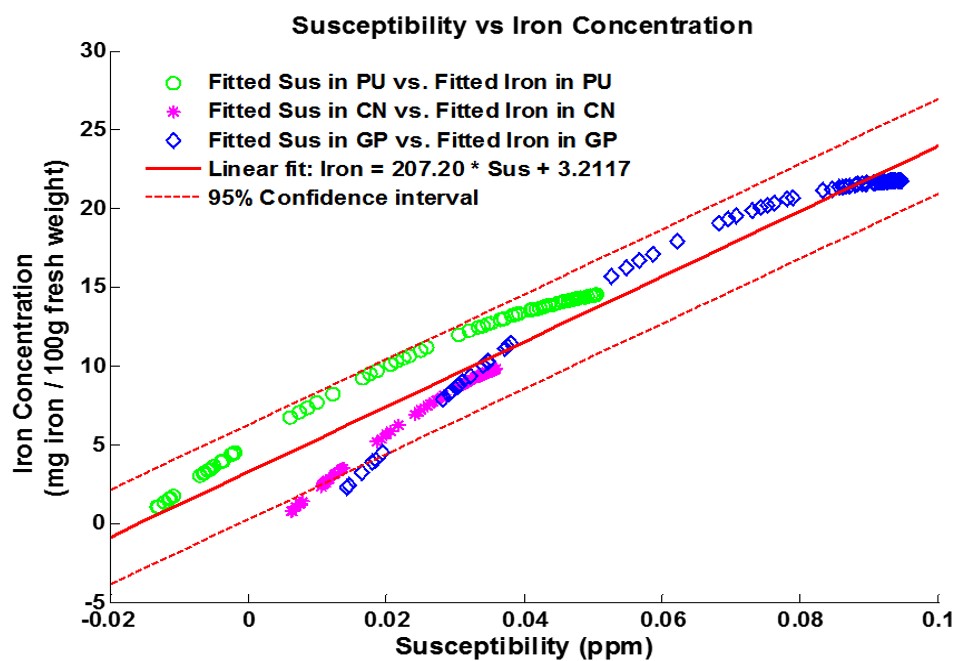
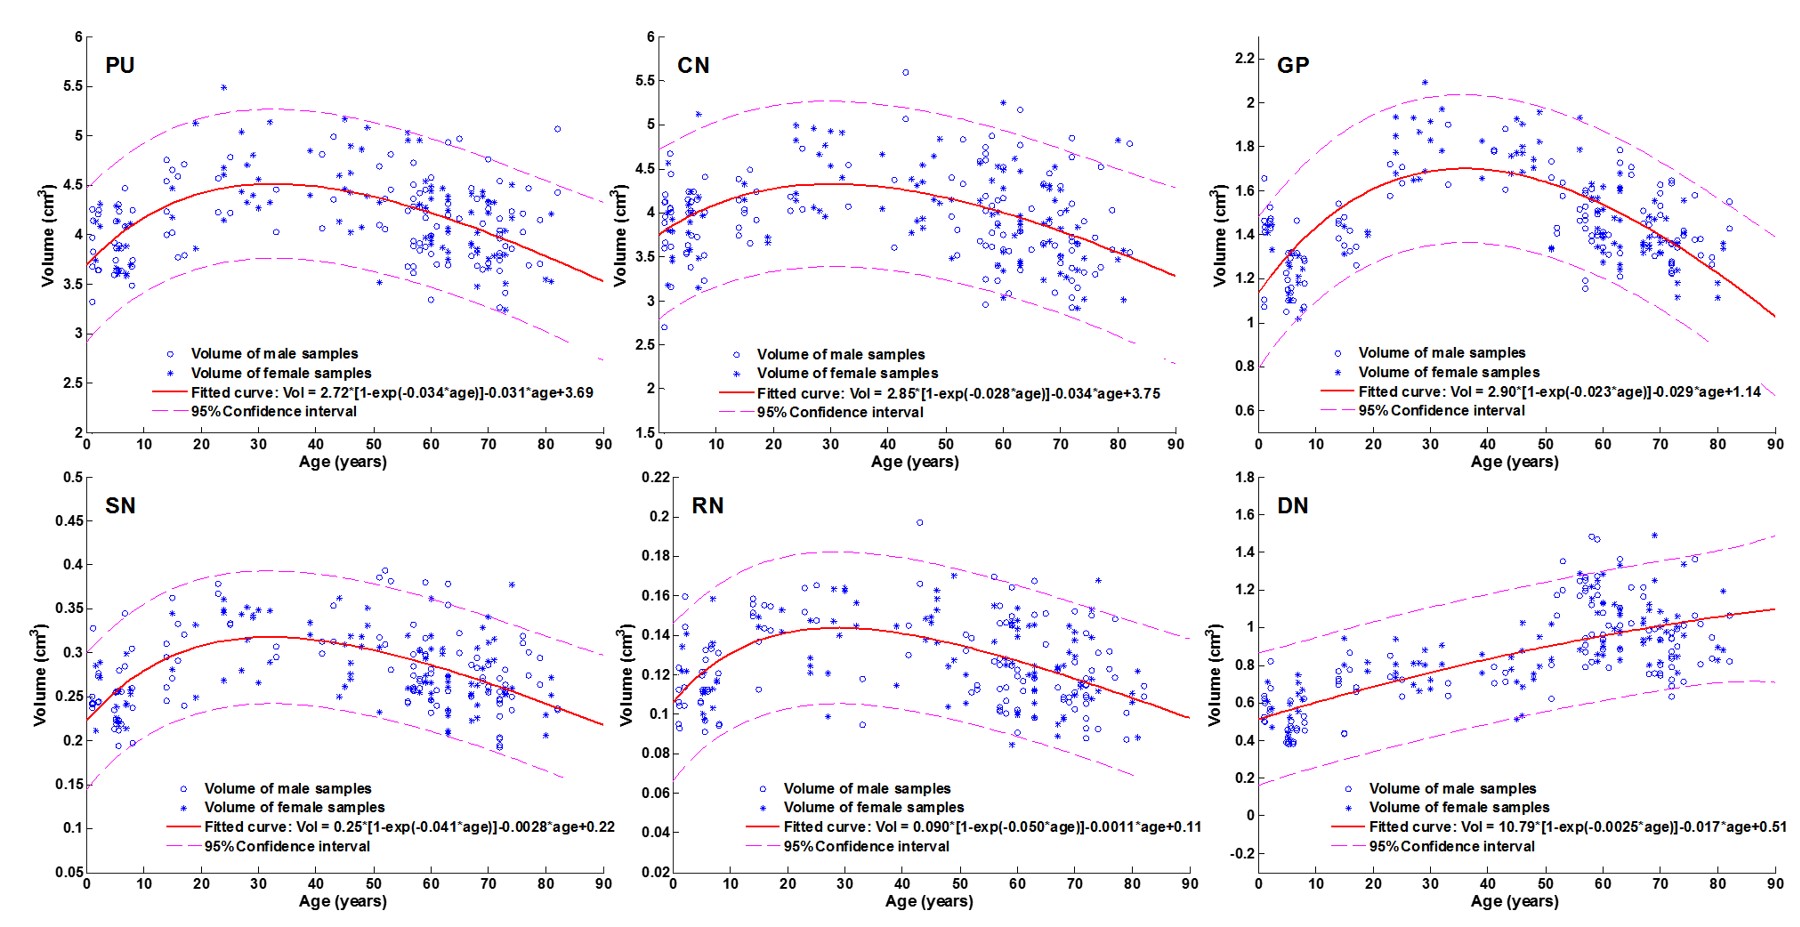
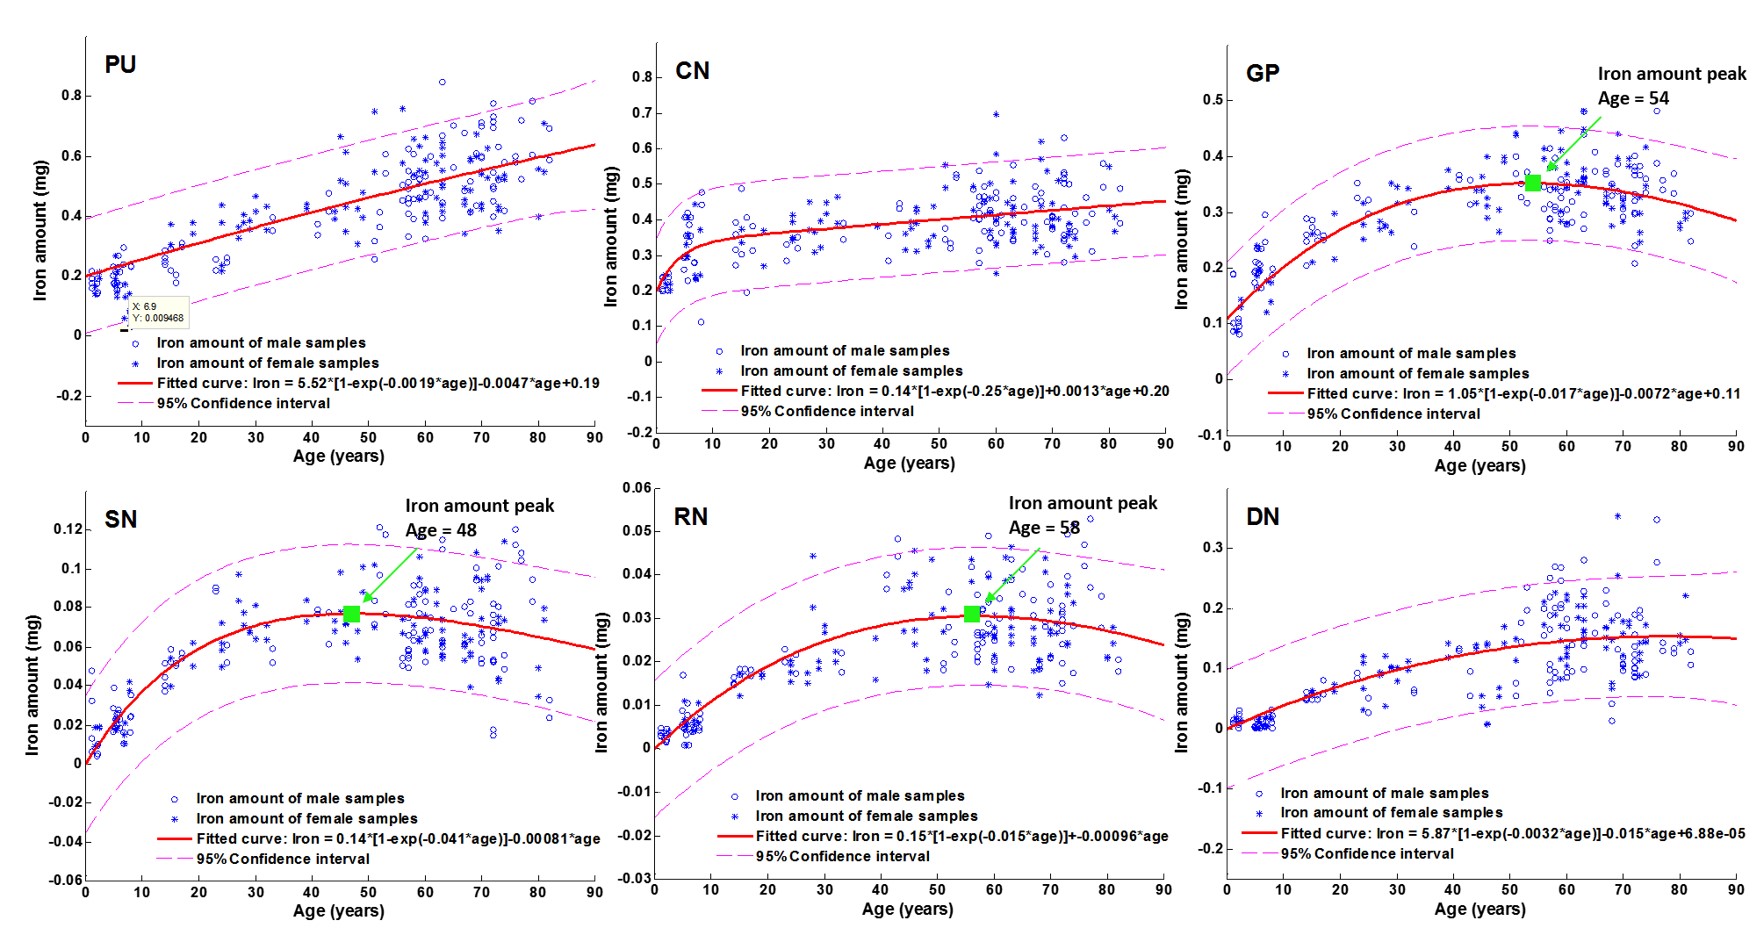
I) Material. A total of 152 subjects (83 F/69 M) within age 1-83 years-old were included. There are 8 subjects with age 1-2 years, 16 subjects with age 5-10 years, 15 subjects with age 10-20 years, 13 subjects with age 20-30 years, 10 subjects with age 30-40 years, 15 subjects with age 40-50 years, 25 subjects with age 50-60 years, 27 subjects with age 60-70 years, and 23 subjects with age 70-80 years, respectively. II) Correlating iron concentration with mean susceptibility. Fig. 1 shows the mean magnetic susceptibility as a function of age for six deep gray matters (putamen (PU), globus pallidus (GP), caudate nucleus (CN), substantia nigra (SN), red nuclei (RN) and dentate (DN)). The susceptibility evolutions are modelled as an exponential growth function of age. We correlate the susceptibility-age function and the iron concentration-age function from the histological study2 and generate a regression of the brain iron concentration as a function of mean susceptibility: $$Iron Concentration[mgIron/100gtissue] = 207.2[mgIron/100gtissue·ppm]×susceptibility[ppm]+3.21[mgIron/100gtissue] (Eq.1)$$ III) Estimating brain tissue volume evolution. The evolution of volume with aging for the six deep gray matter structures are measured based on the susceptibility maps (Fig.3). IV) Computing total iron amount. Knowing the average brain tissue density of 1.04 g/cm3 3 and tissue volume, mean susceptibility values are converted to the total iron amount:$$Iron Amount=IronConcentration[mgIron/100gtissue] ×Brain Density[mg/cm3]×Volume[cm3] (Eq.2)$$ The resulting total iron amount is then fitted as an function of age using the following equation:$$Iron Amount=A×age×exp(-age×B)+C×age+D (Eq.3)$$ where A, B, C and D are tissue-specific parameters.RESULTS
The mean susceptbility values (iron concenctration) of all selected deep gray matter regions increase exponentially and tend to plateaue after certain age as shown in Fig. 1. The volumes of these regions all appear to decrease after certain age except for DN as shown in Fig. 2. The total iron amount of the six ROIs as a result demonstrates distinctive patterns with aging. Specifically, in PU, CN and DN, the total iron amount increases monotonically as a function of age. However, in GP, SN and RN, the total iron contents reach their peaks at certain age followed by a gradual decrease. The total iron amount reaches a peak at 54 years-old, 48-years-old and 58-years-old for GP, SN and RN, respectively (Fig. 4). The mean susceptibility of these ROIs corresponding to each age point are 0.0975 ppm, 0.0910 ppm and 0.0923 ppm for GP, SN and RN, respectively, as shown in Fig. 1.DISCUSSION and CONCLUSION
Using longtitudinal QSM data over the lifespan, we have correlated the histologically estimated iron concentration (mg/100g tissue) of deep-brain nuclei as a function of the mean susceptibility (ppm). Combining with the measurements of brain nuclei volume, the variations of total iron amout with aging are measured. Interestingly, our results show that the total iron contents in GP, SN and RN show a declining trend after the iron content reaching peaks at around 48-58 years old. Therefore, the apparent iron concentration increase may be a reflection of atrophy. It possibility of total iron decreasing after certain age raise an interesting question of iron homeostasis at advanced age. This finding, if verified, seems to suggest that there is a net flow of iron out of these regions. This finding however may be biased by potential underestimates of volume or magnetic susceptibility. Therefore, histological examination of the total iron of the whole brain nucleus structure would be necessary to confirm the results.Acknowledgements
No acknowledgement found.References
1. Li W, Wu B, Batrachenko A, Bancroft-Wu V, Morey RA, Shashi V, Langkammer C, Bellis MD, Ropele S, Song AW, Liu C. Differential developmental trajectories of magnetic susceptibility in human brain gray and white matter over the lifespan. Human brain mapping. 2014 Jun 1;35(6):2698-713.
2. Hallgren B, Sourander P. The effect of age on the non-haemin iron in the human brain. Journal of neurochemistry. 1958 Oct 1;3(1):41-51.
3. Barber TE, Brockway JA, Higgins LS. The density of tissues in and about the head. Acta neurologica Scandinavica. 1970 Mar 1;46(1):85-92.
Figures