3648
Longitudinal Atlas Construction for Normative Human Brain Development and Aging over the Lifespan using Quantitative Susceptibility Mapping (QSM)Yuyao Zhang1, Hongjiang Wei1, Naying He2, Christian Langkammer 3, Stefan Ropele 3, Fuhua Yan2, and Chunlei Liu1
1University of California, Berkeley, berkeley, CA, United States, 2Department of Radiology, Ruijin Hospital, Shanghai Jiaotong University School of Medicine, People's Republic of China, 3Department of Neurology, Medical University of Graz, Graz, Austria
Synopsis
QSM is able to provide high contrast for iron-rich deep-brain nucleus. This is attributed to the sensitivity of magnetic susceptibility to the spatial variations of cellular components that exhibit different magnetic susceptibility properties, especially for brain iron and myelin. Although there have been atlases proposed for certain age groups, a longitudinal statistical atlas construction from general healthy population based on QSM is still lacking. We constructed longitudinal QSM atlases over the whole lifespan (from 1 to 83 years-old). One common QSM atlas is built for every 10-years interval to demonstrate the unique age-specific morphology and appearance of human brains.
INTRODUCTION
Quantitative susceptibility mapping (QSM) is able to provide high contrast for iron-rich deep-brain nucleus. This is attributed to the sensitivity of magnetic susceptibility to the spatial variations of molecular or cellular components that exhibit different magnetic susceptibility properties, especially for brain iron and myelin. Although there have been atlases proposed for certain age groups1, a longitudinal statistical atlas construction from general healthy population based on QSM is still lacking. In this work, we constructed longitudinal QSM atlases over the whole lifespan (from 1 to 83 years-old), aiming to achieve an improved characterization of normative human brain development and aging related to susceptibility changes. One common QSM atlas is built for every 10-years interval to demonstrate the unique age-specific morphology and appearance of human brains. This 4D longitudinal atlas provides an efficient tool for studying and analyzing iron deposition in deep-brain nucleus for different age intervals, as well as brain myelination and demyelination process for normal aging.METHOD
A total of 152 subjects (83 F/69 M) within age 1-83 years old were included. The 8 infant subjects (age 1-2) were scanned at the Brain Imaging & Analysis Center of Duke University on a MR750 3T scanner. The 14 toddlers (age 5-10) and 13 teenagers (age 10-20) subjects are collected at the Medical University of Graz, Austria using a Siemens TimTrio 3T scanner. The 45 younger (age 22-53) subjects and the 72 older (age 46-83) subjects were scanned at Department of Radiology, Ren Ji Hospital, Shanghai, China using a GE HDx 3T scanner. All the images were resampled to the same spatial resolution 1×1×1 mm3 through operation in k-space. Except for the infant subjects, the rest 144 subjects are separated into 8 age groups, for each group the age interval is 10 years (i.e., 10-20 years old, … 70-80 years old). A group-wise registration algorithm was conducted for each age interval to produce an age-specific anatomical template (Fig. 1). Then, a longitudinal registration is performed across different age intervals to generate the longitudinal common atlas space.RESULTS
Fig.2 shows the susceptibility evolution in white matter bundles, e.g., internal capsule (IC) and splenium of corpus callosum (SCC). For the youngest brain template (1 year), the susceptibility contrast between white matter and gray matter are apparently lower than that of the middle-age brain template (30-40 years), susceptibility in both IC and SCC becomes more diamagnetic as shown by the fitted curves in the bottom row of Fig. 2. Both white matter bundles of the old-age template (60-70 years) become relatively more paramagnetic comparing to those of the 30-40 year-old template. This result indicates that the brain white matter myelinates during brain maturation and then demyelinates with aging which is consistent with previous DTI studies on normal aging2. As shown in Fig.3, the susceptibility contrast between deep gray matter (e.g., putamen (PU), globus pallidus (GP) and caudate nucleus (CN)) and surroundings is relatively low in infant brain, which indicates less iron content stored in newborns3. The mean susceptibility value within each region shows an exponential growth with aging, which is supported by the classic histochemical studies4. For infants, toddlers and teenagers, the inner and outer GP can be well distinguished based on susceptibility differences. Anatomically, the inner and outer GP is physically separated by medial medullary lamina, which becomes thinner with human brain maturation resulting a blurring delineation between the two. The susceptibility inhomogeneity within PU in adult brains are also revealed by susceptibility images, and this gradient trend become more apparent with aging. This is consistent with previous findings that iron accumulation follows a precise direction from posterior to the anterior in PU.CONCLUSION
Serial longitudinal QSM atlases were constructed for every 10-years age interval based on group-wise registration across the whole human lifespan. The common susceptibility templates provided a standard coordinate system to conduct group analyses for QSM studies at various ages. These atlases also provided an efficient tool for segmenting brain structures at specific age, benefiting from the dramatic delineation between different brain tissues. The susceptibility templates also indicated common tissue structure variations at each age interval, which is a critical reference for investigating the brain gray and white matter development with aging.Acknowledgements
No acknowledgement found.References
1. Lim, I.A.L., Faria, A.V., Li, X., Hsu, J.T., Airan, R.D., Mori, S. and van Zijl, P.C., 2013. Human brain atlas for automated region of interest selection in quantitative susceptibility mapping: application to determine iron content in deep gray matter structures. Neuroimage, 82, pp.449-469. 2. Lebel C, Gee M, Camicioli R, Wieler M, Martin W, Beaulieu C. Diffusion tensor imaging of white matter tract evolution over the lifespan. Neuroimage. 2012 Mar 31; 60(1): 340-52. 3. Li W, Wu B, Batrachenko A, Bancroft-Wu V, Morey RA, Shashi V, Langkammer C, Bellis MD, Ropele S, Song AW, Liu C. Differential developmental trajectories of magnetic susceptibility in human brain gray and white matter over the lifespan. Human brain mapping. 2014 Jun 1;35(6):2698-713. 4. Hallgren B, Sourander P. The effect of age on the non-haemin iron in the human brain. Journal of neurochemistry. 1958 Oct 1;3(1):41-51.Figures
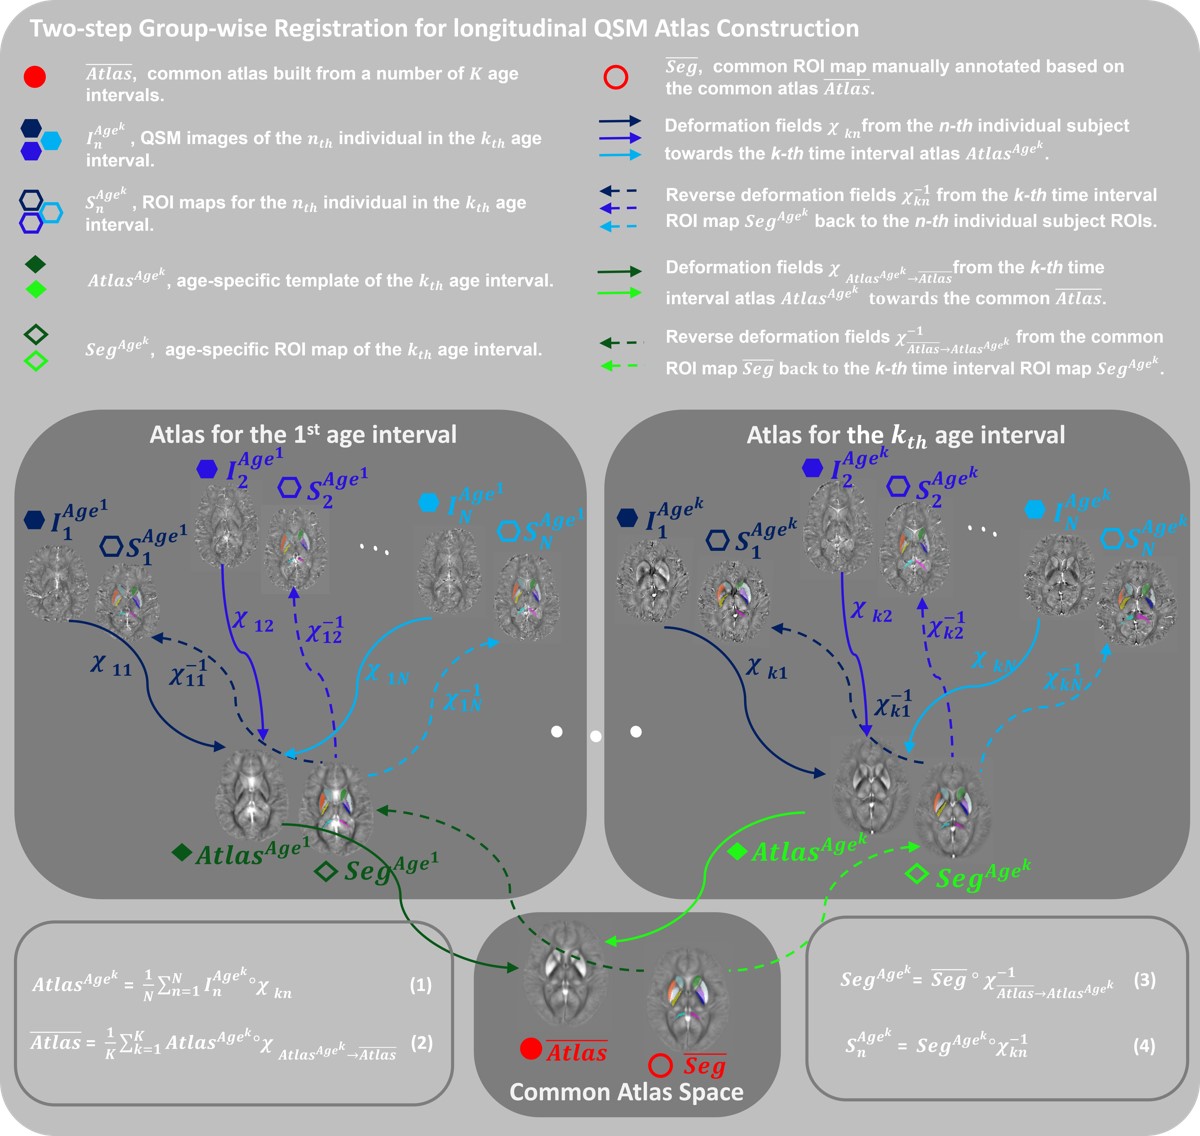
Fig.1. Outline
of the two-step group-wise registration for longitudinal QSM atlas
construction. For each age-interval,
individual susceptibility maps (blue hexagons) are combined as in Eq.(1) to
generate the age-specific susceptibility templates (green diamonds). A
longitudinal registration is performed following Eq.(2) to generate the
longitudinal atlas space. Based on the longitudinal atlas (the red circle), a
precise segmentation map of iron-rich deep gray nuclei is constructed, and is
warped back to each age-dependent QSM template spaces as shown in Eq.(3).
Finally, the ROIs in the individual subjects can be easily synthesized using
the reverse deformation fields as described in Eq.(4).
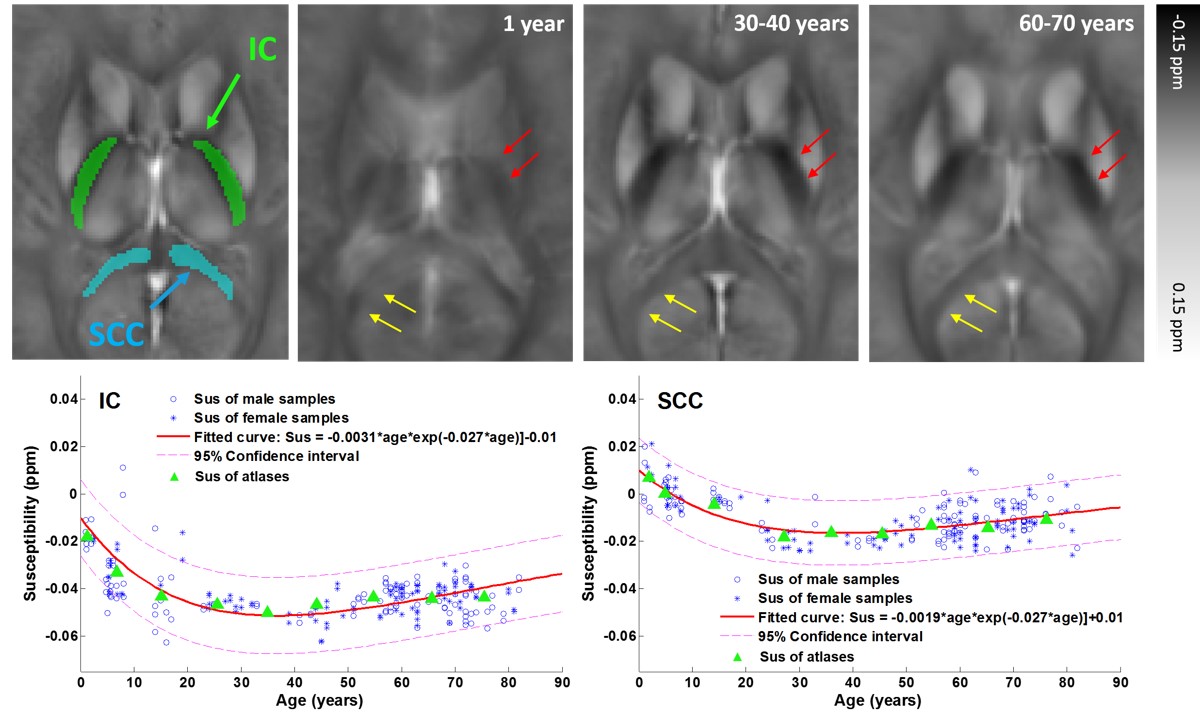
Fig.2.
Evolution of mean susceptibility with aging within selected white matter
bundles: internal capsule (IC) and splenium of corpus callosum (SCC). The morphology and gray-white matter contrast varying
with age are demonstrated by susceptibility images. Figures in the bottom row
show the fitting curves of the susceptibility in IC and SCC varying with aging,
following the Poisson growth pattern proposed in [2].
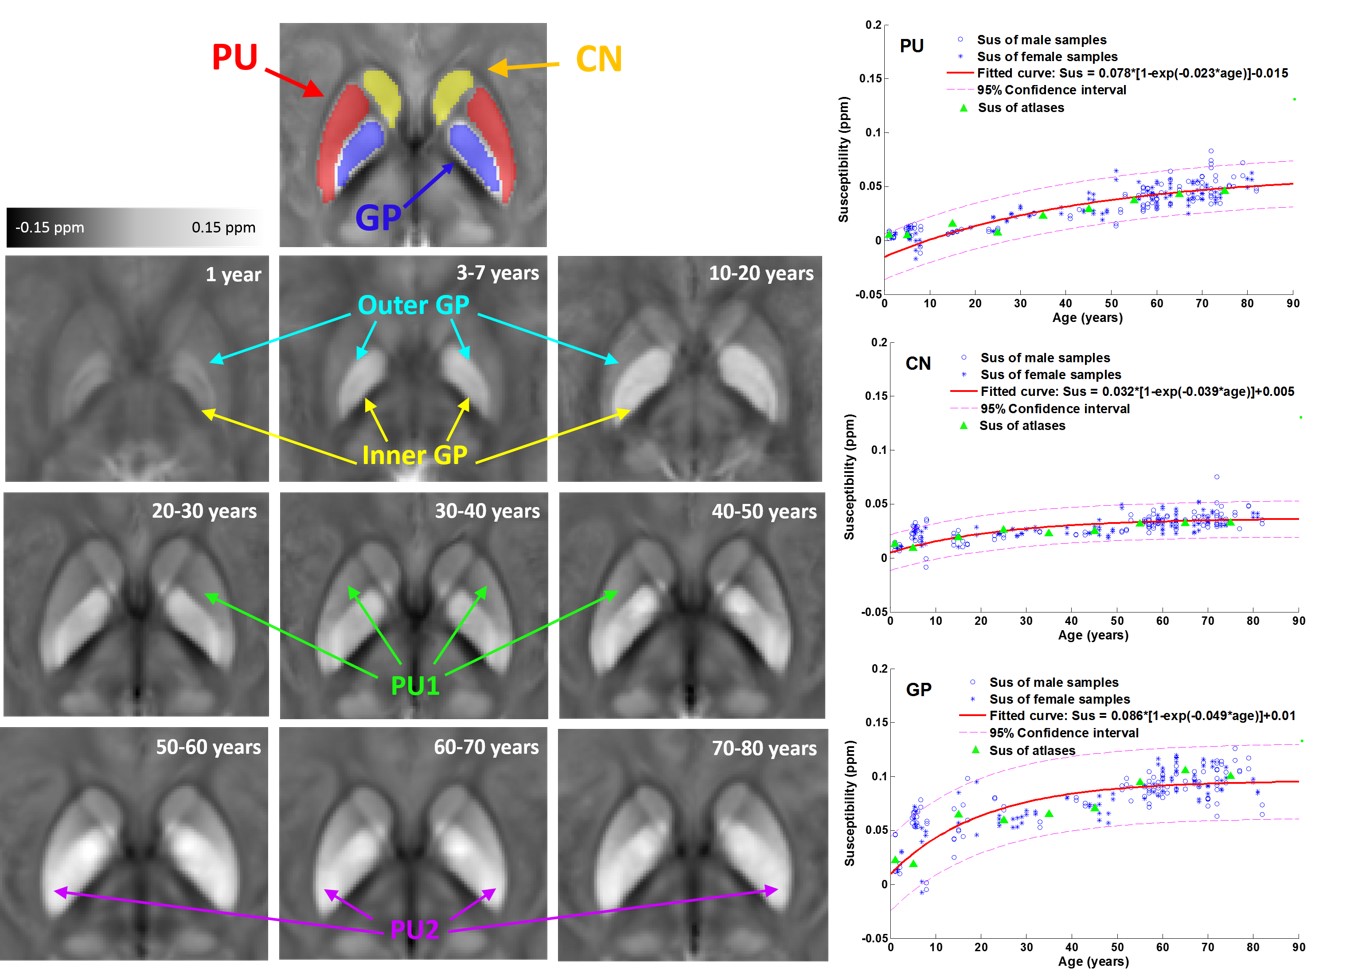
Fig.3. Evolution
of mean susceptibility with aging for the putamen (PU), globus pallidus (GP)
and caudate nucleus (CN). The magnetic
susceptibility of these deep gray matters significantly increase with age.
Moreover, the physical tissue structure changes and regional heterogeneity with
aging are revealed by magnetic susceptibility. Figures in the right column show
the fitting curves of the susceptibility in each ROIs varying with aging,
following the exponential growth pattern proposed in [3].