3645
In Vivo Mapping of Liver Tissue Damage using MR-based Conductivity Imaging Method1Kyung Hee University, Seoul, Korea, Republic of, 2Radiology, Chonnam National University Medical School, Gwangju, Korea, Republic of, 3Konkuk University, Seoul, Korea, Republic of
Synopsis
Liver tissues mainly consist of single cell, the variations of ion concentration and mobility inside the liver have similar pattern. This indicates that liver tissues can exhibit uniform distribution of electromagnetic tissue properties such as electrical conductivity. MREIT is typical method which can provide electrical conductivity information of suspicious tissue using a current-injection MRI method. Mapping of liver tissue damage using MREIT conductivity imaging may provide direct, immediate, and high sensitive information based on the changes of ion concentration and mobility at cellular levels. This study experimentally imaged in vivo liver tissue damage based on the changes of tissue conductivity.
Purpose: The purpose of this study is to show the clinical feasibility of MR-based conductivity imaging method which can provide new contrast information on liver tissue damage from animal cirrhosis models.
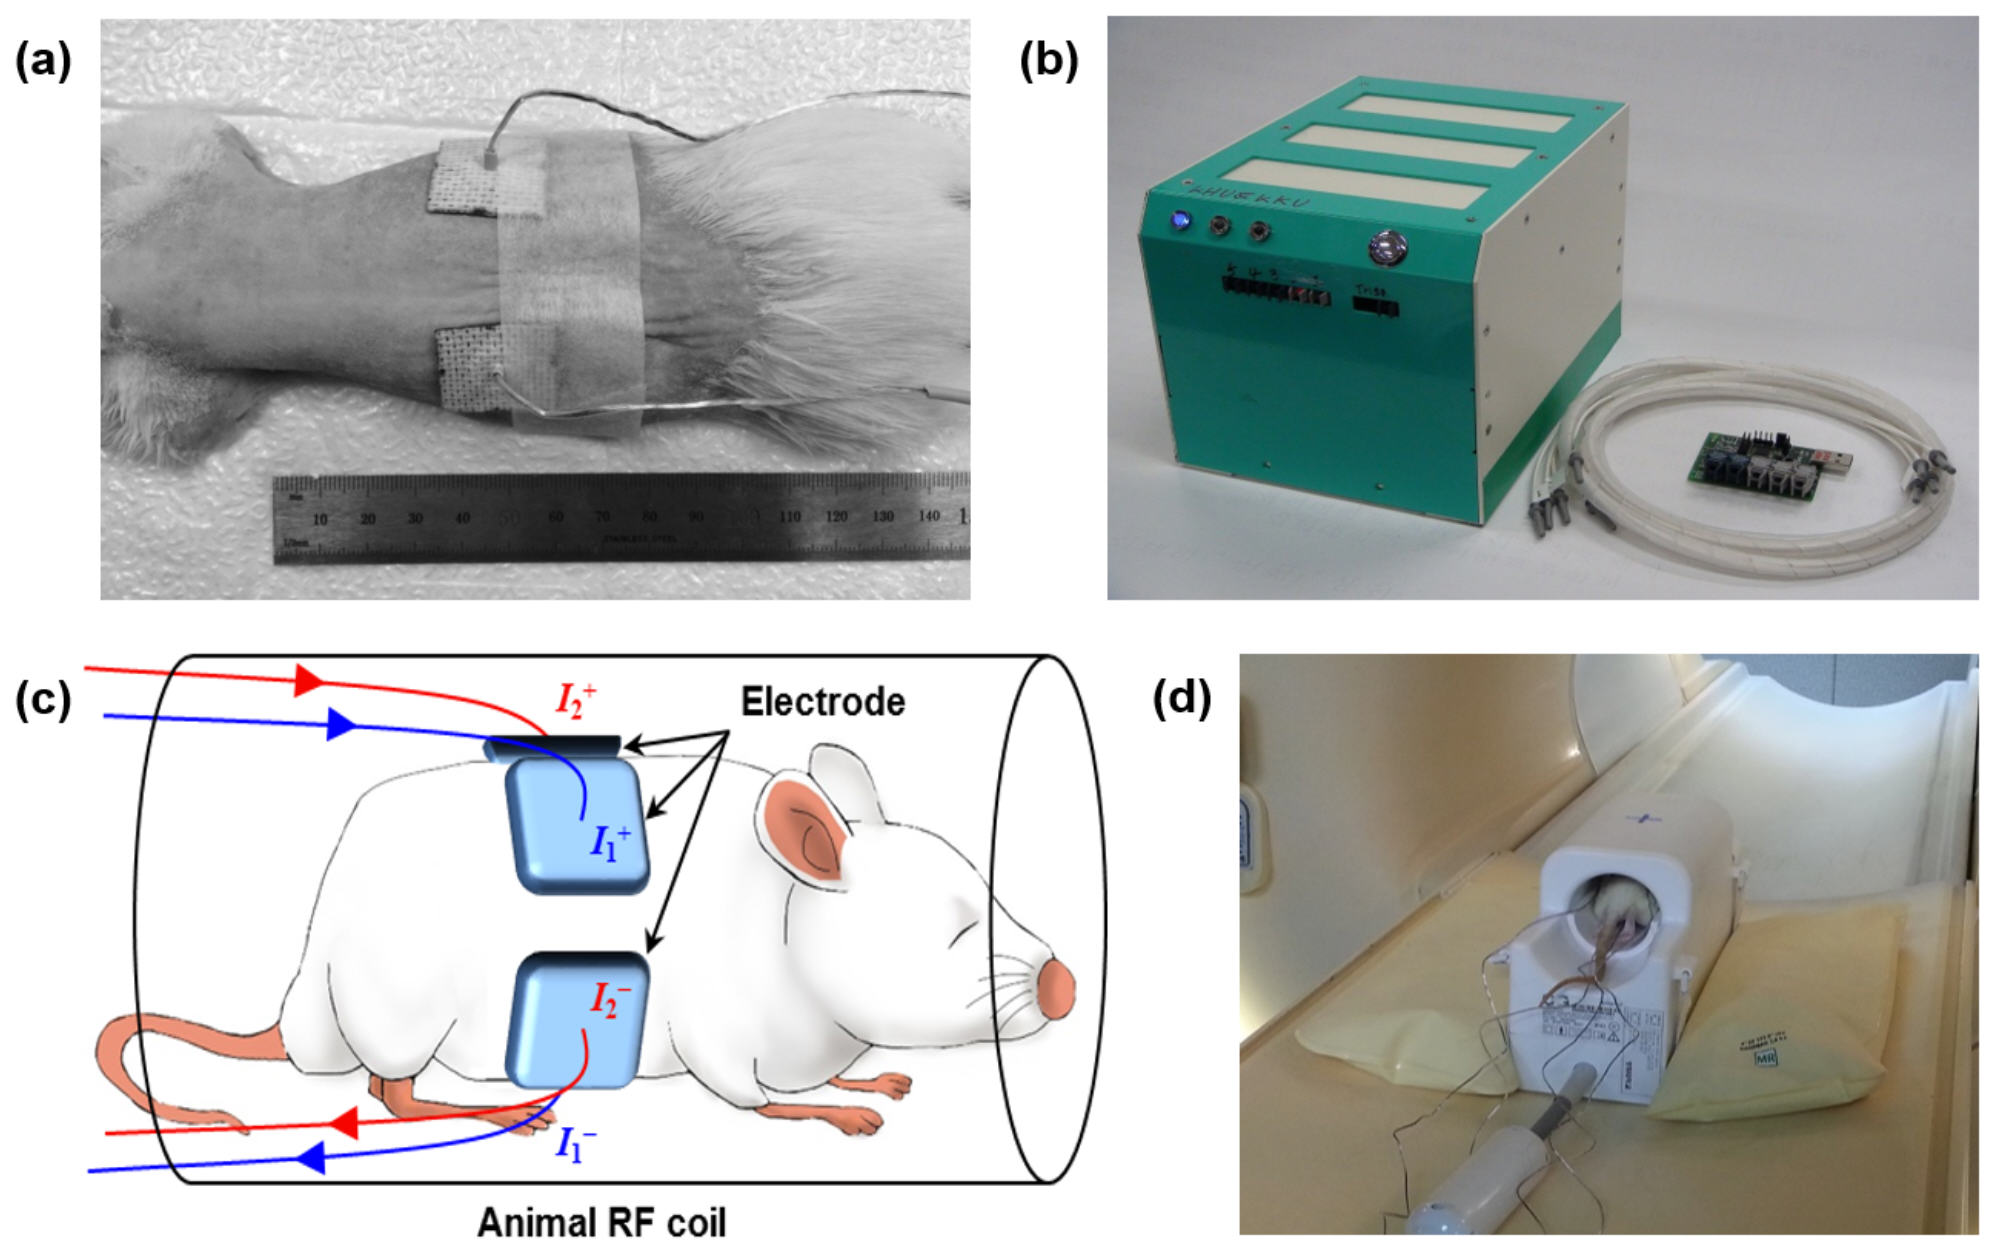
Methods: A total of 10 Sprague-Dawley rats (8 weeks old, weighing 260~280 g) were used for imaging experiment. All were healthy and without history of any known diseases. We anesthetized the rats with an intramuscular injection of 0.2 ml/kg Zolazepam (Zoletil 50, Virbac, France). Liver cirrhosis was induced by an intraperitoneal injection of dimethylnitrosamine (DMN) in dose of 1 ml per 100g body weight.1 After the induction, four carbon-hydrogel (HUREV Co. Ltd, Korea) were attached on the abdomen (Fig. 1a) and the rat was placed inside the bore of our 3T MRI scanner (Achieva TX, Philips Medical Systems, Netherlands) for the MREIT imaging experiment.2 The experimental protocol was approved by the Institutional Animal Care and Use Committee (IACUC). Inside the shield room, we began the general anesthesia with the use of 2% isoflurane mixed with oxygen at 800 ml/min flow rate. Using a current source (Fig. 1b), we injected a current of amplitude 1 mA and a pulse width of 81 ms (Fig. 1c and d). A multi-spin-echo ICNE pulse sequence was used to obtain the magnetic flux density (Bz) data. The imaging parameters were as follows: TR/TE = 1000/15 msec (5 echoes), FOV = 60×60 mm2, matrix size = 128×128, slice thickness = 3 mm, NEX = 4, and a total imaging time of 30 min. We used the single-step harmonic Bz algorithm implemented in CoReHA (conductivity reconstructor using harmonic algorithms) for multi-slice conductivity image reconstructions.3 All conductivity images should be interpreted as scaled conductivity images providing only contrast information. After the imaging experiment, we sacrificed the rats and obtained the liver tissue samples for the immunohistochemical examination to prove our model.
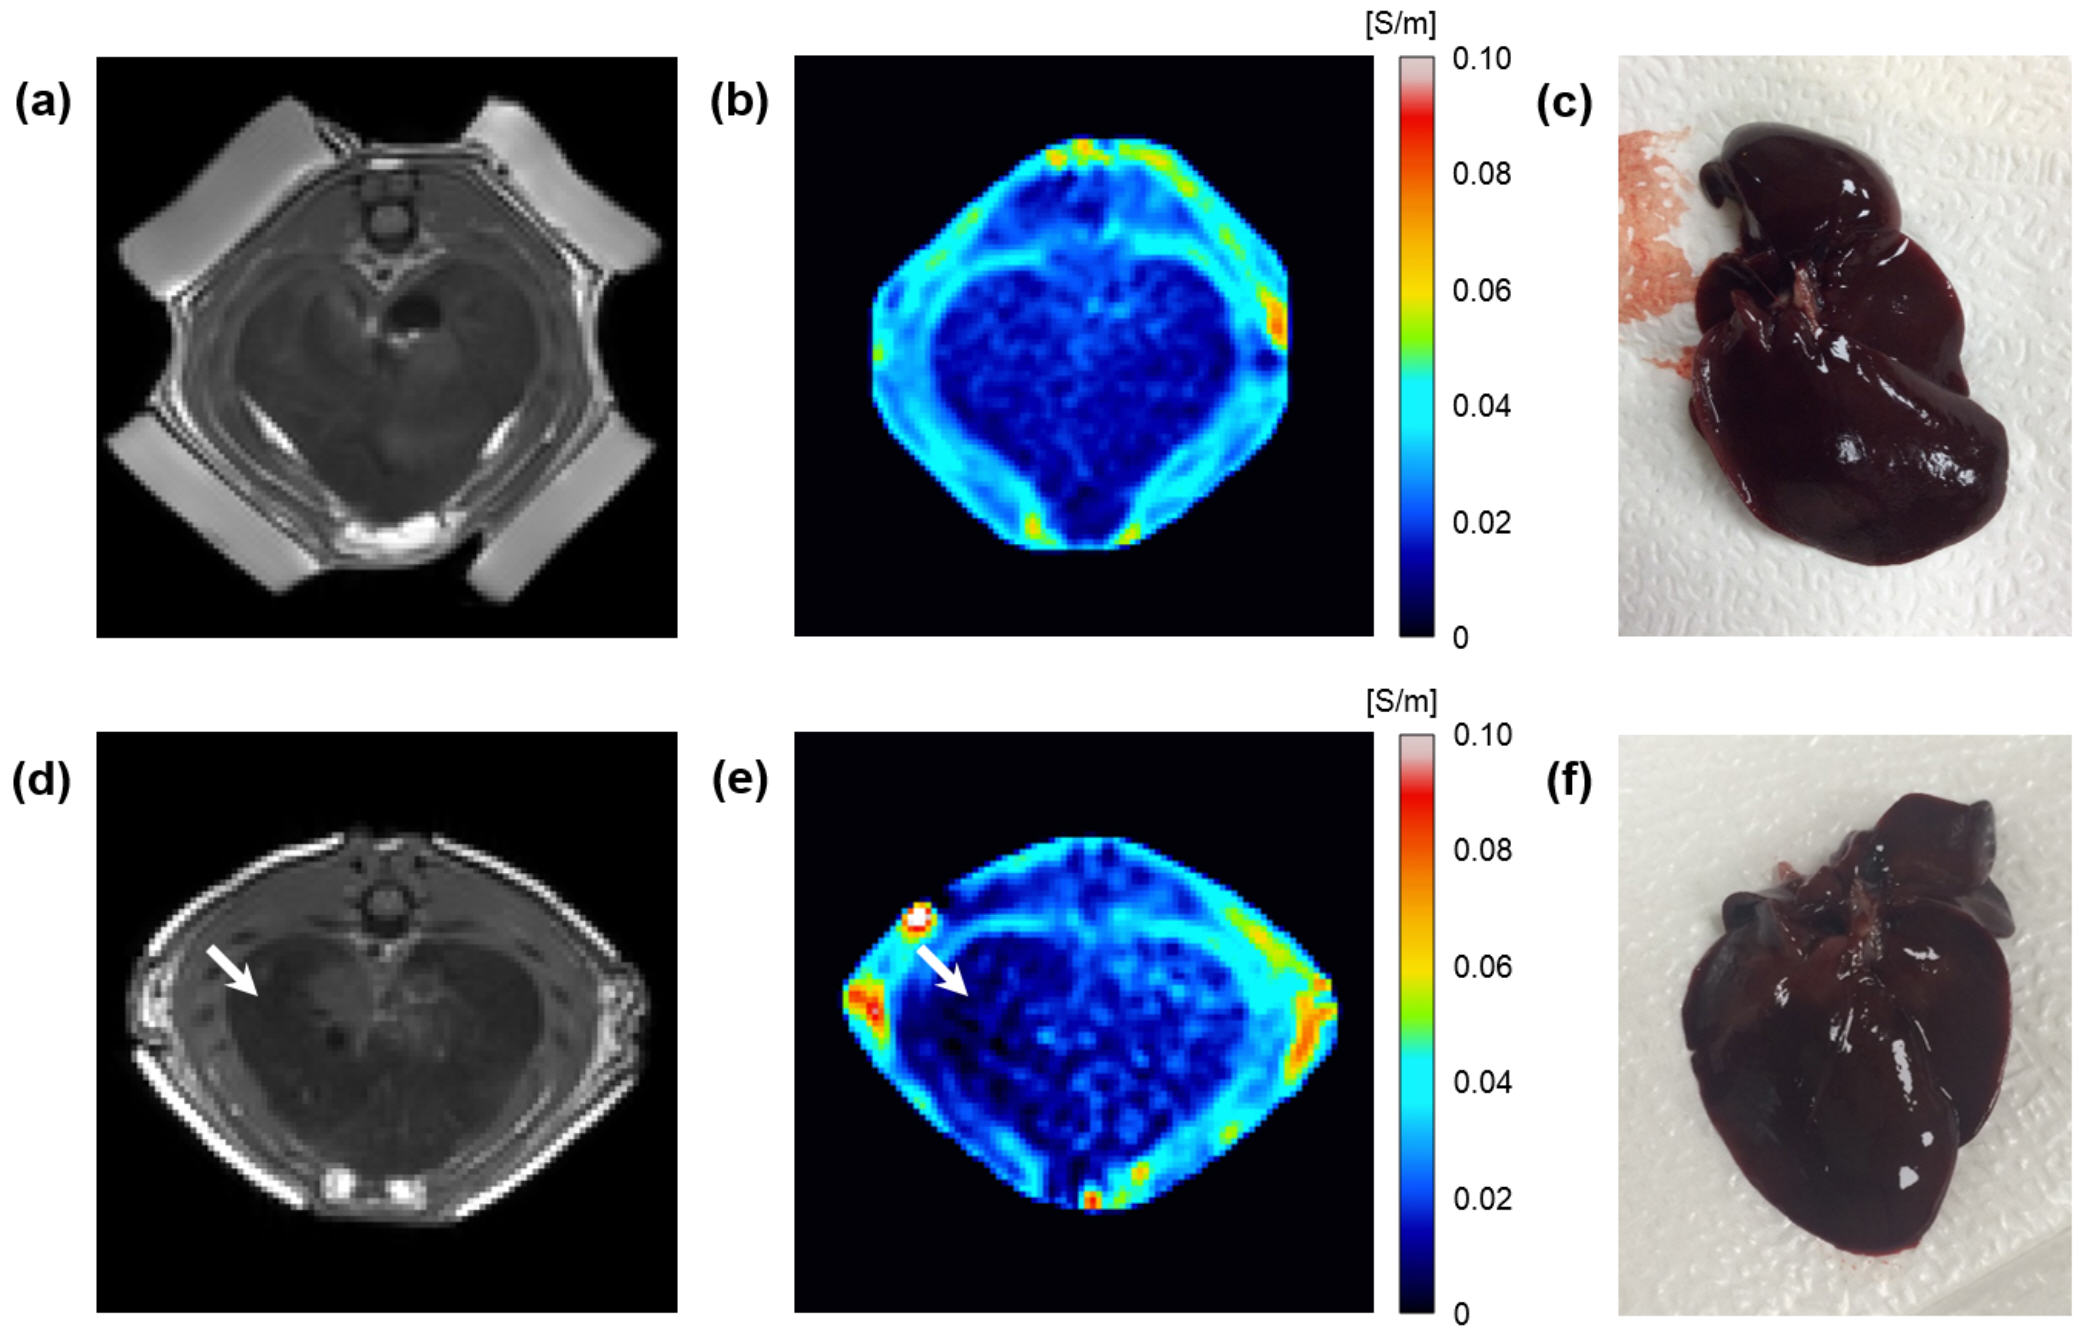
Results and Discussion: Figure 2 is resulting electrical conductivity images of in vivo liver obtained before (upper panel) and 6 weeks (lower panel) after the induction of cirrhosis. The MR magnitude images (Fig 2a and d) showed the morphological changes of liver tissue by the induction of cirrhosis. The reconstructed conductivity image of normal liver (before the induction, Fig 2b) showed homogeneous contrast in whole liver region. While the conductivity image from a 6 weeks induction in Fig. 2e, liver tissue showed decreased conductivity in the cirrhotic region comparing to the opposite normal region. Compared with the conventional MR image, the present MREIT conductivity images show variation of conductivity contrast pattern corresponding to the degree of malignancy of liver cirrhosis. The decreased conductivity in the cirrhotic liver originated from the fact that cirrhosis can be defined as a regenerative nodules which are surrounded by fibrous bands responding to chronic liver injury. In low-frequency conductivity, this tissue condition cause decreased conductivity than its actual value due to the insulation effect of fibrous membrane. During the cirrhosis, moreover, excess deposition of collagen, proteoglycans, and other macromolecules in the extracellular matrix affected on the decrease of tissue conductivity. The liver tissue samples (Fig 2c and f) represent tissue damages including color, stiffness, volume reduction between the normal and cirrhotic liver tissues.
Conclusion: To investigate any change of electrical conductivity due to liver cirrhosis, rat livers having a regional cirrhosis were scanned along with separate scans of rat livers having no disease. Conductivity images shown in this study indicated that time-course variations of conductivity contrast between normal and cirrhotic regions are distinguishable in a different way compared with conventional MR image techniques.
Acknowledgements
This work was supported by the National Research Foundation (NRF) of Korea grants (No. 2014R1A2A1A09006320, 2015R1A5A1037656, 2015R1D1A1A09058104, 2016R1A2B4014534).References
1. George J et al. Dimethylnitrosamine-induced liver injury in rats: the early deposition off collagen. Toxicology 2001;156:129-138.
2. Woo EJ et al. agnetic resonance electrical impedance tomography (MREIT) for high-resolution conductivity imaging. Physiol. v. 2008:29;R1-R26.
3. Oh TI et al. Feasibility of magnetic resonance electrical impedance tomography (MREIT) conductivity imaging to evaluate brain abscess lesion: In vivo canine model. J Magn. Reson. Imaging 2013;38:189-197.
Figures