3644
Current Density Measurements in the Brain using Magnetic Resonance Electrical Impedance Tomography in Healthy Volunteers1Biomedical Engineering, University of Florida, Gainesville, FL, United States, 2School of Biological and Health Systems Engineering, Arizona State University, Tempe, AZ, United States, 3University of Florida, Gainesville, FL, United States, 4Arizona State University, Tempe, AZ, United States, 5Radiology, Johns Hopkins University, Baltimore, MD, United States, 6Biochemistry and Molecular Biology, University of Florida, Gainesville, FL, United States
Synopsis
Characterizing current density distributions in the brain of healthy volunteers can provide important information to guide electrical stimulation therapies. Current-induced magnetic fields, produced as a result of electrical stimulation, can be mapped from phase changes in the MR imaging then current density can be computed using Maxwell’s equations. In this study, we present the first current density distribution induced magnetic field maps in healthy volunteers resulting from electrical stimulation using low frequency (10 Hz) transcranial alternating current simulation (tACS).
Introduction
Research on neuromodulation techniques, like transcranial electrical stimulation, is focused on understanding the mechanisms by which these techniques contribute to the improvement of attention, memory and other cognitive functions1. However, the exact brain regions affected by the injected current is unclear. In this study, we successfully reconstructed the first maps of current density distribution in human brains following tACS. Experimentally measured current-density induced, magnetic field maps and calculated current distributions from four healthy volunteers were compared with simulated current density induced magnetic field maps and current distributions produced using subject specific computational models.Methods
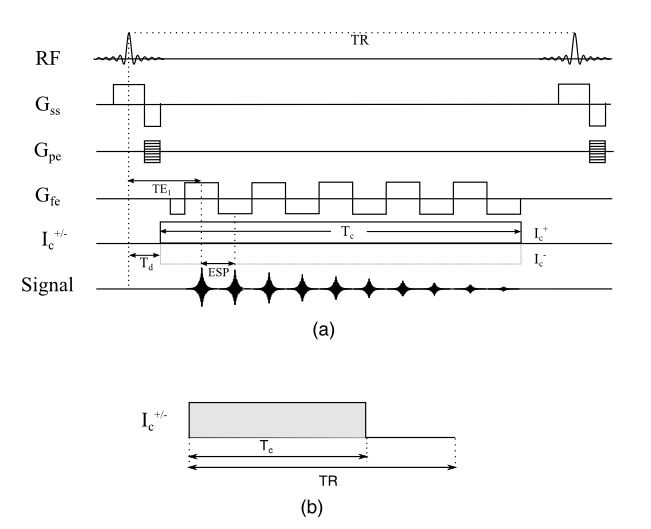
Participants: Healthy volunteers (n = 4, ages 18-30 years) were recruited and consented, did not have any history of seizures, were predominantly right handed, and were devoid of metallic implants. Stimulation: Alternating rectangular current pulses were applied with amplitude of 1.5 mA, duration of 32 ms, a 18 ms delay (100 ms period, effectively 10 Hz) at a duty cycle of 64%. The stimulation was delivered using two sets of electrode pairs placed at T3-T4 and Fpz-Oz locations following the 10-20 system of electrode placement. A battery powered constant current stimulator (NeuroConn DCMC - MR) was modified to produce current pulses in synchronization with MR excitation pulses from the MRI scanner. Imaging: Data acquisition was performed using a 32 channel head coil in a 3 T Philips Achieva System at the McKnight Brain Institute, University of Florida. High resolution T1 data was also acquired, registered to MREIT data, and segmented by tissue types. MREIT data were collected using a 2D spoiled multiple gradient echo sequence at three contiguous axial locations spanning 15 mm, centered on the electrodes. The entire k-space (100 x 100 points) was acquired for one slice before moving on to the next slice location. For each k-space phase-encode step, ten echoes were collected during the 32 ms current injection interval within a TR of 50 ms (Figure 1) then repeated twenty-four times. To overcome main field drift effects, current polarity was alternated every TR so that 12 positive and 12 negative current encoded datasets were collected for each phase encode step. The entire scan, with data acquisition of the three slice locations, was averaged twice to improve SNR. Raw data was exported and processed offline with software developed in-house to generate magnetic field maps. A no-current MREIT dataset was also collected to estimate T2* and optimize the current-induced magnetic field calculations2. Current density distributions were computed from the optimized magnetic field maps using a projected current density approach3. Subject specific computational models were created from the segmented T1 data using COMSOL 5.1, against which the imaging data were compared.Results
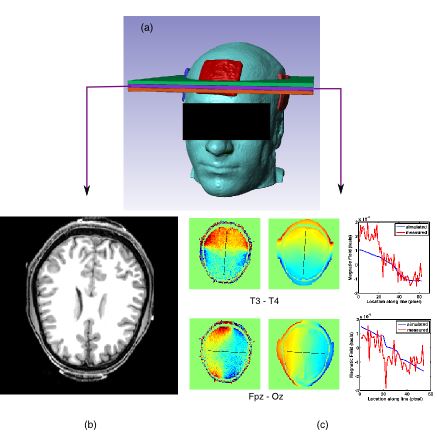
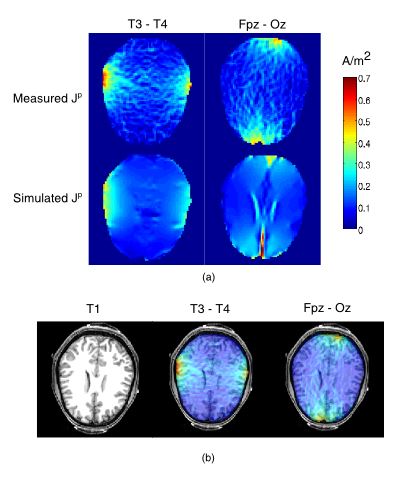
Figure 2 shows the 3D computational model built from high resolution T1 data along with the magnitude MREIT data and computed magnetic field maps for the center slice of one subject. Figure 3 shows the measured and simulated projected current density maps for both stimulation directions and the measured current density maps overlaid on the T1 data for the same subject. Similar results were obtained for all four subjects. Phosphene perceptions were consistent with those reported in tACS literature4 and no adverse events were reported by any subjectDiscussion
The magnetic field maps derived from the measured phase images showed good agreement with simulated data, where the induced magnetic field was perpendicular to the direction of injected current flow. Also the calculated current density maps were consistent with simulated data. The quality of derived magnetic field maps can be improved by more signal averaging possibly with faster parallel imaging techniques. Effect of blood flow from large arteries on reconstructed current densities is under study.Conclusion
This is the first reported measurement of current density distribution using tACS in the human brain. From these measurements, an understanding of the underlying brain regions affected by injected currents can be obtained and modeling techniques can be validated to guide treatment strategies.Acknowledgements
This work was funded by the grant NIH R21 NS081646. In addition, a portion of this work was performed in the Advanced MRI/S (AMRIS) Facility at the McKnight Brain Institute of the University of Florida, which is part of the National High Magnetic Field Laboratory (supported by National Science Foundation Cooperative Agreement DMR-1157490, the State of Florida, and the U.S. Department of Energy).References
1. Krause V, Meier A, Dinkelbach L, Pollok B. Beta Band Transcranial Alternating (tACS) and Direct Current Stimulation (tDCS) Applied After Initial Learning Facilitate Retrieval of a Motor Sequence. Front Behav Neurosci 2016;10:4.
2. Oh TI, Jeong WC, Kim JE, Sajib SZ, Kim HJ, Kwon OI, Woo EJ. Noise analysis in fast magnetic resonance electrical impedance tomography (MREIT) based on spoiled multi gradient echo (SPMGE) pulse sequence. Phys Med Biol 2014;59(16):4723-4738.
3. Park C, Lee BI, Kwon OI. Analysis of recoverable current from one component of magnetic flux density in MREIT and MRCDI. Phys Med Biol 2007;52(11):3001-3013.
4. Paulus W. On the difficulties of separating retinal from cortical origins of phosphenes when using transcranial alternating current stimulation (tACS). Clin Neurophysiol. Volume 121. Netherlands; 2010. p 987-991.
Figures