3639
Investigating the relation between electrical conduction and tissue composition with proton and sodium MRI1Center for Image Sciences, Center for Image Sciences, UMC Utrecht, Utrecht, Netherlands, 2Radiology, Gorter Center for High-field MRI, LUMC Leiden, Leiden, Netherlands
Synopsis
The focus of the presented work is to understand the relation between electrical conductivity and tissue composition in terms of 23Na concentration and water fraction. This would be relevant to evaluate the potential value of electrical conductivity imaging as a new endogenous biomarker and the validity of accessing conductivity from water content. For this purpose, MR-EPT and waterEPT conductivity reconstructions are performed and compared to network analyzer measurements. To evaluate whether conductivity is directly related to the total sodium concentration in free water, 23Na images are acquired at 7T and conductivity reconstruction are then performed using the Stogryn’s model.
Introduction
Information on tissue electrical conductivity has recently become available at the Larmor frequency with MR-Electrical Properties Tomography (standard MR-EPT: stdEPT)1,2. This information can potentially be used as a new endogenous biomarker in oncology or stroke. However, the accuracy of MR-EPT reconstructions is limited by several technical challenges. To circumvent these challenges, it has been suggested to reconstruct electrical conductivity from tissues water fraction (waterEPT: wEPT)3,4. To evaluate the potential value of electrical conductivity as a biomarker and the validity of accessing electrical conductivity through water content, it is relevant to understand the relation between electrical conductivity and tissue composition in terms of water fraction and sodium concentration, which is the focus of this work. MRI provides an ideal experimental platform to study this research question as both proton and sodium can be measured independently. In particular, we evaluate whether conductivity can be predicted from total sodium concentration or whether it is related to the sodium concentration in free water content. For this purpose, we perform and compare conductivity measurements using a network analyzer (VNA), stdEPT and wEPT at 3T, and 23Na measurements at 7T.Methods
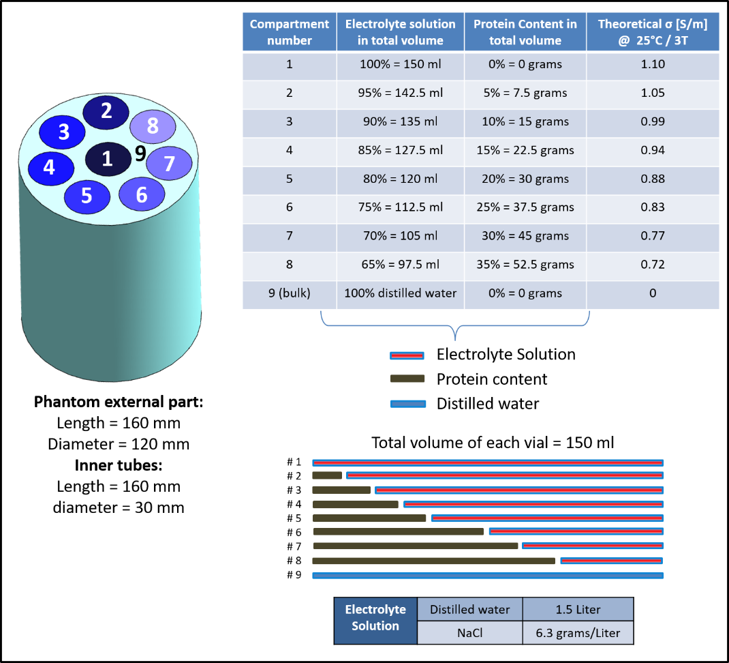
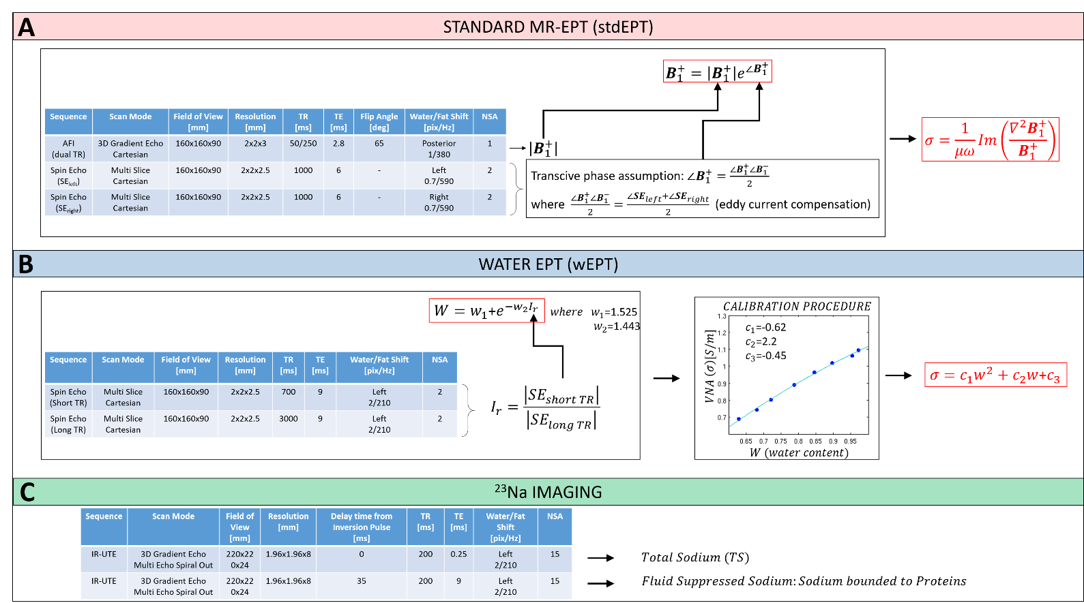
A multi-compartment phantom was prepared with different protein contents (IQ-Nutrition, Bumereal Inc, BE) to vary the fraction of saline solution (Figure 1). Conductivity measurements were performed using VNA (85070E, Agilent Technologies, CA). MR measurements at 3T (Ingenia, Philips, NL) were performed to reconstruct conductivity maps according to stdEPT2 and wEPT4 using the body coil in transmit and the 15ch head coil in receive mode (Figure 2, A and B). Comparisons between conductivity values are presented. Total and fluid suppressed 23Na measurements were conducted at 7T (Achieva, Philips, NL) (Figure 2, C) using a double tuned 1H/23Na birdcage coil5. Using Stogryn’s model6, conductivity reconstructions were obtained from measured and theoretical total sodium content.
wEPT aims to reconstruct conductivity from water content measurements using known conductivity values associated to known water contents as a reference. By following this principle, we weighted the theoretical total sodium concentration of the solution used to fill each phantom compartment with the measured water fraction of each compartment and then we applied the Stogryn’s model. In this way, we evaluated whether the obtained conductivity values are just a surrogate of total sodium conductivity reconstructions. Finally, we evaluated whether sodium-protein bindings affects samples conductivity. For this purpose, we compared the theoretical total sodium conductivity reconstruction with VNA and stdEPT conductivity reconstructions.
Results
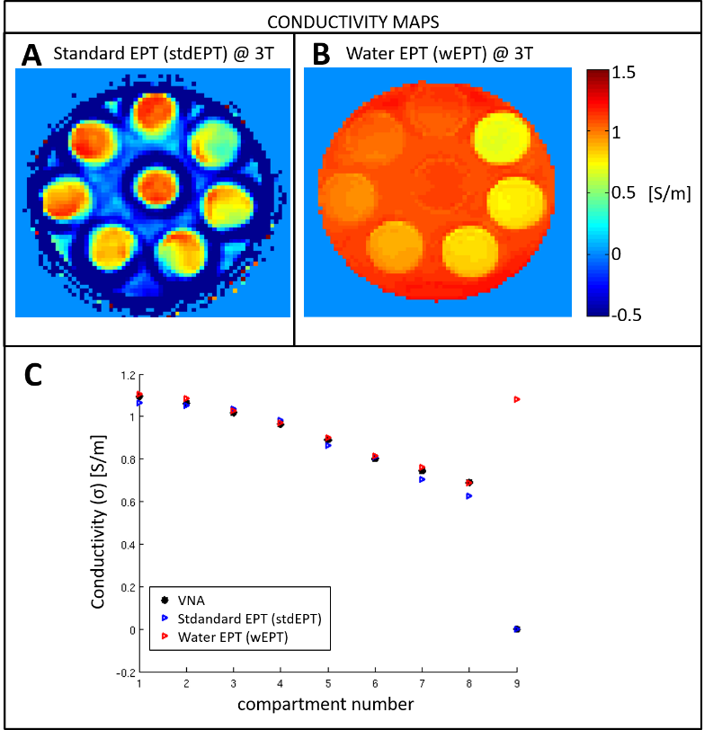
In Figure 3, we compare stdEPT, wEPT with respect to VNA values used as a benchmark. In Figure 3A, the impact of the boundary error propagation caused by the invalidity of the Helmholtz model for stdEPT is visible. Nevertheless, stdEPT conductivity values in homogeneous regions correspond to VNA values (Figure 3C). Figure 3B shows that wEPT reconstructions are not affected by boundary errors and are in good agreement with VNA values, used to compute the wEPT model parameters4. However, wEPT fails in the phantom background, where it assigns the same conductivity value as tube #1 (same water fraction but different 23Na concentrations). This is because wEPT assumes an univocal relation between the water content and the total amount of electrolytes in the solution. Thus, wEPT calibration based on VNA measurements4 is valid only for that precise electrolyte concentration. While this could work for healthy subjects, validity of wEPT for pathological circumstances where the sodium concentration may drastically change is uncertain.
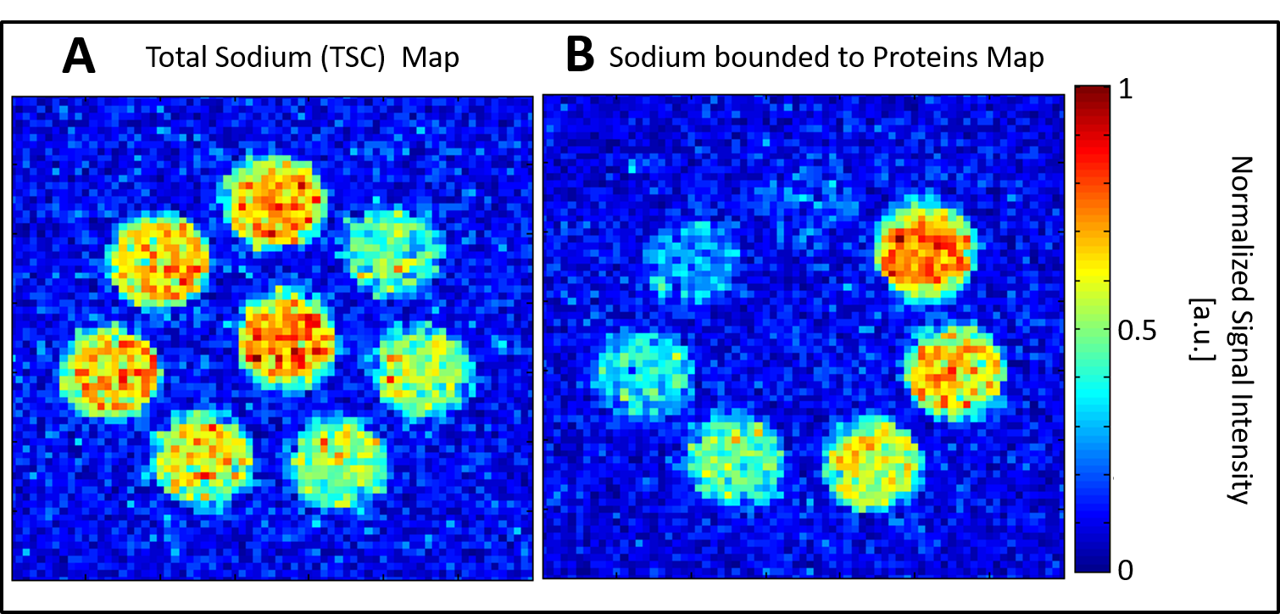
In Figure 4, total sodium and bounded sodium measurements normalized to their maximum value are shown. Quantification of the absolute concentration of bound sodium is not feasible yet. Nevertheless, the expected scaling of bound sodium with increasing protein content is visible.
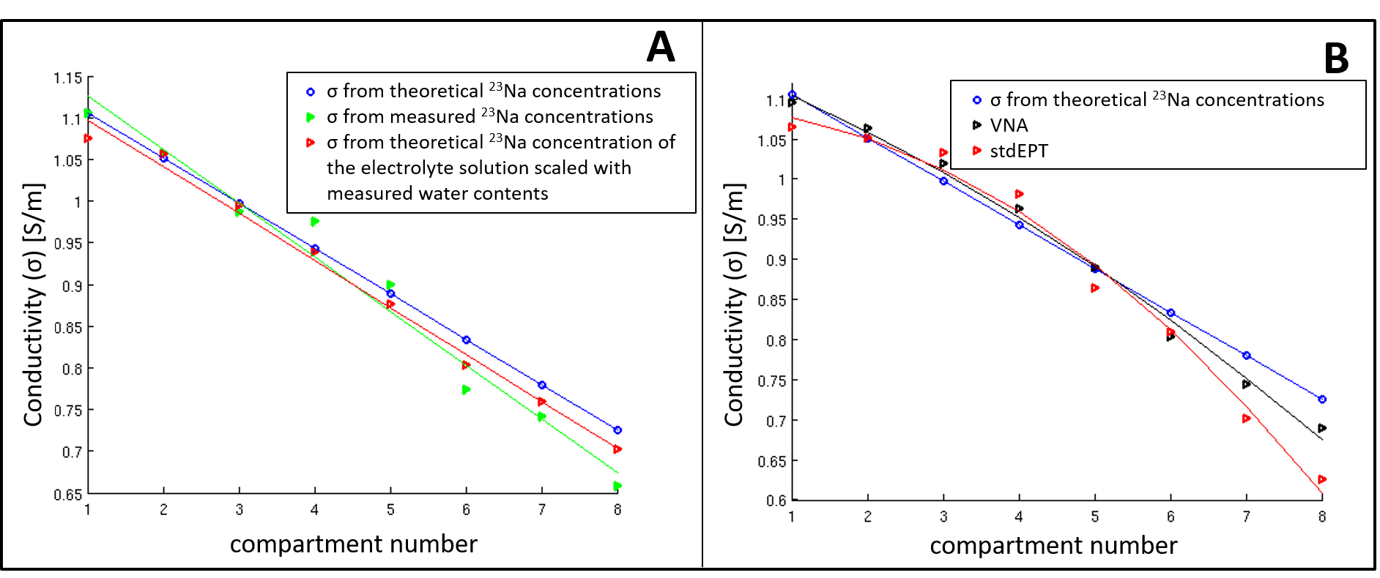
In Figure 5A, we show that conductivity reconstructions from total sodium measurements are feasible and reflect the theoretical total sodium conductivity reconstructions. Additionally, we observe that these reconstructions scale linearly with the electrolyte volume fraction. This linear scaling is also observed in conductivity reconstructions using the Stogryn’s model where the theoretical sodium concentration of free water was scaled with the measured water contents. In contrast, from Figure 5B, VNA and stdEPT measurements seems to show a quadratic dependence between conductivity and water fraction4.
Conclusion
These results suggest that tissue conductivity does not simply scale linearly with the total electrolyte concentration or water content but it is also modulated by the interaction between sodium and proteins resulting in a bound and free sodium pool that might have different ionic mobility. This is important information to understand the relationship between conductivity and bound/free sodium. This latter aspect will be further investigated.Acknowledgements
This work was supported by the DeNeCor project being part of the ENIAC Joint Undertaking.References
1) Katscher U, Voight T, Findeklee C, Vernickel P, Nehrke K, Dossel O, IEEE Trans Med Imaging 2009;28:1365-1374.
2) Van Lier A, Raaijmakers A, Voigt T, Lagendijk JJW, Luijten PR, Katscher U, van den Berg CAT, Magn Res Med 2014;71:354-363.
3) Schepps JL, Foster KR, Phys Med Biol 1980;25:1149-1159.
4) Michel E, Hernandez D, Lee SY, Magn Res Med 2016, early view.
5) de Bruin PW, Koken P, Maarten JV, Aussenhofer SA, Meulenbelt I, Bornert P, Webb AG, NMR in Biomed2015;28:1228-1235.
6) Stogryn A, IEEE TMTT 1971;19:733-736.
Figures