3638
Trait Specificity of Regional Cerebral Blood Flow between Different Resting-State Conditions1Dept. of Neurology, University of Pennsylvania, Philadelphia, PA, United States, 2Dept. of Psychiatry, University of Pennsylvania, Philadelphia, PA, United States
Synopsis
We used latent state-trait theory to examine trait specificity of regional cerebral blood flow (CBF) acquired using arterial spin labeled (ASL) perfusion MRI in four different resting-state conditions (eyes-open, eyes-closed, fixation, and a low-level attention task (psychomotor vigilance task, PVT)). Most brain regions accepted the latent state-trait model. Fixation exhibited the lowest latent trait specificity, while PVT, eyes-open, and eyes-closed showed progressively higher trait specificity. We confirmed that ASL CBF shows trait-like properties, which are optimally fit using eyes-open or eyes-closed conditions.
PURPOSE
Arterial spin labeled (ASL) perfusion MRI can reliably quantify region cerebral blood flow (CBF), and hence map regional brain function based on the tight coupling between regional CBF and neural activity1,2. A key feature of ASL MRI is its white noise properties3, which provides sensitivity to state (low frequency) and trait (zero frequency) effects in regional brain function. While ASL MRI has been successfully used to identify trait-like properties of regional brain function4,5, the optimal experimental condition for detecting trait-effects remains unknown.
Latent state-trait theory (LST) has been applied in various domains, especially psychology6. LST decomposes observable variables into the sum of latent trait variables (personal attributes), state residuals (person-situation interaction) and measurement errors6. A previous study using 1.5T ASL data demonstrated that the mean CBF of various brain regions of interest accepted the LST model7.
In this study, we aimed to compare the trait specificity of ASL MRI data acquired using varying resting conditions: fixation, eyes-open, eyes-closed, and a low level attention task (psychomotor vigilance task, PVT).
METHODS
24 subjects (14 female, age = 29.0 ± 5.2 years) consented to the study and completed two sessions spanning a mean of 7 days, conducted at the same time of day for each subject, using either a Siemens Trio and 32-channel array (N=14) or a Siemens Prisma and 64 channel array (N=10). The scanning protocol included 1mm isotropic T1-MPRAGE, TOF angiography to guide labeling plane selection, and four 8-minute ASL scans obtained with ‘eyes-open’, ‘eyes-closed’, ‘fixation’, and ‘PVT’ carried out in pseudorandomized order across subjects and sessions. A single-shot, background-suppressed pseudocontinuous ASL (pCASL) sequence using an accelerated 3D RARE Stack-Of-Spirals readout8 was employed to collect whole-brain perfusion maps at 3.75mm isotropic resolution. An M0 image with no ASL preparation and long TR was collected at the middle and end of the sessions. Raw ASL images were realigned and registered to the anatomical dataset using FSL9 and custom scripts in Matlab. Subtracted pairs were converted into CBF units following the one-compartment model10.
LST models were implemented with R toolbox “lsttheory”6 and “lavaan”11. For LST modeling, the 8-minute ASL scan for each condition was divided in two and the mean CBF maps were calculated for each half. Both ROI-based (Table 1) and whole brain voxel-based LST models (Fig. 1a) were estimated. A restrictive LST model7 equating the measurement error variance, state residual variance, and effects of trait and states in the model was used. Trait specificity was calculated for each model using the following equation6:
Trait Specificity = Variance of Trait / Variance of CBF
A single grouped LST model (Fig. 1b) was additionally used to compare the trait effects between the four conditions, combining the CBF measurements of the four conditions as four groups and more stringently restricting the model to have equal measurement error variance and equal state residual variance between the groups. An LST model was only accepted when the estimated model parameters were statistically significant (α = 0.05) and the discrepancy between the model and the data (assessed by Chi-square test) was not significant (α = 0.05)7.
RESULTS
The restrictive LST model accepted most ROIs for the each of the conditions (Fig. 2). Trait specificities of regional CBF were mostly larger than 0.7 for all conditions. Eyes-closed yielded the highest trait specificity (range 0.77 - 0.87), while fixation showed the lowest trait specificity (range 0.56 – 0.81). Voxel-wise estimation of the LST model demonstrated that most brain voxels also accepted the restrictive LST model (Fig. 3). Fixation showed distinctly lower trait specificity than the other conditions. All ROIs accepted the single grouped LST model (Fig. 4). In the single grouped model, the estimated trait specificity for fixation was again lower than other conditions for most of the ROIs. Compared to the separated model (Fig. 2), the differences between fixation and other conditions were reduced, likely due to assuming equal state residual variance across all conditions in the single grouped model.DISCUSSION AND CONCLUSION
These results confirm ASL CBF as a measure of physiological trait effects in brain function, and provide a reference for choosing optimal conditions for future studies. The four conditions showed somewhat different trait specificities, suggesting an impact of resting state “task” on LST modelling. Fixation showed the lowest trait specificity, suggesting that the fixation is more vulnerable to situation/person-situation effects than the other three conditions. Fixation also showed the highest within-subject coefficients of variation and the lowest intra-class correlation coefficients in prior analysis of a subset of these data8.Acknowledgements
This study was supported by NIH grants MH080729 and EB015893.References
1 Detre, J. A., Wang, J., Wang, Z. & Rao, H. Arterial spin-labeled perfusion MRI in basic and clinical neuroscience. Curr Opin Neurol 22, 348-355, doi:10.1097/WCO.0b013e32832d9505 (2009).
2 Chen, Y., Wang, D. J. & Detre, J. A. Test-retest reliability of arterial spin labeling with common labeling strategies. J Magn Reson Imaging 33, 940-949, doi:10.1002/jmri.22345 (2011).
3 Aguirre, G., Detre, J., Zarahn, E. & Alsop, D. Experimental design and the relative sensitivity of BOLD and perfusion fMRI. Neuroimage 15, 488-500 (2002).
4 Rao, H. et al. Genetic variation in serotonin transporter alters resting brain function in healthy individuals. Biological psychiatry 62, 600-606 (2007).
5 Kaczkurkin, A. N. et al. Elevated Amygdala Perfusion Mediates Developmental Sex Differences in Trait Anxiety. Biological psychiatry (2016).
6 Steyer, R., Mayer, A., Geiser, C. & Cole, D. A. A theory of states and traits--revised. Annu Rev Clin Psychol 11, 71-98, doi:10.1146/annurev-clinpsy-032813-153719 (2015).
7 Hermes, M. et al. Latent state-trait structure of cerebral blood flow in a resting state. Biol Psychol 80, 196-202, doi:10.1016/j.biopsycho.2008.09.003 (2009).
8 Vidorreta, M., Wang, Z., Chang, Y. V., Fernández-Seara, M. A. & Detre, J. A. Single-Shot Whole-Brain Background-Suppressed PCASL MRI with 1D Accelerated 3D RARE Stack-OfSpirals Readout. ISMRM Conference Proceedings (2015).
9 Jenkinson, M., Beckmann, C. F., Behrens, T. E., Woolrich, M. W. & Smith, S. M. FSL. Neuroimage 62, 782-790, doi:10.1016/j.neuroimage.2011.09.015 (2012).
10 Detre, J. A., Leigh, J. S., Williams, D. S. & Koretsky, A. P. Perfusion imaging. Magnetic resonance in medicine 23, 37-45 (1992).
11 Rosseel, Y. lavaan: An R package for structural equation modeling. Journal of Statistical Software 48, 1-36 (2012).
Figures
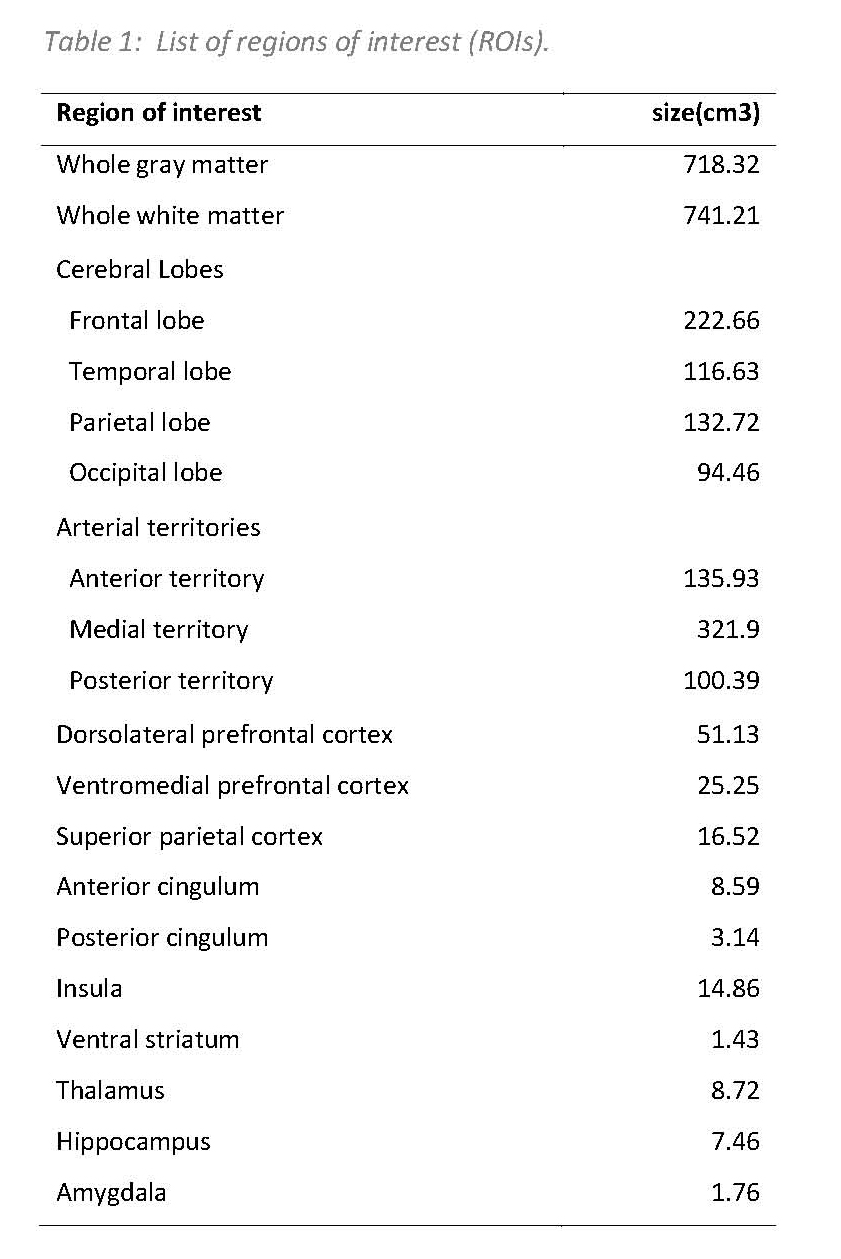
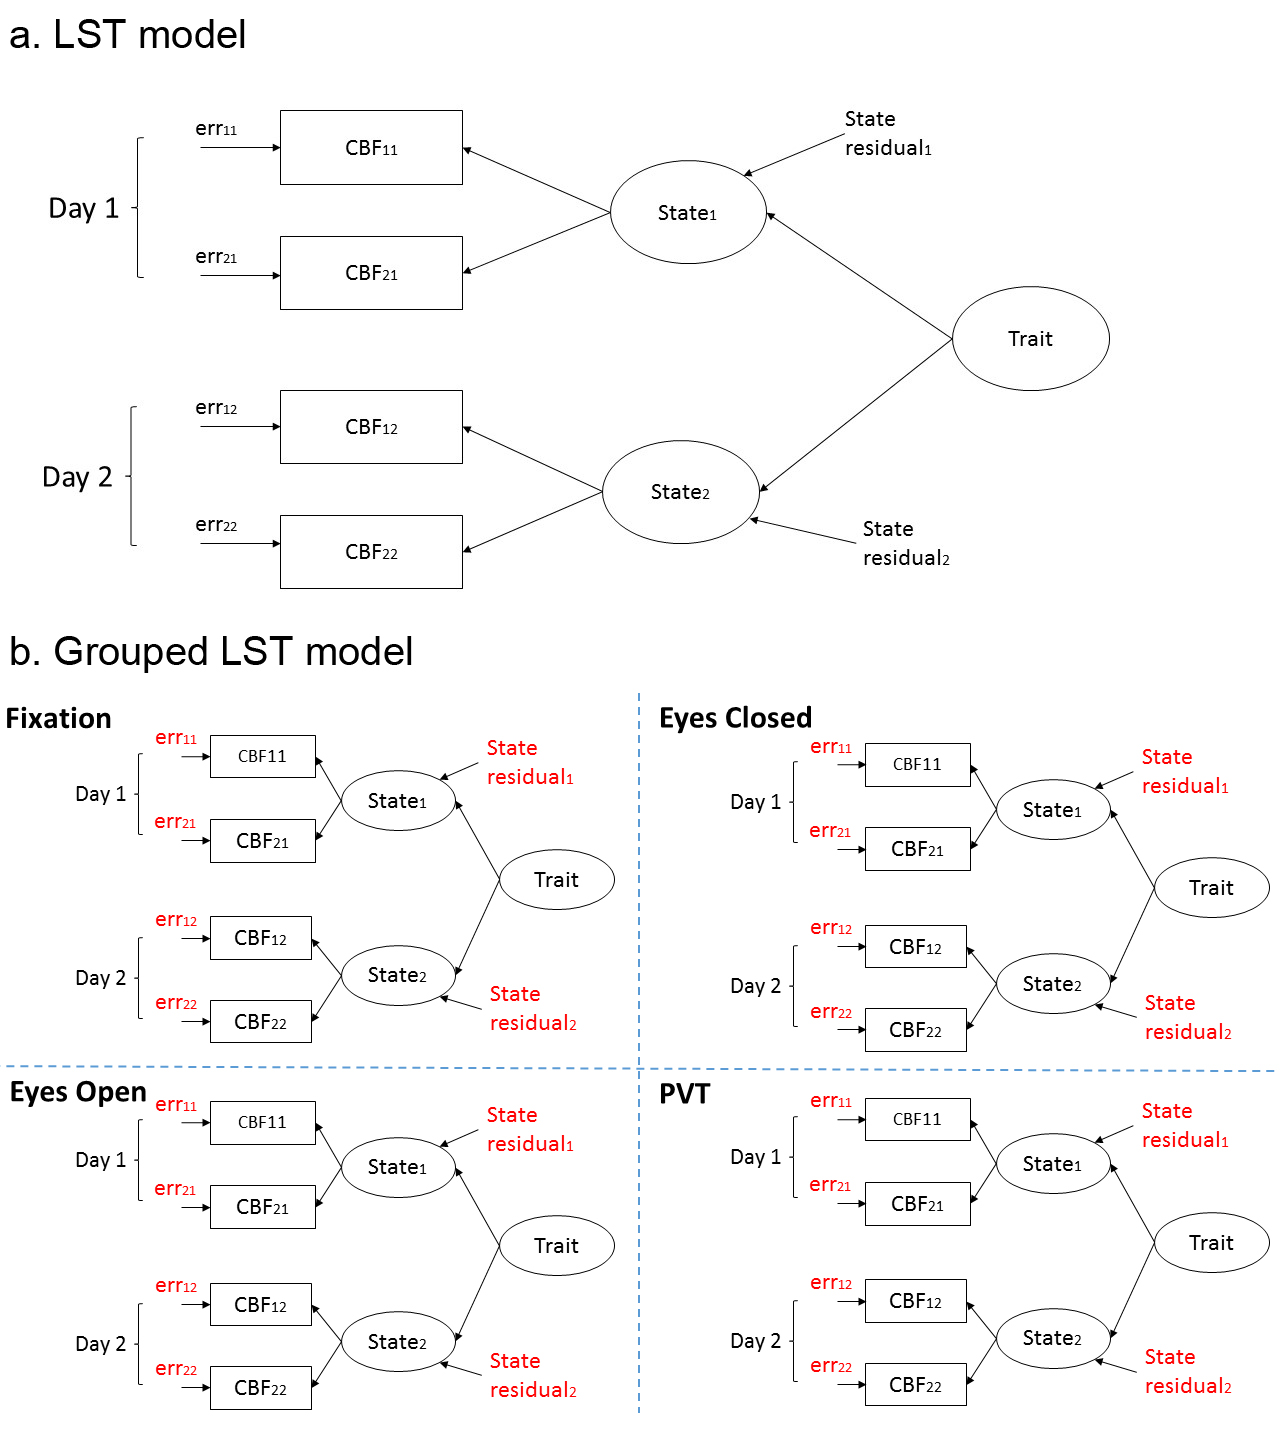
Fig. 1 Latent State-trait model
a).The Latent State-trait model (LST)6 decomposes the parallel measured CBFik (ith measure at occasion k) into measurements errors (errik) and latent statek. It then further decomposes the latent statek into state residualk and the trait. The measurement error, the state residual and the trait are un-correlated with each other. A restrictive LST model used in this study further assumes equal measurement error variance and equal state residual variance. b). the grouped LST model nests four models for the four conditions and assumes same measurement error variance and same state residual variance across the conditions.
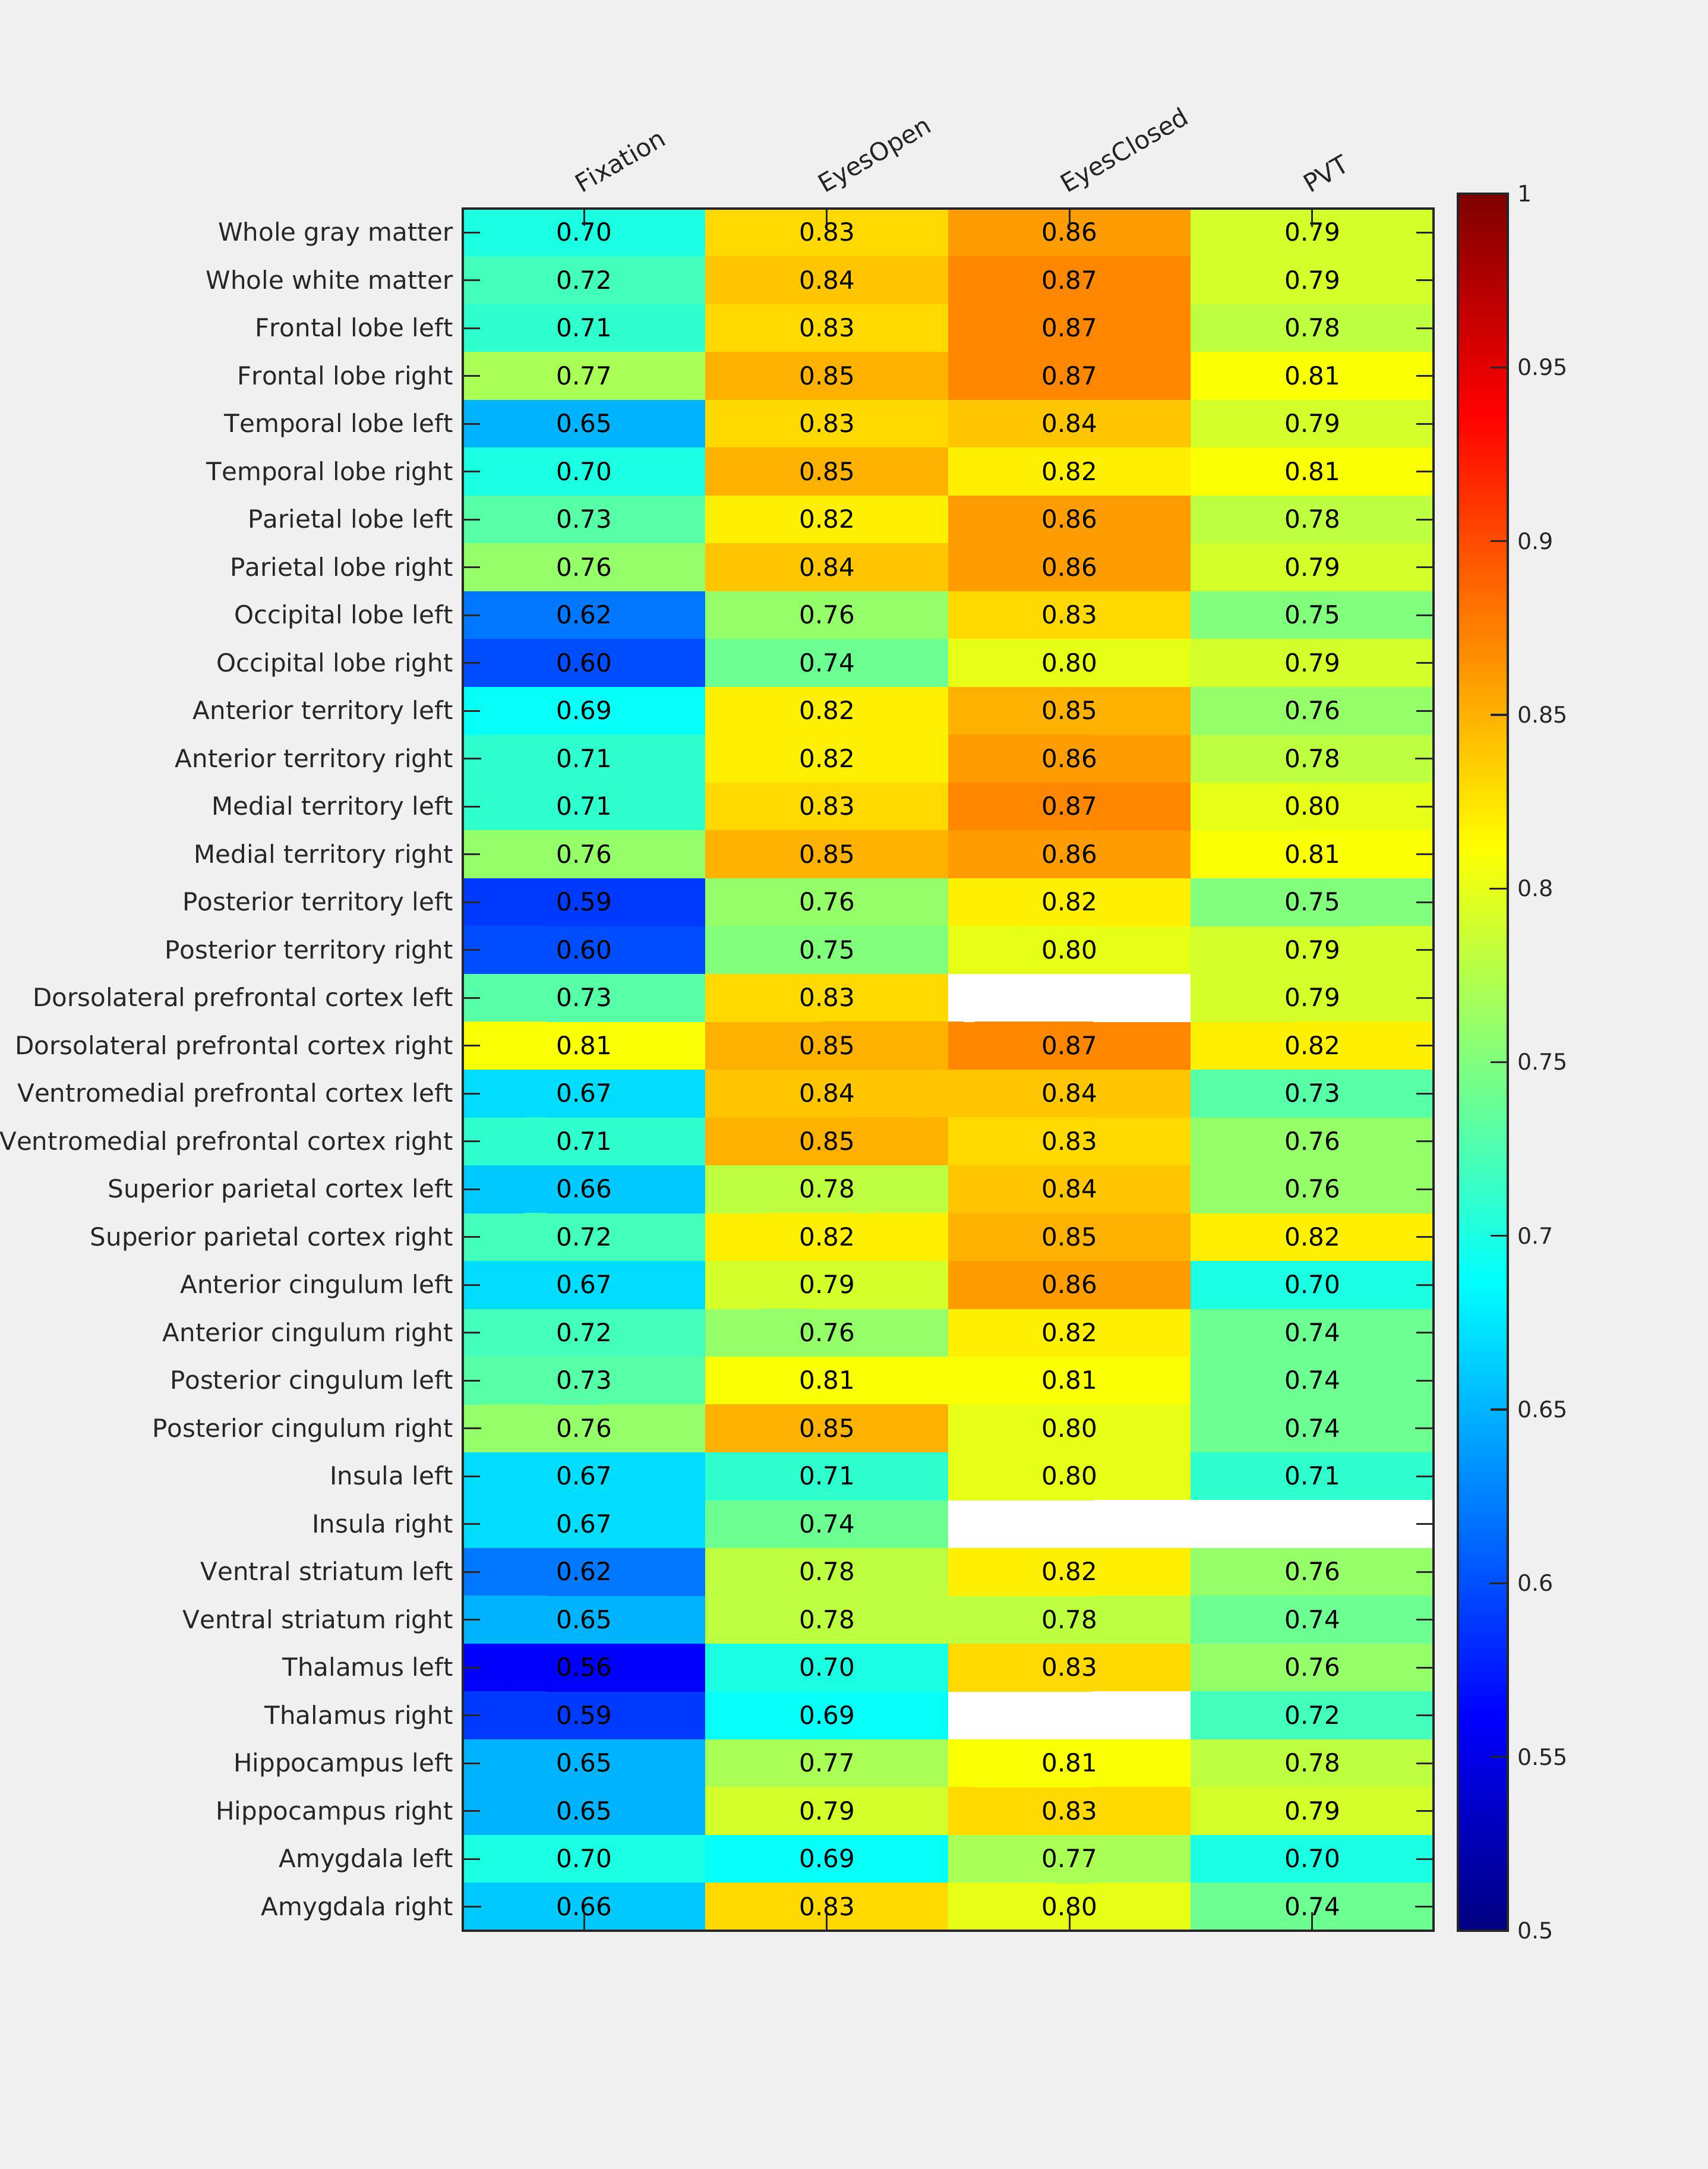
Fig. 2 Trait specificity of four resting conditions: region of interest based analysis results
Mean CBF measurements were analyzed separately using the Latent state-trait (LST) model for each of the resting conditions (each column) and each region of interest (ROI, each row). The colored grids are the regions that accepted the restrictive LST model (equal measurement error variance for the measurements, equal state residual variance across the occasions). The labeled values in the grids are the trait specificity of the CBF measures estimated by the LST model for the corresponding condition and ROI.
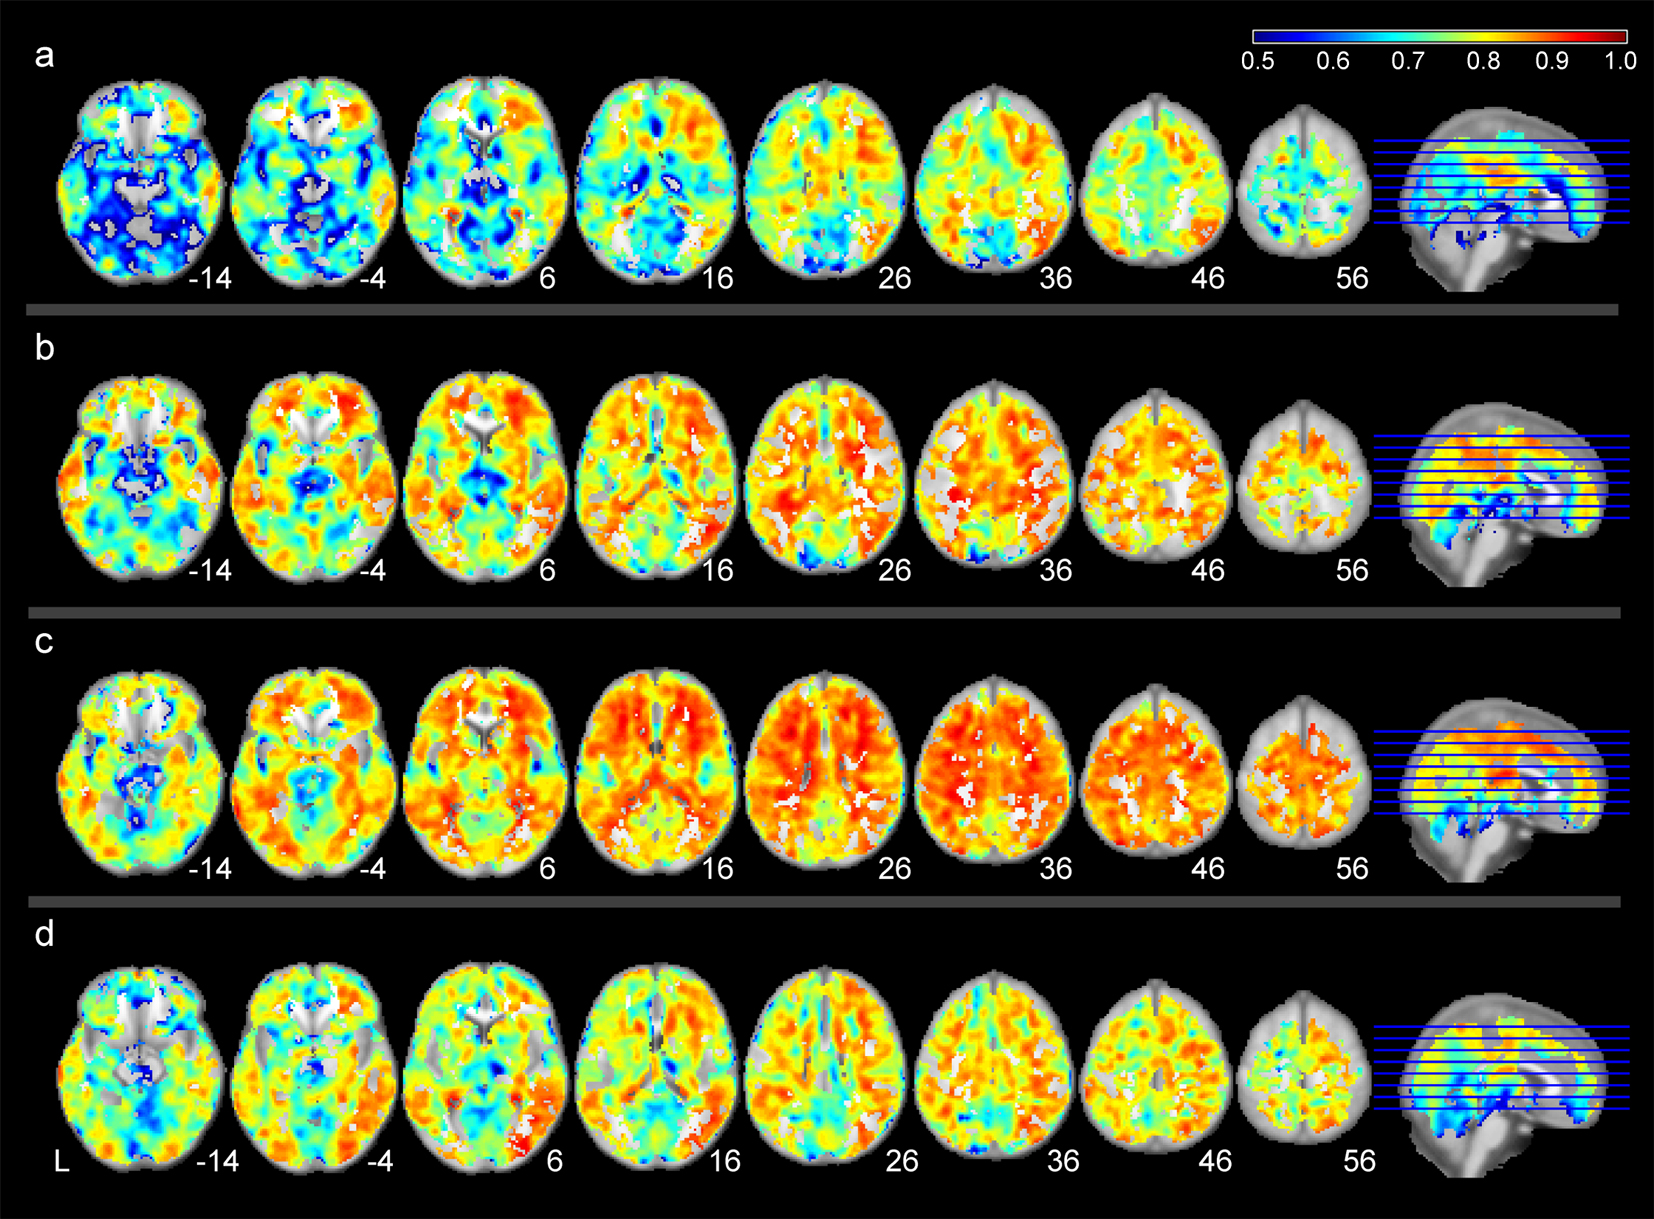
Fig. 3 Trait specificity of four resting conditions: Voxel-wise analysis results
The Latent state-trait (LST) model was estimated for each voxel’s CBF measures for each resting conditions (a, fixation; b, eyes-open; c, eyes-closed; d, PVT). The colored voxels are the voxels that accepted the restrictive LST model (equal measurement error variance for the measurements, equal state residual variance across the occasions). The color is showing the estimated trait specificity of the voxels. The CBF maps were smoothed with 6mm FWHM kernel before the model estimation for each voxel.
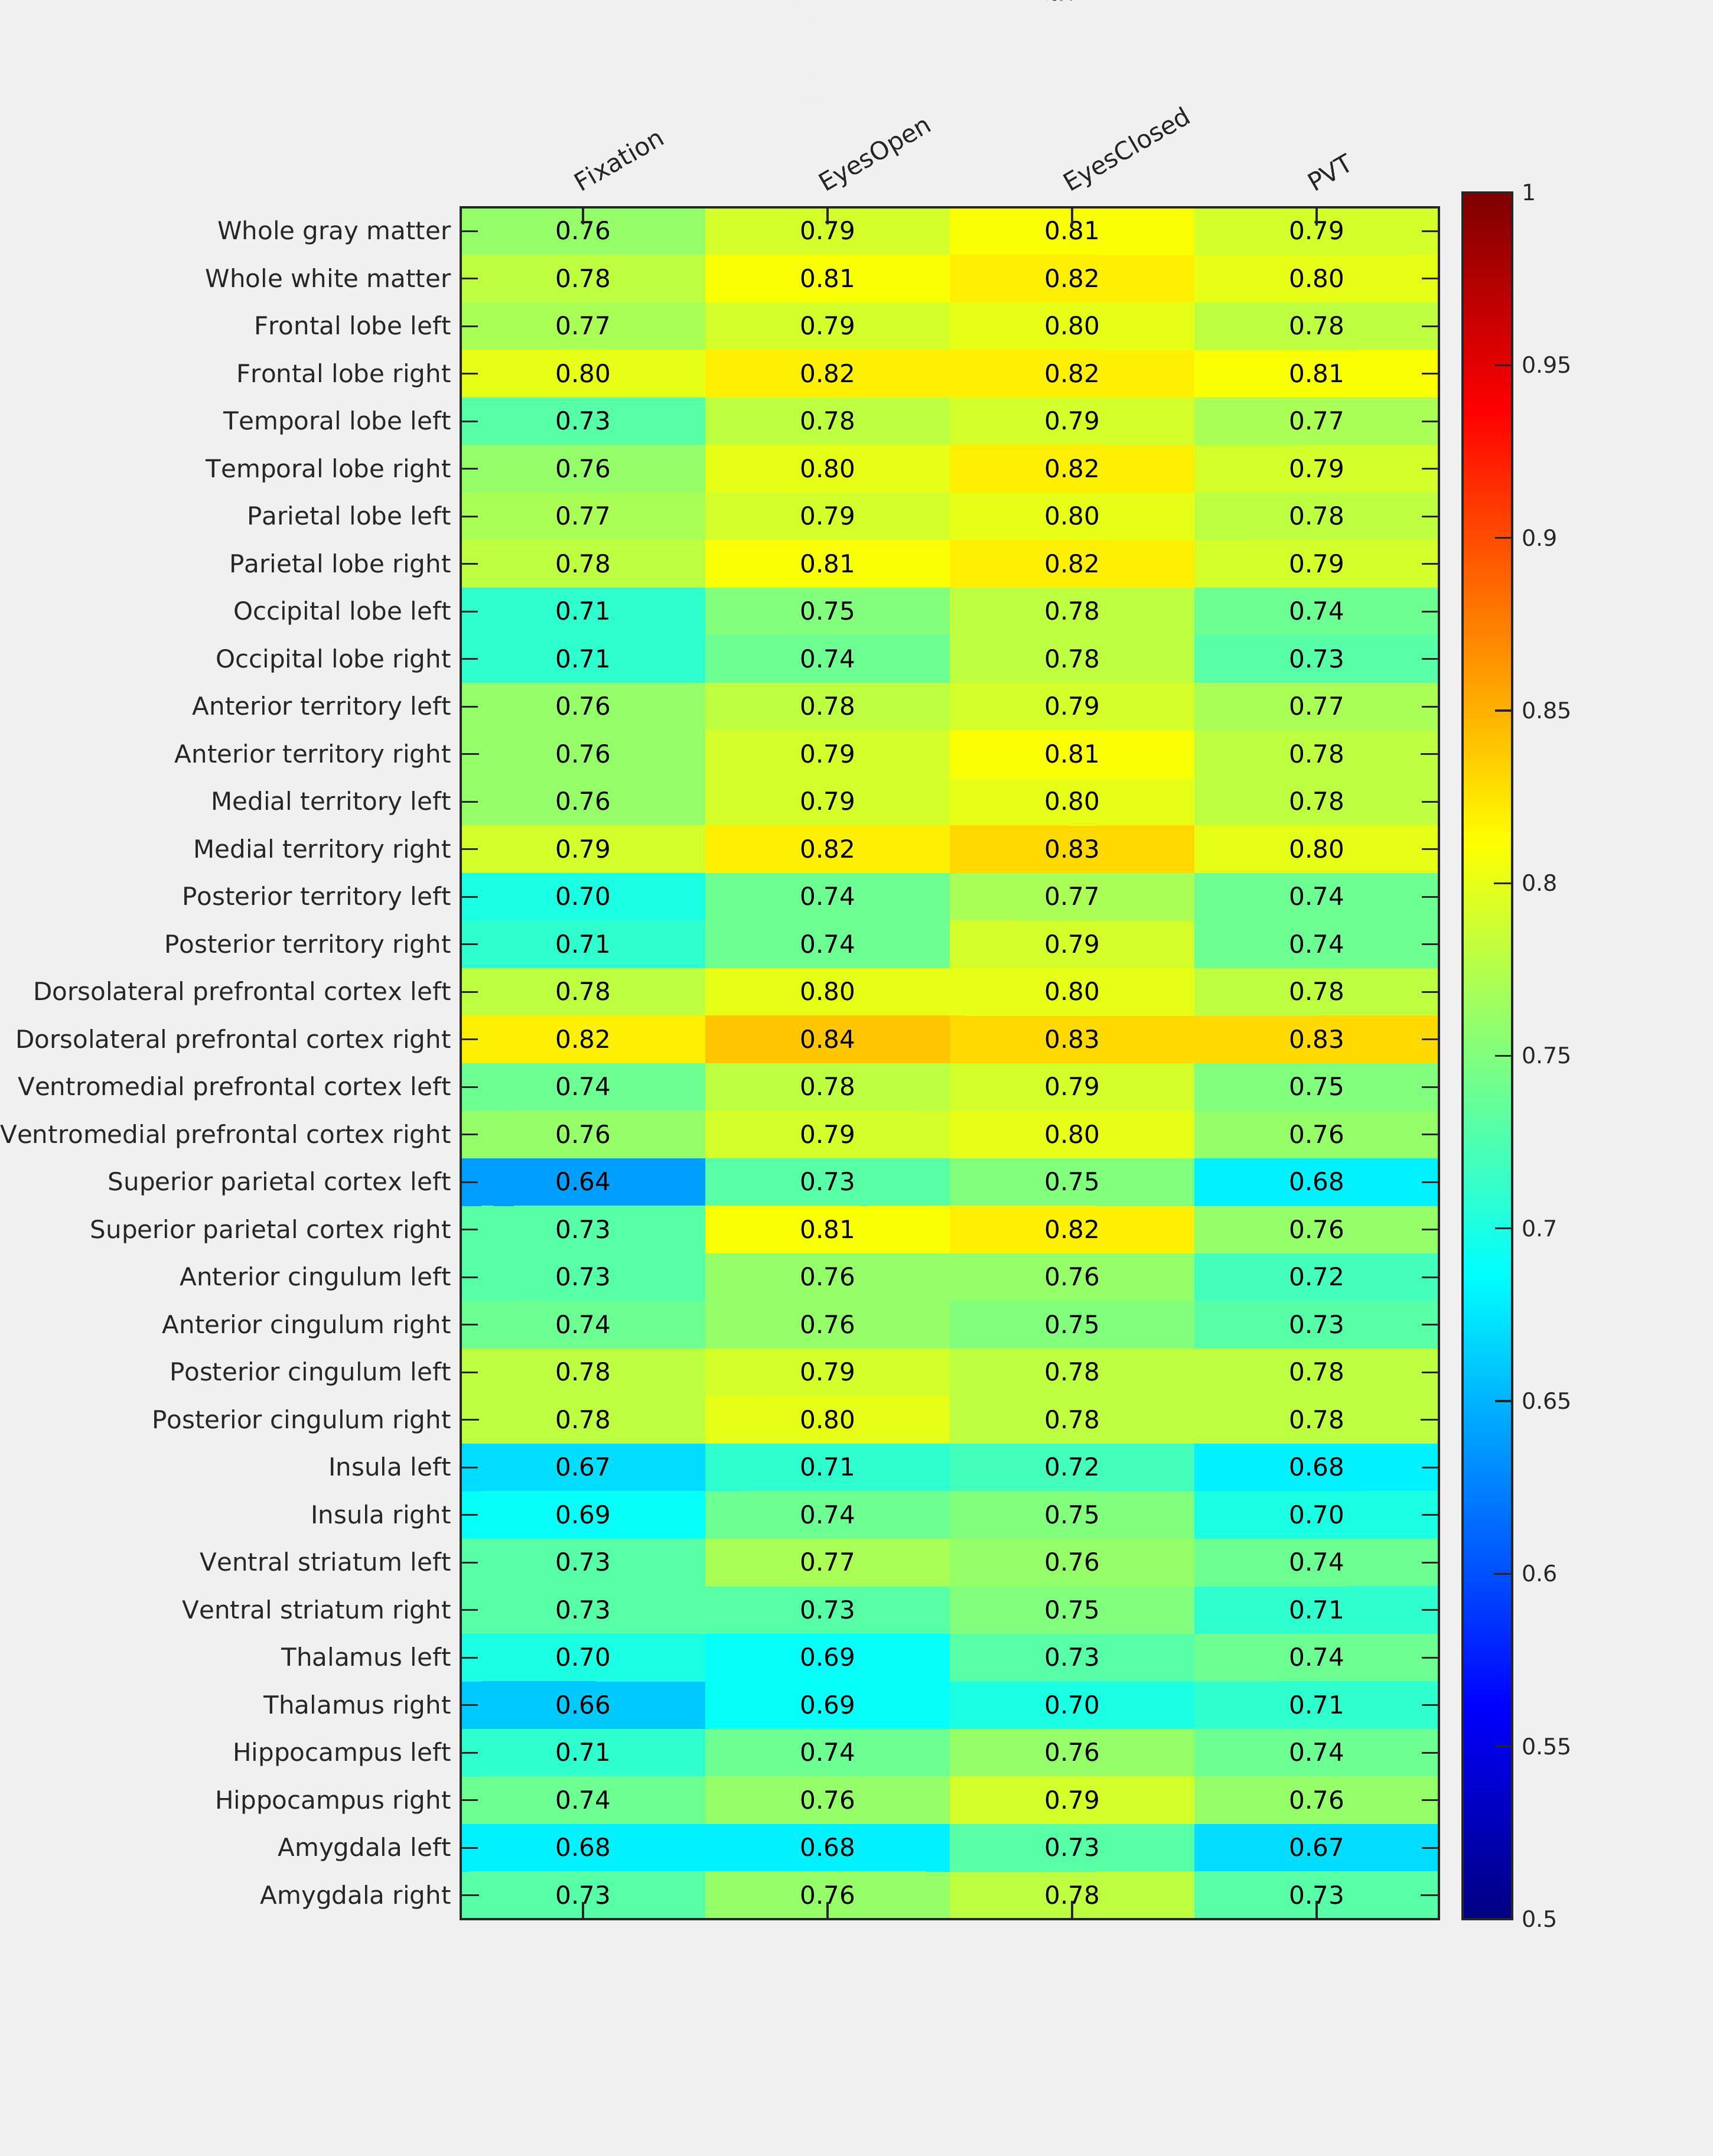
Fig. 4 Trait specificity of four resting conditions analyzed in single grouped model: ROI based analysis
The mean CBF measurements of the four resting conditions (the columns) were analyzed using a single grouped Latent state-trait (LST) model for each region of interest (ROI, each row). The colored grids are the regions that accepted the restrictive LST model (equal measurement error variance for all measurements, equal state residual variance across the occasions and resting conditions). The labeled values in the grids are the trait specificity of the CBF measures estimated by the LST model for the corresponding condition and ROI.