3635
The effect of post-labeling delay on multiband pCASL based functional connectivity1Radiology, Medical College of Wisconsin, Milwaukee, WI, United States
Synopsis
When too short a post-labeling delay (PLD) is used for ASL, intravascular artifacts can be present. This issue is amplified in multiband (MB) ASL where superior slices are acquired early in the acquisition. Here, MB pseudocontinuous ASL (pCASL) and a dual regression approach were used to analyze functional connectivity with PLD=1000ms and 1525ms. Increased whole-brain tSNR was observed for the PLD=1000ms data, but intravascular signal was present. Group connectivity was similar between PLDs, and no significant differences in mean or max z-score were seen between PLD. Thus, shorter PLDs may be appropriate for MB-ASL rsfMRI despite the presence of intravascular artifacts.
Purpose
Multiband (MB) arterial spin labeling (ASL) MRI has been shown to improve perfusion SNR efficiency, reduce inter-slice labeling delay times, and increase slice-resolution compared to single band acquisitions1-3. Short post-labeling delays (PLD) between tagging and imaging are associated with increased signal-to-noise ratios (SNR) and shorter TRs; however, when too short a PLD is used, intravascular artifacts can be present. This issue is amplified in MB-ASL where superior slices are acquired early in the acquisition. Here, MB pseudocontinuous ASL (pCASL) was used to analyze functional connectivity with PLD=1000ms and 1525ms.Methods
Seven right-handed healthy adult volunteers (four male, three female, mean age = 35.0+/- 3.6 years, age range 23–58 years) participated in this study. lmaging was performed on a GE 3 Tesla MR750 system with a body transmit coil and 32-channel NOVA receive head coil. High-resolution anatomical MPRAGE images were collected for co-registration with the functional images. Each subject underwent two resting-state MB pCASL scans, which utilized an unbalanced pCASL labeling scheme with labeling time=1450ms and PLD/TR=1000/3500 and 1525/4000ms. In-plane acceleration was employed with R=2. Additional parameters were as follows: TE=9.1ms, MB-factor=4, number of excitations=9 (total slices=9×4=36), FOV=240mm, resolution=3×3×3mm3, FA=90°. Scans lasted approximately 10 minutes. Subjects were instructed to lie awake with their eyes closed. A slice-GRAPPA algorithm was implemented for MB unaliasing4. A traditional 1D-GRAPPA approach was used to unalias in-plane aliasing5.
Preprocessing of ASL data included volume registration and skull-stripping of the data and blurring with a 4.5mm FWHM Gaussian kernel. The anatomical MPRAGE and functional images were registered to standard MNI space and segmented into gray matter, white matter, and CSF. The mean PW signal was calculated by averaging and subtracting the label from the control repetitions. A PW timeseries was also generated using the surround subtraction method6.
A dual regression analysis was performed for the functional connectivity analysis7 and implemented in FSL. For this analysis, a template containing seven spatially independent networks derived from a clustering approach, which identified networks of functionally coupled regions using data from 1000 normal subjects, was used8. For each component of interest, the procedure described in Beckman et al.9 was applied. First, the spatial component map was used as a spatial regressor in a general linear model (GLM) and the temporal signal associated with the network was extracted. This signal was then used as a regressor in a second GLM to find the subject-specific spatial maps associated with the template network. The default mode network (DMN) and motor network were selected for further analysis. Group maps were created for each dataset by converting correlations to z-scores and using a one-sample t-test. Maps were thresholded at P<0.01 with a minimum cluster size of 54 voxels (α<0.05). The temporal signal to noise ratio (tSNR) of the PW data was calculated in gray matter by dividing the mean signal by the standard deviation of the signal. Finally, the mean and max z-scores were extracted from the template mask for both networks.
Results
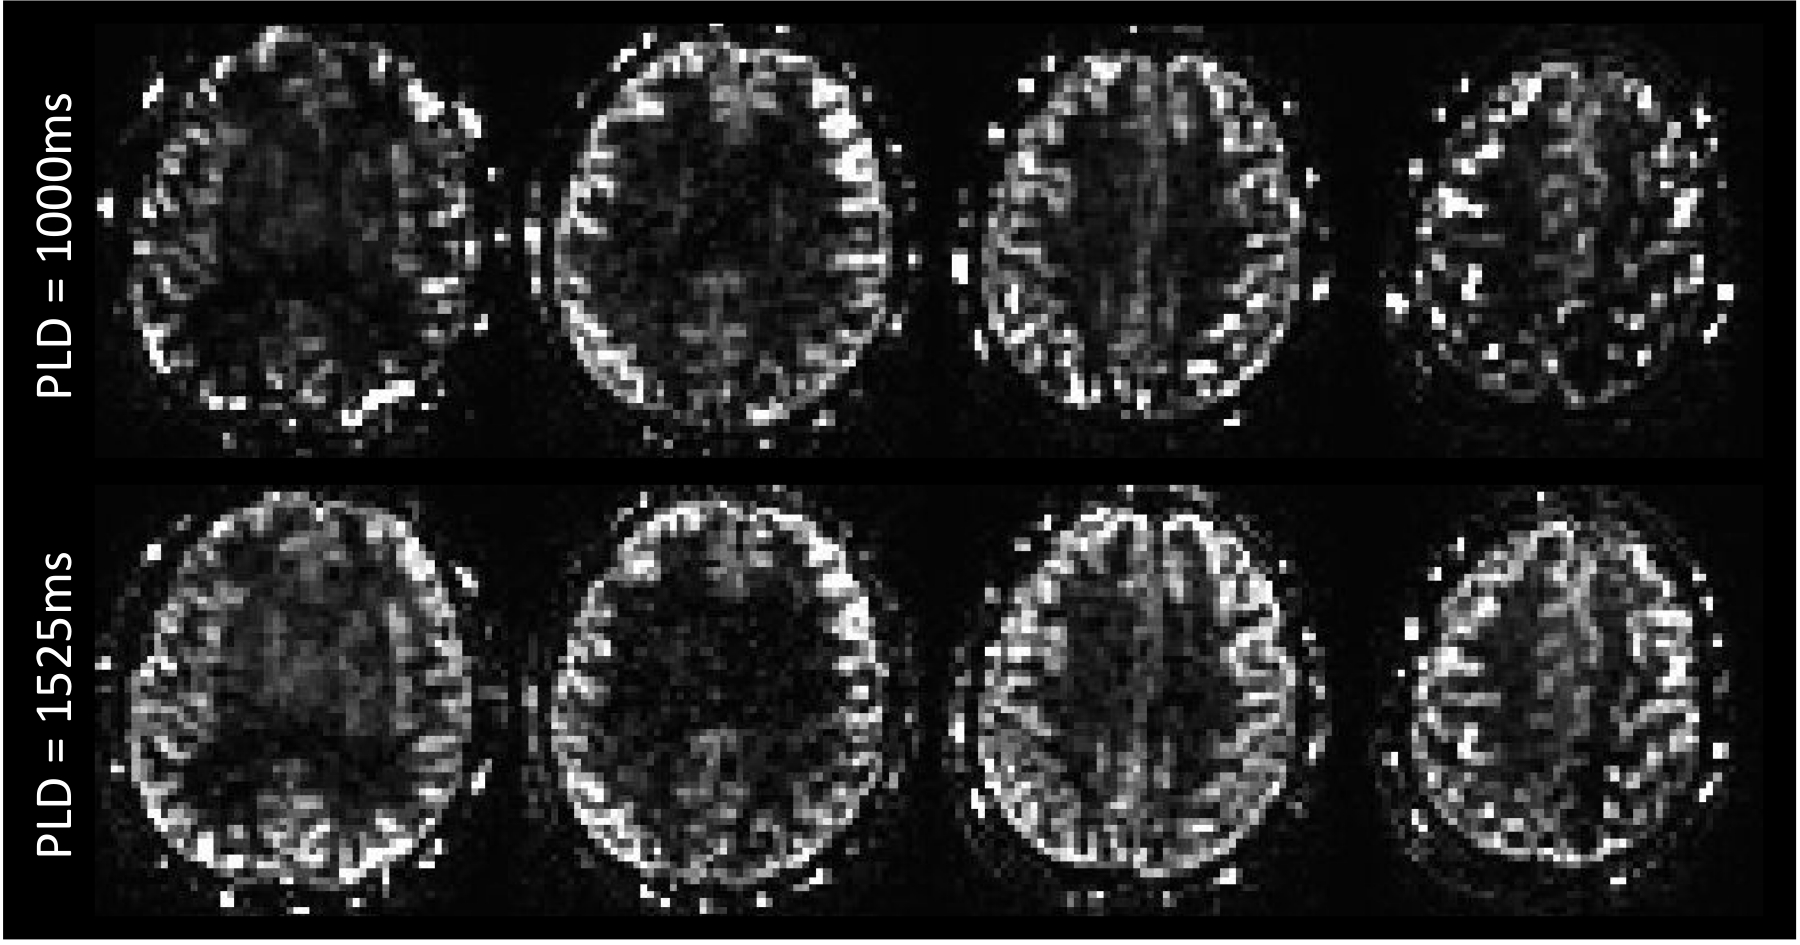
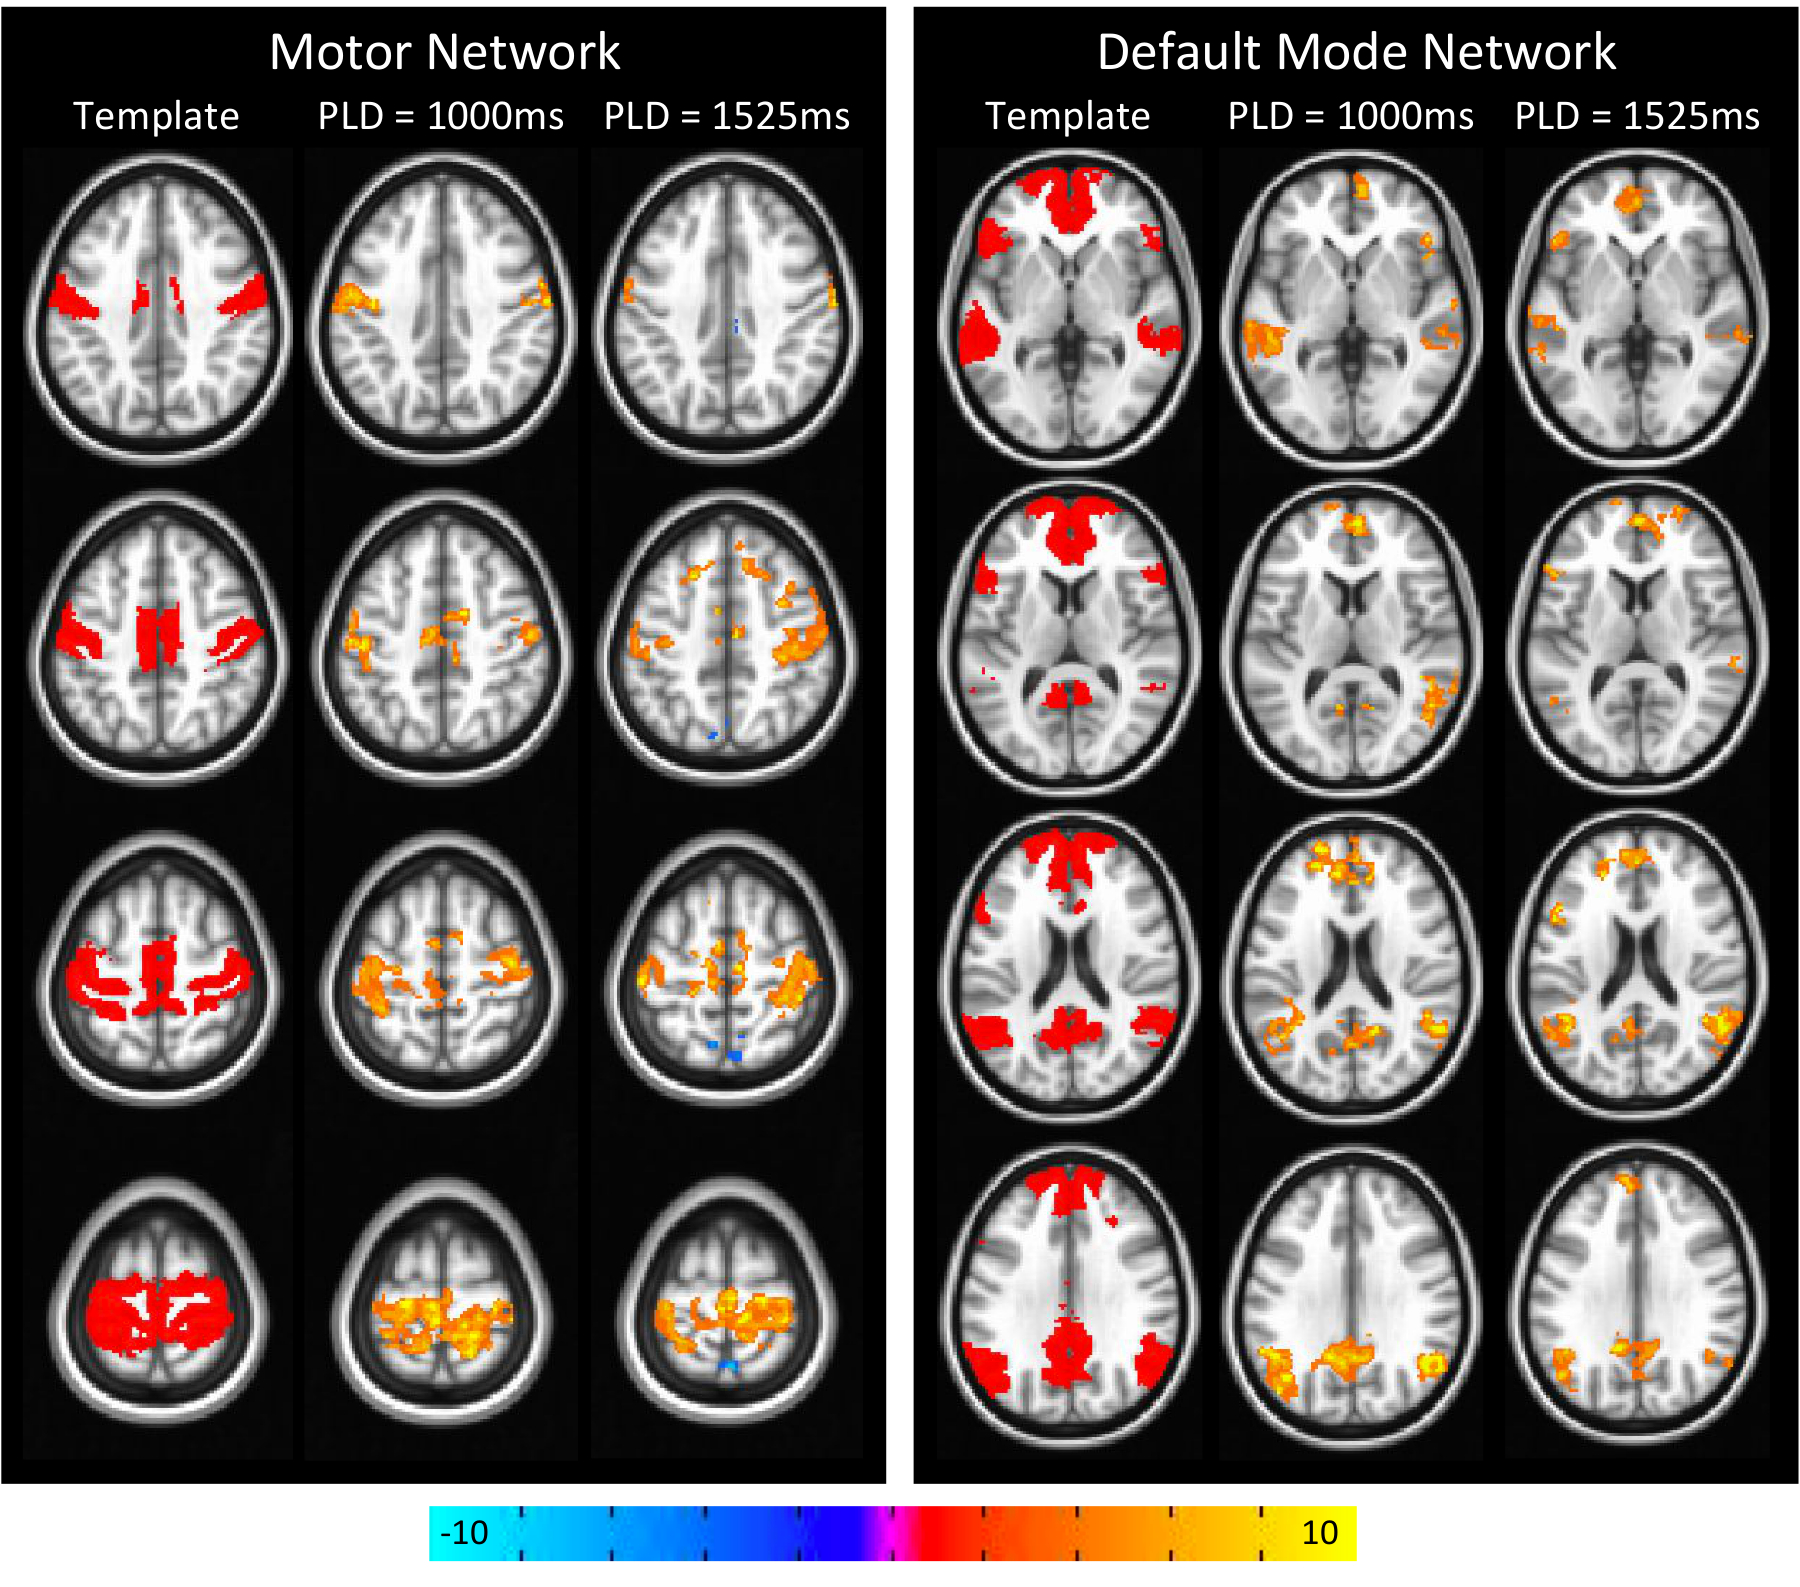
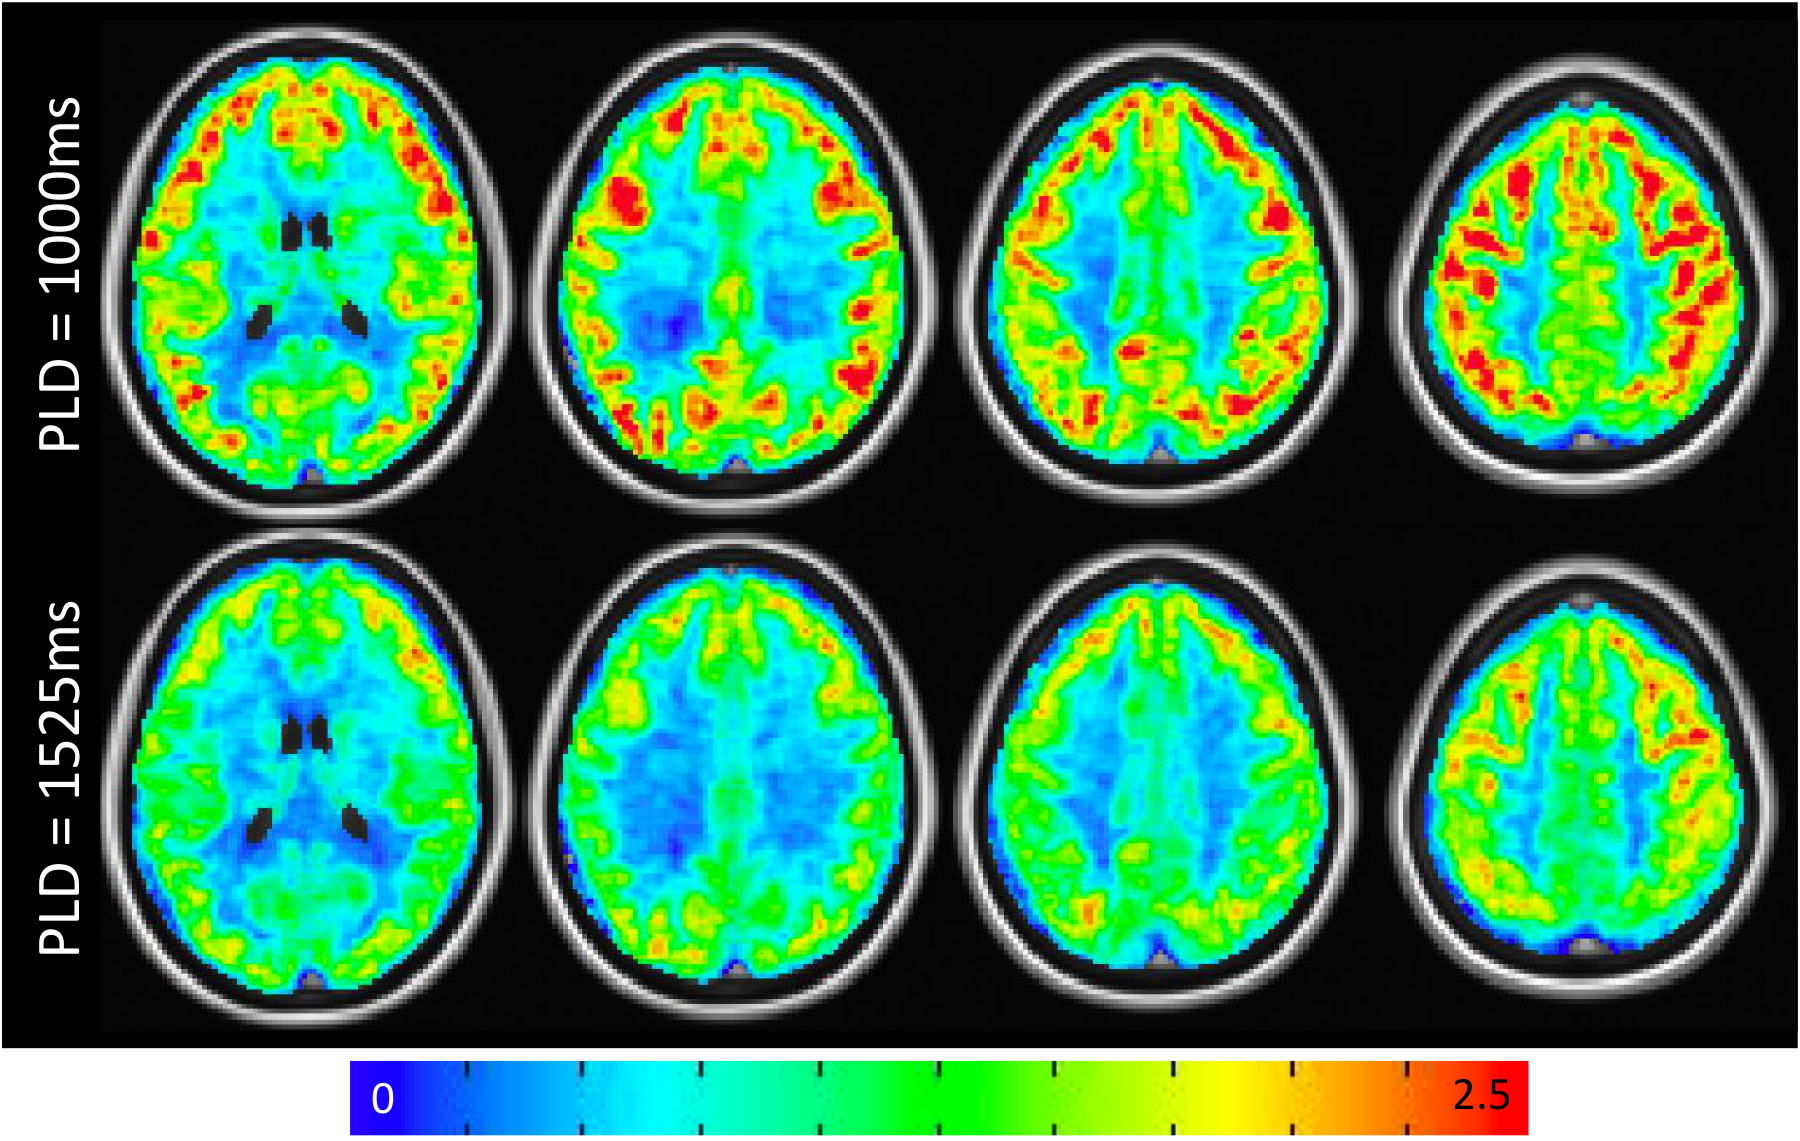
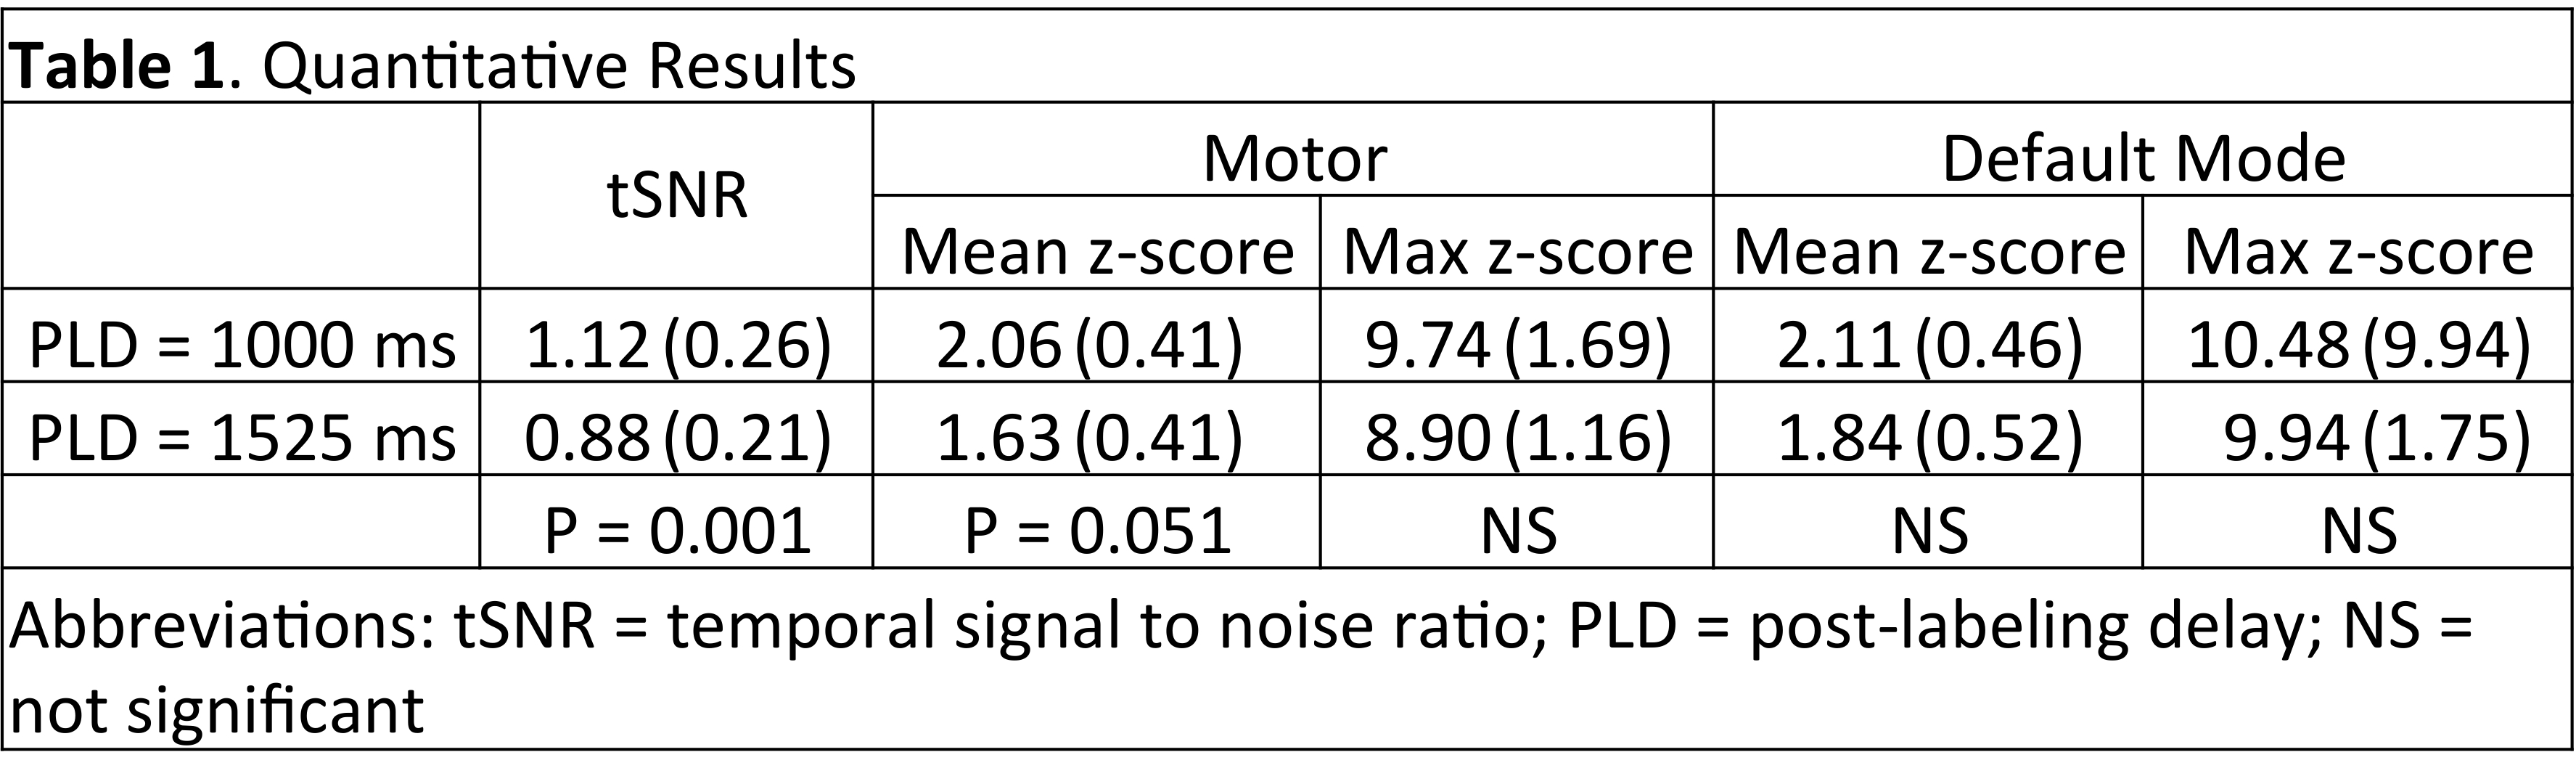
Mean PW images are shown for one representative subject in Figure 1 for PLD=1000ms and 1525ms. Intravascular signal can be seen for the PLD=1000ms case. Figure 2 shows group connectivity for the motor network and DMN. Qualitatively the networks are similar between PLD. For both networks a two-sample t-test revealed no significant differences between PLD. Quantitative results are shown in Table 1. The PLD=1000ms data had significantly higher whole-brain tSNR, however no significant differences were seen between PLDs for mean or max z-score within the template. Mean tSNR across subjects is shown in Figure 3.Discussion/Conclusions
MB-ASL acquisitions with short PLDs are susceptible to intravascular artifacts, as labeled blood doesn’t have enough time to diffuse through the capillaries. In interleaved MB imaging, superior and inferior slices are acquired at the same time and are acquired early in the acquisition. Thus, intravascular artifacts can be present in superior as well as more inferior slices. This was observed in Figure 1 for the PLD=1000ms case. Thus, care must be taken when interpreting mean PW images and quantitative CBF for MB ASL with short PLD. For this analysis, the DMN was chosen because it contains superior and inferior slices, and the motor network was chosen because it contains primarily superior slices. Despite the presence of intravascular artifacts at PLD=1000ms, no significant differences were observed between PLD for either network. Shorter PLDs lead to higher SNR images that can be acquired in a shorter TR. These results indicate shorter PLDs may be appropriate for MB ASL rsfMRI despite the presence of intravascular artifacts.Acknowledgements
This work was partially supported by a grant from the Daniel M. Soref Charitable Trust. We thank Ajit Shankaranarayanan and Matt Middione from GE Healthcare for providing source code of the GE multiband sequence.References
1. Li X, Wang D, Auerbach EJ, Moeller S, Ugurbil K, Metzger GJ. Theoretical and experimental evaluation of multi-band EPI for high-resolution whole brain pCASL Imaging. Neuroimage 2015;106:170-181.
2. Wang Y, Moeller S, Li X, Vu AT, Krasileva K, Ugurbil K, Yacoub E, Wang DJ. Simultaneous multi-slice Turbo-FLASH imaging with CAIPIRINHA for whole brain distortion-free pseudo-continuous arterial spin labeling at 3 and 7 T. Neuroimage 2015;113:279-288.
3. Feinberg DA, Beckett A, Chen L. Arterial spin labeling with simultaneous multi-slice echo planar imaging. Magn Reson Med 2013;70(6):1500-1506.
4. Setsompop K, Gagoski BA, Polimeni JR, Witzel T, Wedeen VJ, Wald LL. Blipped-controlled aliasing in parallel imaging for simultaneous multislice echo planar imaging with reduced g-factor penalty. Magn Reson Med 2012;67(5):1210-1224.
5. Griswold MA, Jakob PM, Heidemann RM, Nittka M, Jellus V, Wang J, Kiefer B, Haase A. Generalized autocalibrating partially parallel acquisitions (GRAPPA). Magn Reson Med 2002;47(6):1202-1210.
6. Wong EC, Buxton RB, Frank LR. Implementation of quantitative perfusion imaging techniques for functional brain mapping using pulsed arterial spin labeling. NMR Biomed 1997;10(4-5):237-249.
7. Filippini N, MacIntosh BJ, Hough MG, Goodwin GM, Frisoni GB, Smith SM, Matthews PM, Beckmann CF, Mackay CE. Distinct patterns of brain activity in young carriers of the APOE-epsilon4 allele. Proc Natl Acad Sci U S A 2009;106(17):7209-7214.
8. Yeo BT, Krienen FM, Sepulcre J, Sabuncu MR, Lashkari D, Hollinshead M, Roffman JL, Smoller JW, Zollei L, Polimeni JR, Fischl B, Liu H, Buckner RL. The organization of the human cerebral cortex estimated by intrinsic functional connectivity. J Neurophysiol 2011;106(3):1125-1165.
9. Beckmann CF, Mackay CE, Filippini N, Smith SM. Group comparison of resting-state FMRI data using multi-subject ICA and dual regression. OHBM2009.
Figures