3633
A denoising method for arterial spin labeling data based on total generalized variation (TGV) with a spatial varying regularization parameter1Institute of Medical Engineering, Graz University of Technology, Graz, Austria, 2Institute for Mathematics and Scientific Computing, University of Graz, Graz, Austria, 3BioTechMed-Graz, Graz, Austria
Synopsis
Arterial spin labeling perfusion imaging permits a noninvasive approach to measure cerebral blood flow. The poor SNR of this technique makes denoising essential. ASL images are often corrupted with motion, physiological or scanning artifacts or acquired using parallel imaging leading to spatial dependent noise. To account for those artifacts and spatial varying noise we propose a denoising approach based on total generalized variation (TGV) using a spatial dependent regularization parameter. The performance of the proposed technique is evaluated on synthetic and in-vivo data and compared with the non-local means combined dual-tree complex wavelet transform (DT-CWT) denoising method.
Introduction
Arterial spin labeling (ASL) perfusion imaging
permits a noninvasive approach to measure cerebral blood flow. The poor
SNR of this technique makes denoising important1 and therefore many different
denoising methods were developed. However, most of those applications assume
Gaussian white noise which is often violated in practice due to motion,
physiological or scanning artifacts.2 Furthermore, ASL images are often
acquired using parallel imaging to reduce the echo train length or echo time leading
to spatial dependent noise.3 Considering for those artifacts and spatial
varying noise we propose a denoising approach based on total generalized
variation (TGV)5 using a spatial dependent regularization parameter. The
purpose of this study is to evaluate the performance of the proposed technique
on synthetic and experimental in-vivo high resolution PASL data with different
numbers of control-label pairs. The results are compared with the non-local
means combined dual-tree complex wavelet transform (DT-CWT) denoising method5
which has recently shown to perform well due to its adaptive scheme.1Methods
The ASL experiments were carried out on a 3T MR system (Magnetom Skyra, Siemens Healthcare, Germany). Pulsed ASL measurements were performed on four healthy subjects using PICOR - Q2TIPS6 single shot EPI with a 32-channel head coil. The following acquisition parameters were used: 12 slices, 3.6mm thickness, distance factor 25%, matrix 128x128, field-of-view 230x230 mm², in-plane resolution 1.8x1.8 mm2, 6/8 partial Fourier, GRAPPA-factor 2, TR/TE = 2800/19ms, flip angle = 90°, TI1/TI2 = 800ms/1800ms and labeling slab thickness 100mm. Additionally anatomical T1 weighted images were acquired from one subject using a 3D MPRAGE sequence with 1x1x1 mm³ resolution. For baseline evaluation a noise free synthetic perfusion map was generated based on anatomical MR data as described in Bibic et al.7 To achieve realistic noise conditions, the standard deviation over the 500 repetitions was estimated independently from the acquired C and L images for each voxel. Subsequent Gaussian noise with the previously estimated standard deviation was added to each voxel of the synthetic noise free C and L image. ASL image preprocessing was performed using SPM12, MATLAB (Mathworks, Sherborn, Massachusetts), ASL-toolbox8,9 and in-house MATLAB scripts. Prior to spatial denoising, ASL datasets were motion corrected, de-trended and outliers were removed using the algorithm recommended by Fazollahi et al.1 Spatial varying regularization of the ASL data is done by minimizing the cost function:
$$\min_{u_c, u_l} \frac{1}{2}\left\|\lambda_c(\mathbf{1} u_c - U_c^{\delta})\right\|_2^2 + \frac{1}{2}\left\|\lambda_l(\mathbf{1} u_l - U_l^{\delta})\right\|_2^2 + TGV_{\alpha1,\alpha0}(u_c) + TGV_{\alpha1,\alpha0}(u_c - u_l)$$
where $$$\alpha_1$$$ and $$$\alpha_0\ $$$ are fixed model parameters,4 $$$\lambda_c$$$ and $$$\lambda_l$$$ denote the spatial dependent regularization parameters for control and label image calculated independently in each voxel as 0.047 divided by the temporal standard deviation, $$$U_c\,$$$and$$$\,U_l$$$ are the acquired C/L-images, $$$u_c\,$$$and$$$\,u_l$$$ are the spatial reconstructions and the $$$\mathbf{1}$$$-matrix produces a number of identical copies of $$$u_c\,$$$and$$$\,u_l$$$ over the temporal dimension.
As a measure of denoising quality two common metrics were used: the structural similarity index (SSIM)10 and the peak signal to noise ratio (PSNR).2,5 In case of the synthetic dataset the generated noise free perfusion weighted image PWI served as gold standard. For the experimental dataset the gold standard PWI was approximated from the 500 C/L-pairs. For comparison of our approach the DT-CWT filter was used (https://www.nitrc.org/projects/dt-cwt-nlm).5 To ensure best possible results, the parameters of the DT-CWT filter were optimized by maximizing the SSIM between gold standard and denoising result.
Results and Discussion
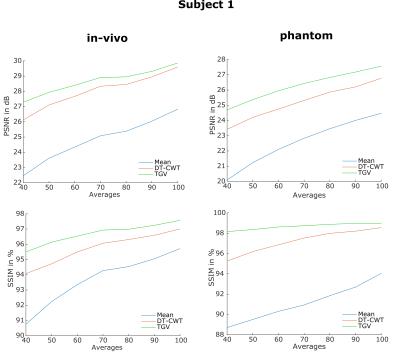
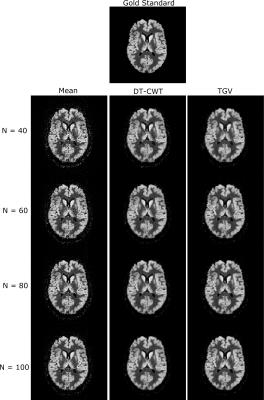
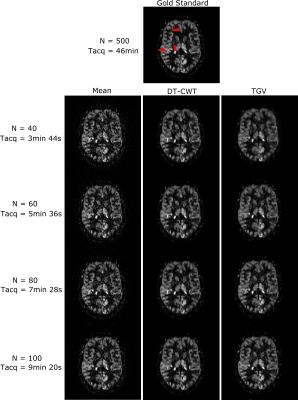
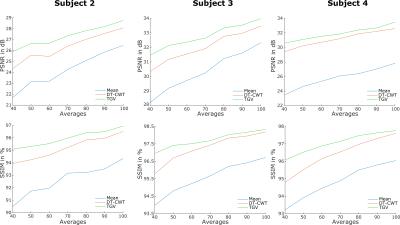
Figure 1 shows a quantitative evaluation of the denoising approaches. The mean SSIM and PSNR are given for different numbers of C/L-pairs of the synthetic and experimental dataset of subject 1. Both, synthetic and in-vivo datasets show a higher SSIM and PSNR, especially at low SNR compared to the DT-CWT. Figure 2 shows exemplary the noise free, the noisy and denoised synthetic PWIs using 40, 60, 80 and 100 C/L-pairs. In comparison to the DT-CWT denoising approach the proposed TGV based method shows improved noise removal, especially in the WM, while small features are still retained. Typical in-vivo PWIs from subject 1 are displayed in Figure 3. By incorporating the varying standard deviation in the TGV denoising approach local outliers are removed and the quality of the PWIs is improved (indicated by the red arrows in Figure 3). Figure 4 shows the mean SSIM and PSNR for the experimental dataset of the remaining 3 subjects using different numbers of C/L-pairs. The same trends as in Figure 1 can be observed.Conclusion
The proposed method allows for automatic denoising of ASL-data by incorporating the temporal standard-deviation and is capable of meeting highly clinical demands in terms of scan time, reduction of local outliers and spatial resolution.Acknowledgements
This work was funded by the Austrian Science Fund "SFB 3209-18"References
1. Fazlollahi A, Bourgeat P, Liang X, et al. Reproducibility of multiphase pseudo-continuous arterial spin labeling and the effect of post-processing analysis methods. Neuroimage 2015;117:191–201.
2. Fang R, Huang J, Luh WM. A spatio-temporal low-rank total variation approach for denoising arterial spin labeling MRI data. IEEE 2015;498-502.
3. Ferré JC, Petr J, Bannier E. Improving quality of arterial spin labeling MR imaging at 3 Tesla with a 32-channel coil and parallel imaging. J Magn Reson Imaging 2012;35(5):1233-1239.
4. Bredies K, Kunisch K, Pock T. Total Generalized Variation. SIAM J Imaging Sci. 2010;3(3):492-526.
5. Liang X, Connelly A, Calamante F. Voxel-Wise Functional Connectomics Using Arterial Spin Labeling Functional Magnetic Resonance Imaging: The Role of Denoising. Brain Connect. 2015;5:543-553.
6. Luh WM, Wong EC, Bandettini PA, et al. QUIPSS II with thin-slice TI1 periodic saturation: a method for improving accuracy of quantitative perfusion imaging using pulsed arterial spin labeling. Magn Reson Med. 1999;41(6):1246-1254.
7. Bibic A, Knutsson L, Ståhlberg F, et al. Denoising of arterial spin labeling data: wavelet-domain filtering compared with Gaussian smoothing. MAGMA. 2010;23(3):125-137.
8. Wang Z. Improving cerebral blood flow quantification for arterial spin labeled perfusion MRI by removing residual motion artifacts and global signal fluctuations. Magn. Reson. Imaging 2012;30:1409–1415.
9. Wang Z, Aguirre GK, Rao H, et al. Empirical optimization of ASL data analysis using an ASL data processing toolbox: ASLtbx. Magn. Reson. Imaging 2008;26:261–269.
10. Wang Z, Bovik AC, Sheikh HR, et al. Image Quality Assessment: From Error Visibility to Structural Similarity. IEEE Trans. Image Process. 2004;13:600–612.
Figures


