3629
Single shot high resolution 3D arterial spin labeling using 2D CAIPI and ESPIRiT reconstruction1Laboratory of FMRI Technology (LOFT), Mark & Mary Stevens Neuroimaging and Informatics Institute, Keck School of Medicine, University of Southern California, Los Angeles, CA, United States
Synopsis
We present a single-shot 3D GRASE pCASL technique, which reduces the data loss due to motion, using 2D CAIPI sampling strategy, and reconstruct the under-sampled data using ESPIRiT. Proposed sequence employs 4-fold acceleration and achieves whole brain volume with isotropic 3×3×3 mm3 resolution. This technique was successfully applied for high resolution multi-delay ASL imaging, and CBF, ATT and T1 map could be simultaneously calculated in 4 min 14 sec.
Purpose
Pseudo-continuous arterial spin labeling (pCASL) with segmented 3D acquisitions has been recommended as preferred clinical implementation, However, segmented 3D acquisition leads to relative long readout duration causing spatial blurring and sensitivity to head motion. In this study, we present a single-shot 3D GRASE pCASL technique using 2D CAIPI sampling strategy [1], and reconstruct the under-sampled data using ESPIRiT [2]. This technique was successfully applied for high resolution multi-delay ASL imaging.Methods
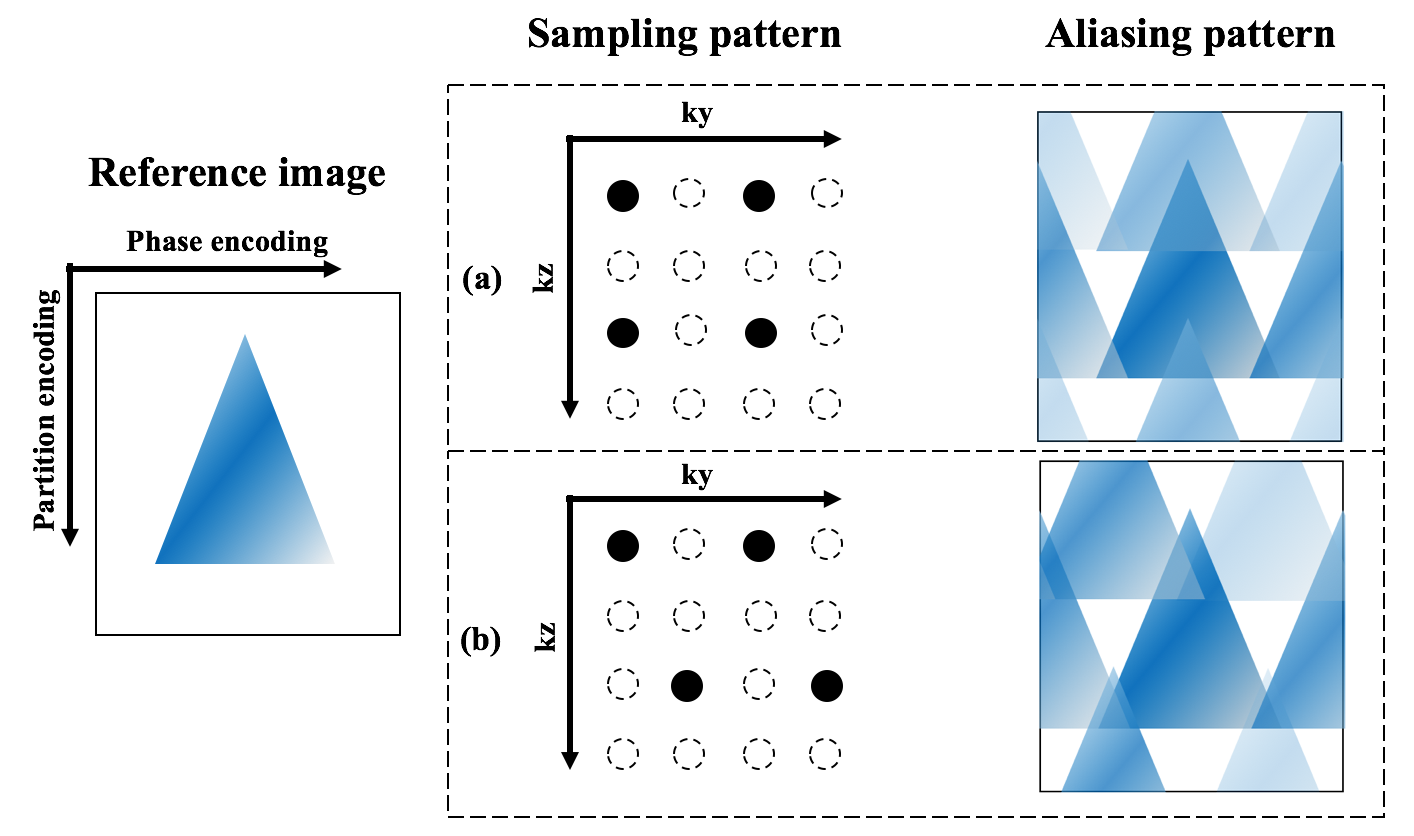
MRI scanning was performed on a Siemens 3T Prisma scanner (Erlangen, Germany) using a 32-channel head coil. Imaging parameters were: FOV=224 mm, 40 slices with 20% slice oversampling, resolution=3×3×3 mm3, bandwidth=3126 Hz/pixel, echo spacing=0.40 ms, TE=30.56 ms, TR=4200 ms, label/control duration=1500 ms and background suppression (BS) was applied with two non-selective inversion pulses within the post-labeling delay following a whole volume saturation at the beginning [3]. Single shot acquisition was achieved with acceleration factor=2 along both phase and partition encoding directions, and readout duration was 442.3 ms. Appearance of aliasing artifacts from under-sampling can be controlled by sampling strategy for a lower g-factor [1]. Two common under-sampling patterns were demonstrated in Fig. 1. Present data employed the sampling pattern in Fig.1 (a), and further evaluations are needed to decide the best pattern for the proposed sequence. Under-sampled k-space data was reconstructed by ESPIRiT, which computed the sensitivity maps based on an eigenvalue approach and produced better calibration than traditional SENSE in this study [2]. Reconstruction was performed off-line using Berkeley Advanced Reconstruction Toolbox (BART) with a kernel size of 20 and l2 regularization of 0.01 [4]. Calibration was calculated based on a fully sample M0 scan.
For a quantitative comparison, a standard segmented pCASL sequence was performed with matching imaging parameters except that the imaging volume was acquired in 4 segments with an echo train length of 12. Both single-shot and segmented pCASL was performed with a single post-labeling delay (PLD) of 2000 ms. 7 pairs and 28 pairs label/control images were acquired with segmented and single-shot pCASL respectively for the same total acquisition time of 4 min 33 sec. Mean temporal-SNR (tSNR) in gray matter was calculated as mean divided by the standard deviation of the perfusion time series.
The single-shot GRASE pCASL sequence was implemented for a multi-delay ASL protocol: [4, 4, 4, 8, 8] pairs of label/control images were measured for PLD of [500, 1000, 1500, 2000, 2500] ms respectively within 4 min 17 sec. Voxel-wise cerebral blood flow (CBF) and arterial transit time (ATT) were quantified according to [5]. The BS pulses not only resulted in noise suppression, but also modulated the signal intensity in control images:
$$I=M_{0}\times(1-\exp(-\tau_{acq}/T_{1})-2\exp(-\tau_{inv,2}/T_{1})+2\exp(-\tau_{inv,1}/T_{1}))...[1]$$
where I is signal intensity from control image, M0 is the equilibrium magnitude, τacq is the time between saturation and readout, τinv,1/τinv,2 are the duration between the first/second inversion and readout, and T1 is the longitudinal relaxation time of brain tissue. Given timing parameters and control signals from multiple PLDs, a T1 map was estimated using least square fitting in Matlab based on Equation 1.
Results and discussion
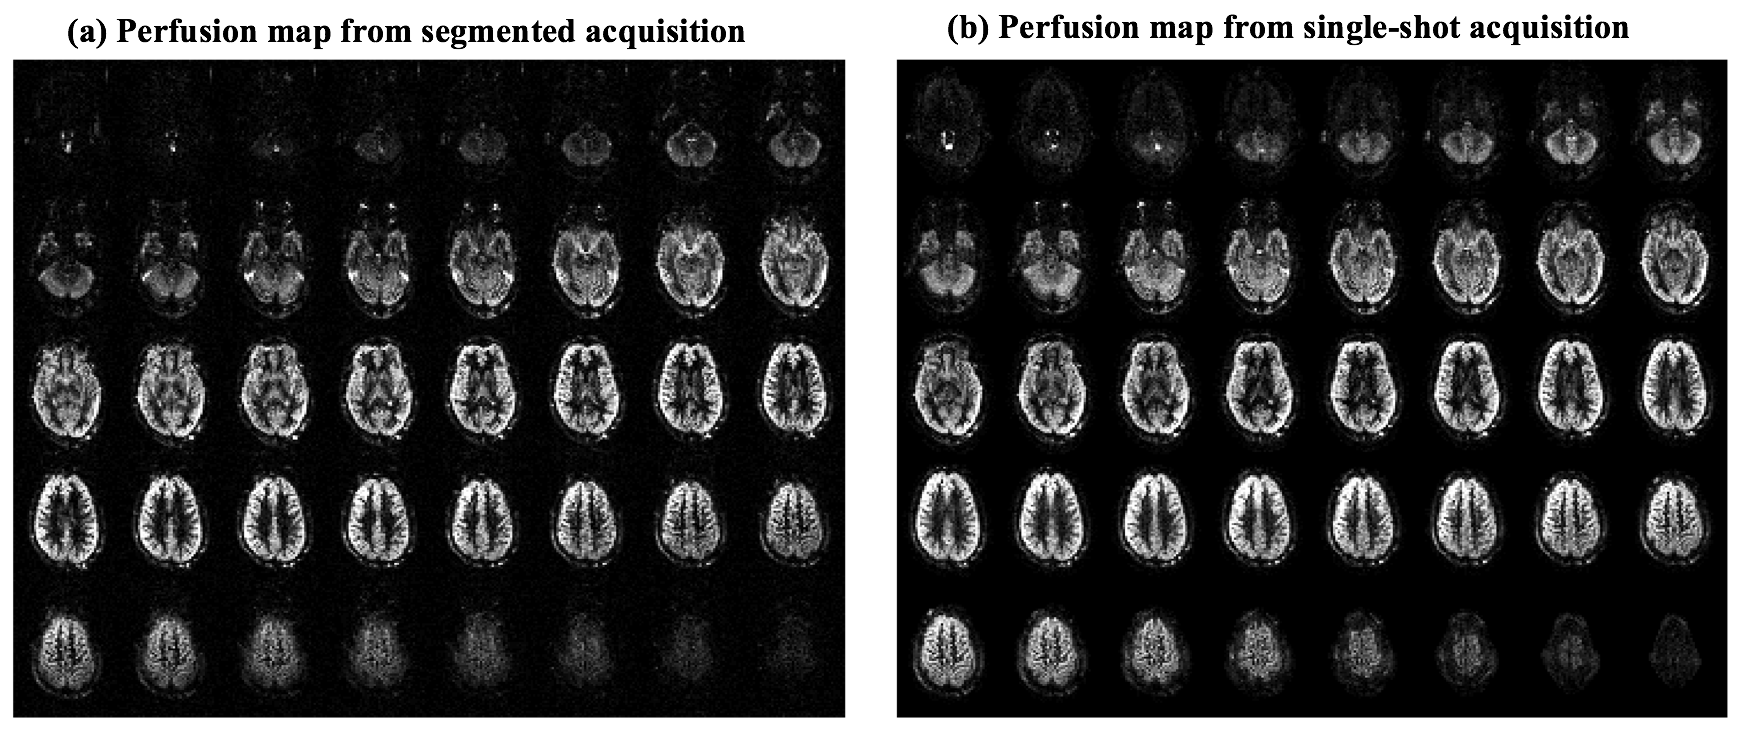
Figure 2 shows the whole brain perfusion map from both single-shot and segmented pCASL with comparable quality. t-SNR was 1.83 and 3.47 for single-shot and segmented acquisition respectively. Interestingly, SNR of undersampled signal could be slightly higher than that of fully sampled data if considered the 4-fold time difference acquiring one perfusion image, and potential reason could be due to the de-nosing effect of parallel imaging reconstruction. More experiments are needed in the future to reach statistical significance.
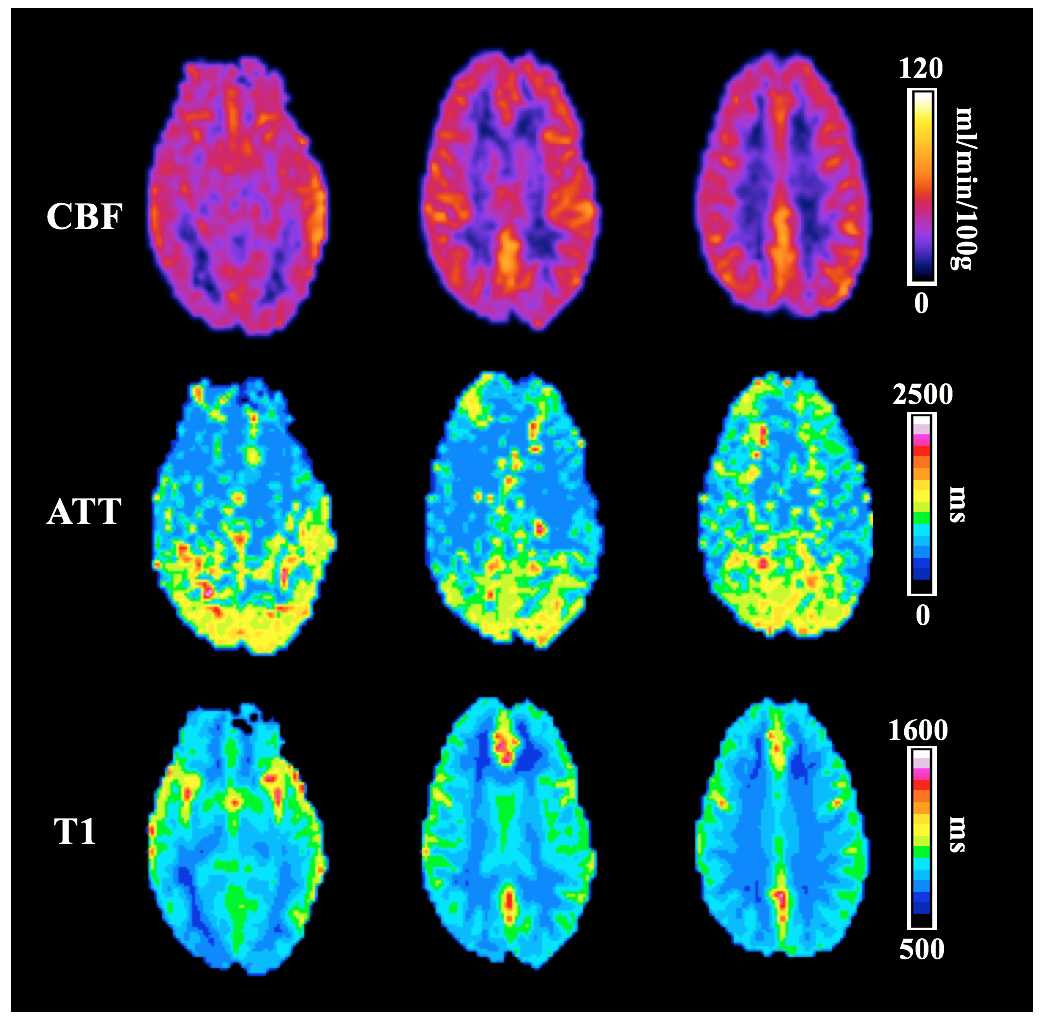
Figure 3 shows the CBF, ATT and T1 map from three representative slices calculated from 5-delay single-shot pCASL. Compared to single delay, multi-delay ASL can provide CBF, ATT and T1 information simultaneously within a short scan time and is more suitable for clinical studies. Based on our previous studies, inter-segmentation motion, which is difficult for prospective motion correction, is one of the biggest challenges to apply multi-delay ASL using standard segmented readout since only one or two measurements were acquired for one PLD. Thus proposed single-shot sequence offers a more robust approach for multi-delay ASL.
Conclusion
We present a single-shot 3D GRASE pCASL sequence with 4-fold acceleration to reduce the data loss due to motion, which covers the whole brain volume with isotropic 3 mm3 resolution and shows potential benefits for multi-delay ASL.Acknowledgements
This work was supported by NIH R01-EB014922 and UH2NS100614.References
[1] Breuer F A, et al. MRM, 2006, 55(3): 549-556. [2] Uecker M, et al. MRM, 2014, 71(3): 990-1001. [3] Maleki N, et al. Magnetic Resonance Materials in Physics, Biology and Medicine, 2012, 25(2): 127-133. [4] Uecker M, et al. Med. 2015, 23: 2486. [5] Wang D JJ et al. NeuroImage: Clinical, 2013, 3: 1-7.Figures