3627
Evaluation of 3D GRASE and 2D MB-EPI for Multi-Delay PCASL Imaging1Radiology-CMRR, University of Minnesota, Minneapolis, MN, United States, 2Laboratory of FMRI Technology, Stevens Neuroimaging and Informatics Institute, University of Southern California, CA, United States, 3Siemens Medical Solutions USA Inc., MN, United States
Synopsis
Recently 2D multi-band (MB) imaging has emerged as a promising alternative to 3D acquisitions for arterial spin labeling imaging. As part of the Human Connectome Project, we evaluated a segmented 3D GRASE and 2D MB-EPI for multi-delay PCASL imaging in terms of test-retest repeatability and CBF/ATT quantification. The results indicated that compared to 3D GRASE, 2D MB-EPI is less sensitive to subject motion, provided comparable but more reproducible ATT and CBF estimates, and suffered less from data loss. 2D MB-EPI appears promising for multi-delay PCASL imaging, especially with limited imaging time and where higher spatial resolution is of interest.
Purpose
Arterial spin labeling (ASL) (1) offers an appealing approach for quantitative cerebral blood flow (CBF) measurement without radiation or contrast agent, and has been included in the second phase of the Human Connectome Project (HCP) to study evolutions of CBF in children and elderly populations. Since CBF is a surrogate marker of brain metabolism and function, ASL can complement structural and functional connectivity by diffusion MRI and BOLD fMRI. Given the wide age range and potential vascular changes associated with development and aging, it is necessary to simultaneously measure arterial transit time (ATT) and CBF using a multi-delay ASL protocol, as employed by the UK Biobank project. Currently, pseudo-continuous ASL (PCASL) with background suppressed segmented 3D acquisitions are recommended as the preferred clinical implementation (3). However, segmented 3D acquisitions may be sensitive to head motion often present in young children and elderly subjects. Recently, multi-band (MB)/simultaneous multiple slice (SMS) EPI has been successfully applied for high-resolution whole brain PCASL imaging with demonstrated improvement in perfusion SNR efficiency and quantification reliability (4). Compared to 3D GRASE, MB-EPI is potentially less sensitive to subject motion due to its accelerated single-shot volume acquisition. Since there are pros and cons to using either 3D or 2D PCASL methods, we performed a pilot study to evaluate the two acquisition methods (3D GRASE and 2D MB-EPI) for multi-delay PCASL imaging in terms of image quality, test-retest repeatability and CBF quantification.Methods
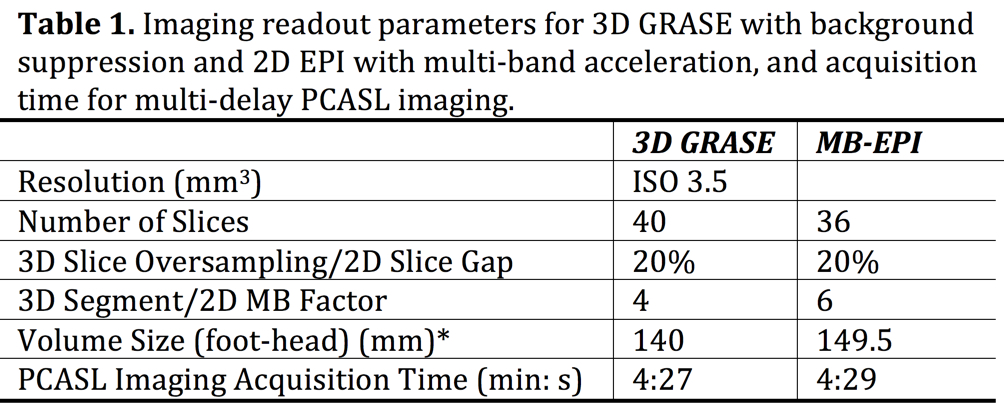
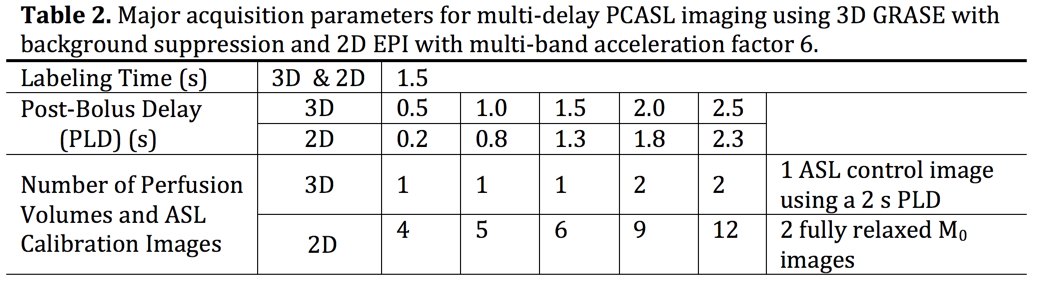
Studies with 6 healthy volunteers were performed on a Siemens 3T Prisma MRI scanner with a 32-channel phased array head coil. Two PCASL imaging methods were evaluated: segmented 3D GRASE PCASL imaging with background suppression and single-shot 2D MB-EPI PCASL imaging without background suppression. Both methods were repeated four times during a single session with the acquisition order between the two methods randomized across subjects. The imaging parameters were matched closely for the two imaging methods (Table 1). Due to a segmented 3D acquisition (4-shots), the number of measurements at each of the 5 post-labeling delays had to be reduced compared to those of 2D MB-EPI PCASL (Table 2).
Post-processing was performed using SPM within Matlab. The ATT maps were generated based on the weighted delay (WD) approach (2, 5), and CBF quantification employed the single compartment perfusion model that took into account the estimated ATT (5). The test-retest repeatability was assessed using a coefficient of variation (C.V.) of four multi-delay PCASL measurements obtained within grey and white matter (GM and WM) ROIs. Statistical analyses using paired two-tailed t test were performed within the GraphPad software.
Results and Discussions
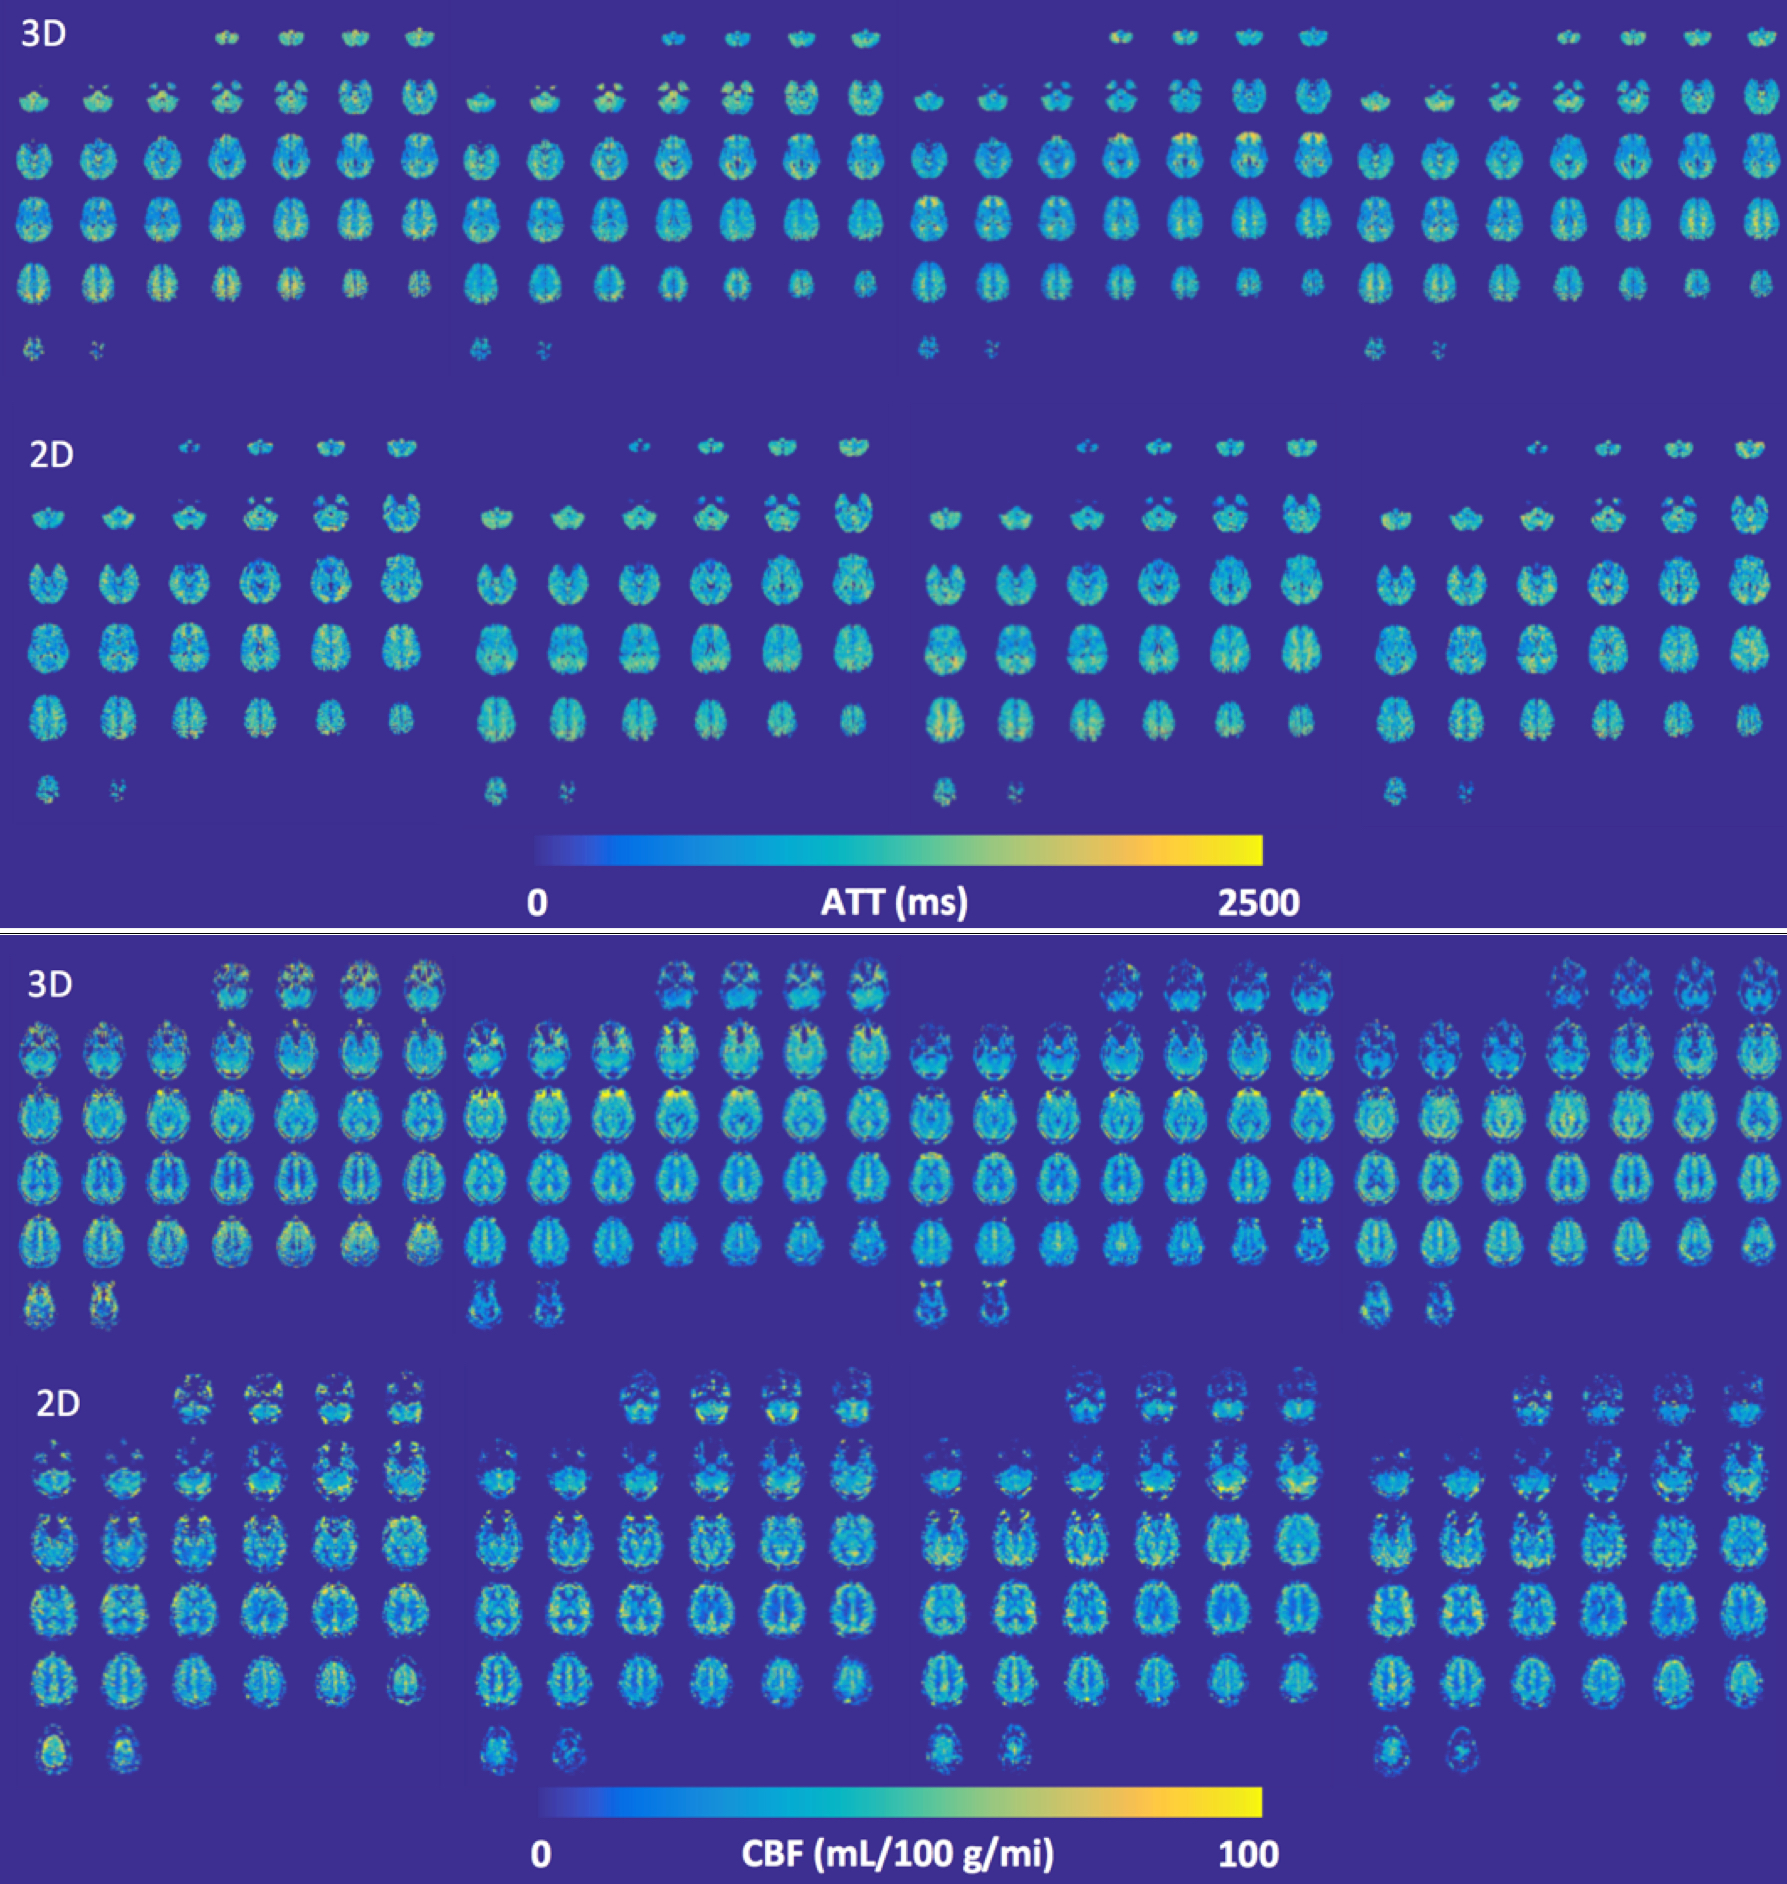
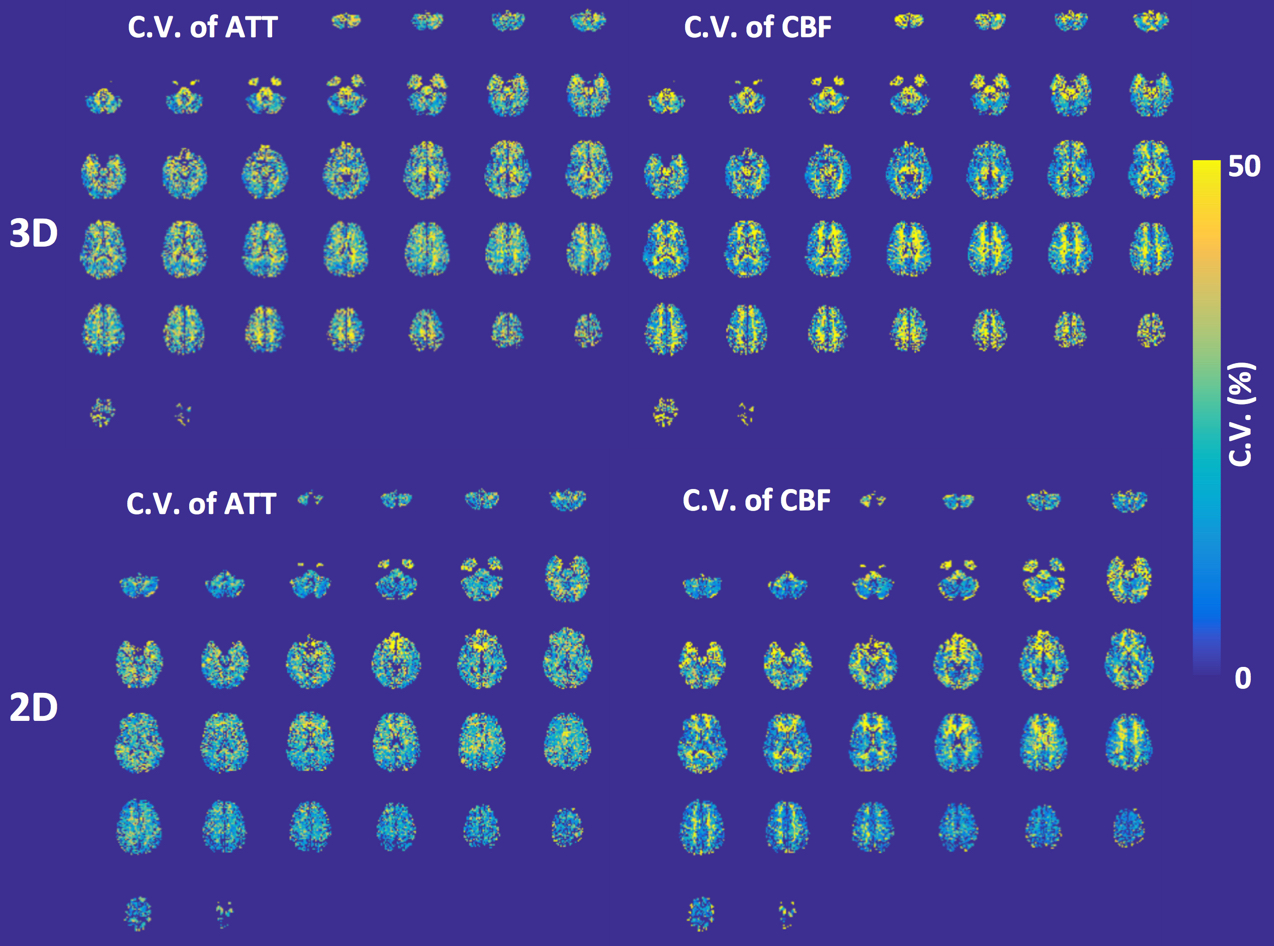
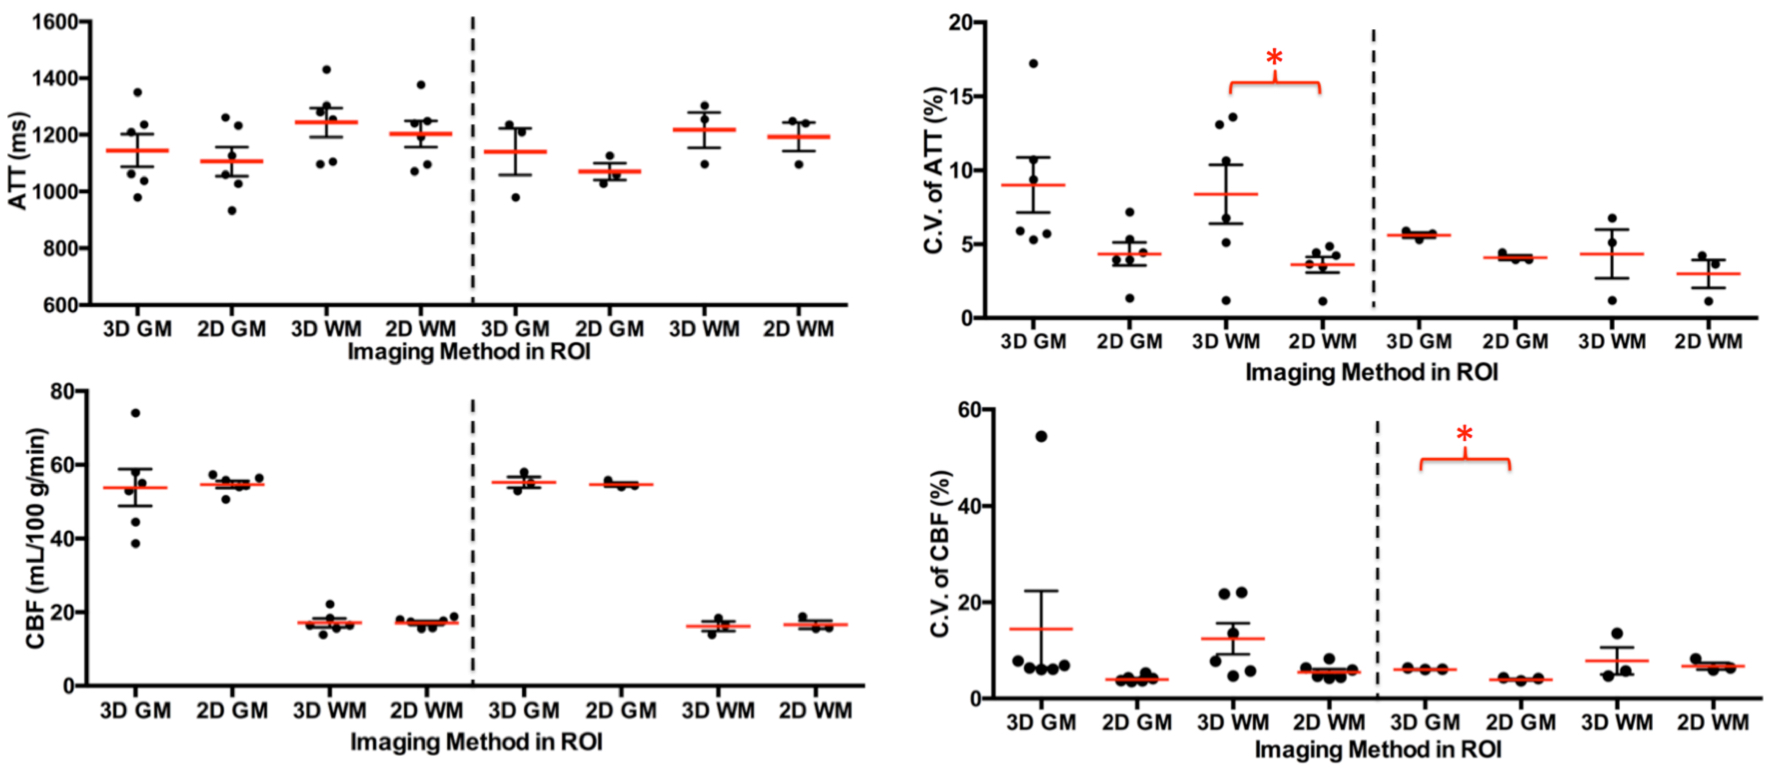
The ATT, CBF, and corresponding C.V. maps from one representative subject are presented in Figures 1 and 2. Figure 3 shows the means of four ATT, CBF and C.V. measurements within grey and white matter ROIs from 6 subjects, as well as those from 3 subjects whose 3D GRASE data have satisfactory quality. Statistical analyses found significant differences between the two methods in C.V. measurements for WM ATT from 6 subjects and GM CBF from 3 subjects. The mean CBF and ATT values in gray and white matter are not significantly different between 2D and 3D acquisitions. These results suggest that 2D MB-EPI can provide comparable but more reproducible ATT and CBF estimates than 3D GRASE. This study also indicated that compared to 2D MB-EPI, segmented 3D GRASE is more sensitive to subject motion. The segmented acquisition and limited number of measurements for 3D GRASE increased the chance of data loss. 3D GRASE can be superior to 2D MB-EPI for imaging studies that allow for a longer scan time or in a single delay acquisition.
The total acquisition time for the pilot study is about 4 and half minutes. However, the time budget for the HCP ASL acquisition is 4 minutes, which will require further reducing the number of perfusion volumes if the image resolution remains the same. For the 2D acquisition with partial Fourier, the total number of perfusion volumes will be reduced to 33 plus 2 M0 images (4, 5, 6, 8, and 10 for five delays). For 3D GRASE with the same segments, a total of 6 perfusion volumes plus one control image can be acquired (1, 1, 1, 1, and 2 for five delays).
Conclusions
Compared to 3D GRASE, 2D MB-EPI is less sensitive to subject motion, provided comparable but more reproducible ATT and CBF estimates, and suffered less from data loss. 2D MB-EPI appears promising for multi-delay PCASL imaging, especially with limited imaging time and where higher spatial resolution is of interest.Acknowledgements
P41 EB015894, P30 ICC and Human Connectome Project (1U54 MH091657), UMF0003900, and UL1TR000114. The content is solely the responsibility of the authors and does not necessarily represent the official views of the National Institutes of Health.References
1. Detre JA, Leigh JS, Williams DS, Koretsky AP (1992) Perfusion imaging. Magn Reson Med 23:37-45.
2. Dai W, Robson PM, Shankaranarayanan A, Alsop DC. Reduced resolution transit delay prescan for quantitative continuous arterial spin labeling perfusion imaging. Magn Reson Med. 2012 May;67(5):1252-65.
3. Alsop DC, Detre JA, Golay X, Gunther M, Hendrikse J, Hernandez-Garcia L, Lu H, Macintosh BJ, Parkes LM, Smits M, van Osch MJ, Wang DJ, Wong EC, Zaharchuk G (2014) Recommended implementation of arterial spin-labeled perfusion MRI for clinical applications: A consensus of the ISMRM perfusion study group and the European consortium for ASL in dementia. Magn Reson Med.
4. Li X, Wang D, Auerbach EJ, Moeller S, Ugurbil K, et al. Theoretical and experimental evaluation of multi-band EPI for high-resolution whole brain pCASL Imaging. Neuroimage. 2015 Feb 1;106:170-81.
5. Wang DJ, Alger JR, Qiao JX, Gunther M, Pope WB, Saver JL, Salamon N, Liebeskind DS; UCLA Stroke Investigators. Multi-delay multi-parametric arterial spin-labeled perfusion MRI in acute ischemic stroke - Comparison with dynamic susceptibility contrast enhanced perfusion imaging. Neuroimage Clin. 2013 Jul 6;3:1-7.
Figures