3625
Automatic Planning for fast and robust Flow Territory Mapping1Philips Research, Hamburg, Germany, 2Philips Healthcare, Best, Netherlands
Synopsis
Super-Selective Pseudo-continuous Arterial Spin Labeling (pCASL) requires the labeling focus to be optimized to each artery of interest individually. This might be time-consuming especially for inexperienced users, and suboptimal results are possible as the labeling efficiency depends on the location of the labeling spot, as well as its angulation, which should be perpendicular to the artery. This study demonstrates an automatic planning approach for Super-Selective pCASL measurements in the major brain feeding vessels and subsequently compares the results to images acquired using a manual positioning of the labeling spot.
Introduction
Flow territory mapping based on Arterial Spin Labeling (ASL) has been proven to add valuable information in the diagnosis of various cerebrovascular diseases1,2. Existing approaches present individual merits and drawbacks. For instance, vessel-encoded pseudo-continuous arterial spin labeling (pCASL) allows simultaneous labeling of vessels, but is limited by the fact that all labeling landmarks must be co-planar, potentially resulting in loss of contrast between some territories3,4. Another approach named Super-Selective pCASL overcomes this problem, since the labeling focus is optimized to each artery of interest individually in comparable overall scan-time5,6. However, careful positioning of several labeling landmarks might be time-consuming especially for inexperienced users, and suboptimal results are possible since the labeling efficiency depends on the location of the labeling spot, as well as its angulation, which should be perpendicular to the artery. This study demonstrates an automatic planning approach for Super-Selective pCASL measurements in the major brain feeding vessels and subsequently compares the results to images acquired using a manual positioning of the labeling spot.Methods
MRI measurements were performed in five healthy volunteers on a 3T Achieva Scanner (Philips, Best, The Netherlands) using an 8-element head coil. The manual as well as automatic planning of the labeling spot was performed on the basis of a time-of-flight (TOF) MR angiography scan to visualize the vascular anatomy (FOV 200x200x84mm3, voxel size 1.5x1.5x1.5mm3, 3D fast-field echo acquisition, 18° flip angle and TR/TE was 23/3.5ms, 1:03min acquisition time). Manual planning has been performed by an expert with >10 years of experience. Automated planning of the labeling focus and its angulation with respect to the selected artery was done by utilizing library functions from a commercial SW package for vessel segmentation and tracking7. Seeds for vessel tracking were extracted inside a vessel-specific ROI, which has been adapted to the subject’s TOF scan by linear registration to an anatomical atlas. Since highly tortuous segments of a vessel are not suitable for pCASL labeling2, the degree of linearity for each candidate position of the labeling spot has been estimated via the spatial difference to an average local line. Finally, the candidate with the highest degree of linearity has been selected for positioning of the labeling focus. Flow territory mapping was performed in the Internal Carotid Arteries (ICA) and Vertebral Arteries (VA) with both methods and planning time was measured accordingly. Tagging and scanning parameters for Super-Selective pCASL followed the requirements in the ASL consensus paper8 with 4-pulse background suppression and a segmented 3D GraSE read-out (FOV 240x240x96mm3, voxel size 2.75x2.75x6mm3, EPI factor 7, TR/TE 4025/11ms, labeling duration was 1.8s, postlabeling delay 2.0s; scan time 3:03min per studied vessel). For quantitative analysis of the data, the labeling efficiency was calculated by normalizing the signal intensities of the flow territory images with respect to the signal intensity of additionally performed nonselective pCASL scans.Results
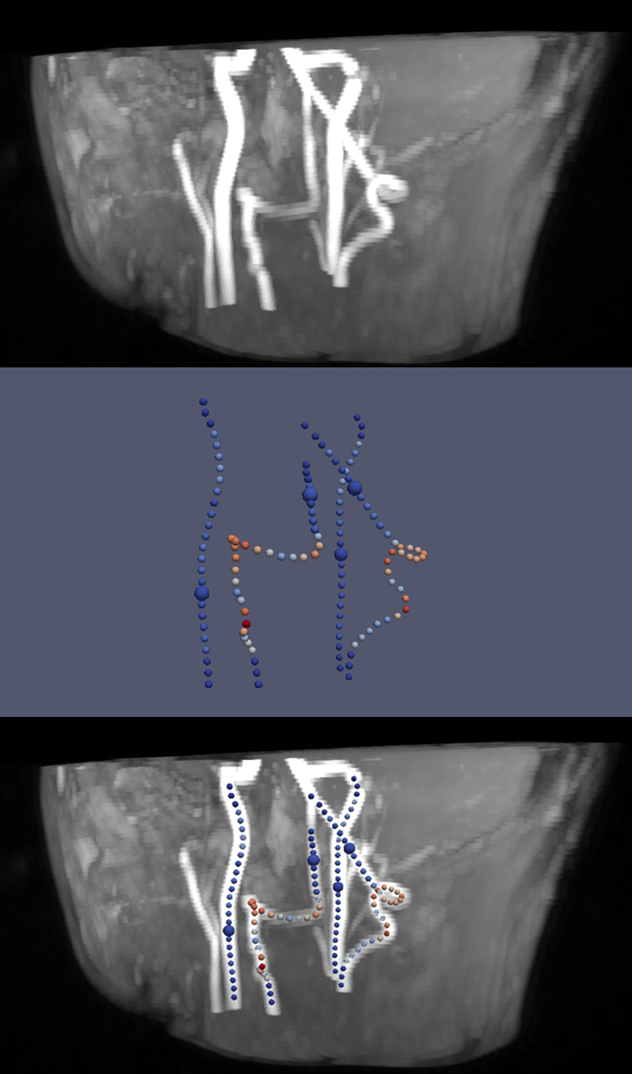
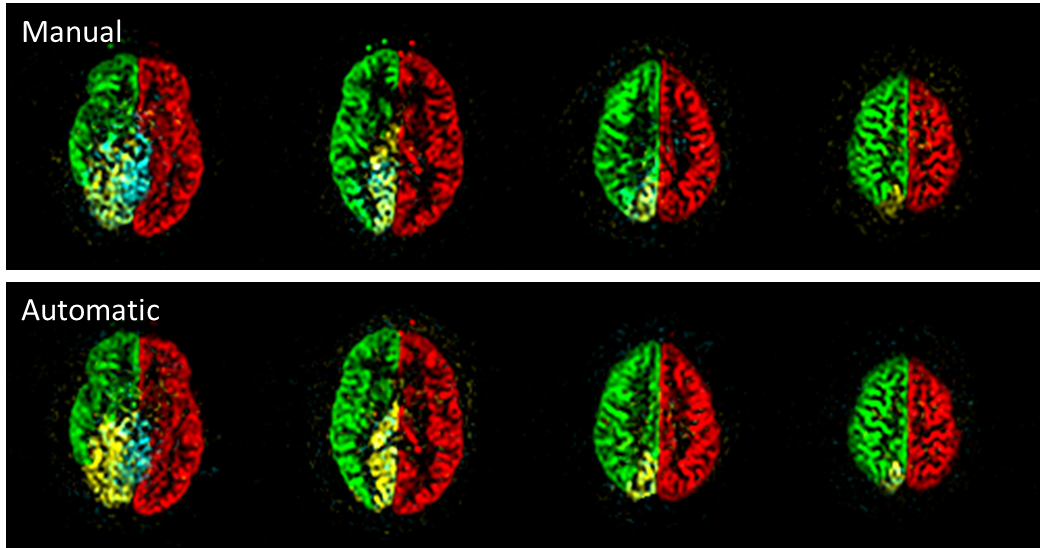
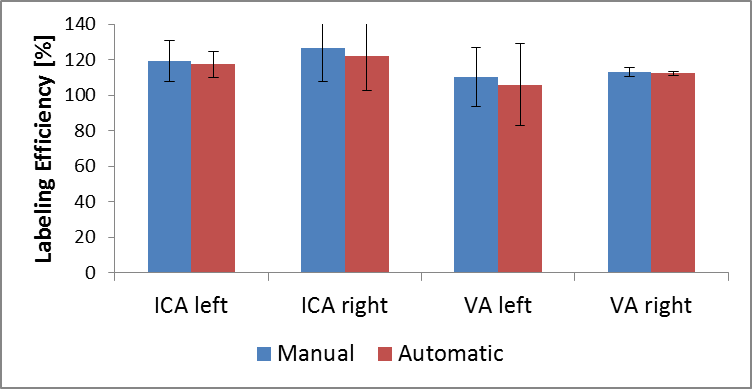
Figure 1 presents the analyzed vessel architecture and calculated positions of the labeling spots for one volunteer. Similar flow territory maps were acquired with both automatic and manual planning (figure 2). This is also reflected in the quantitative analysis of the data (figure 3). Similar labeling efficiency can be achieved with automatic planning compared to the manual procedure. Notably, signal intensities are even increased compared to the non-selective pCASL scan (labeling efficiency > 100%). The average time for positioning of the labeling spot in the 4 major brain feeding arteries was 103.4±5.2s for the manual and 47.3±6.1s for the automatic procedure per volunteer.
Discussion
The usage of Super-Selective pCASL in clinical routine scan protocols is impeded due to user-dependent and time-consuming planning of the labeling focus although initial applications demonstrate great potential1,2. The presented approach to automatically plan Super-Selective pCASL measurements seems promising as overall time for proper positioning of the labeling spot is decreased compared to the manual planning of an expert. Additionally, higher labeling efficiency compared to non-selective pCASL can be achieved as the labeling focus is adapted to each artery individually. However, so far, the algorithm was only applied in healthy volunteers without known diseases of the cerebrovascular system. Automatic analysis of the vessel architecture might require more advanced local image analysis techniques in patients with arterial stenosis and occlusions.Conclusion
The presented approach to automatically plan the labeling focus in Super-Selective pCASL makes it possible to achieve similar image quality for flow territory maps in decreased planning time when compared to manual positioning. However, a more detailed validation of this method is required in order to enable fast and robust flow territory mapping without user-interaction in a clinical environment.Acknowledgements
No acknowledgement found.References
1. Helle M, Rüfer S, van Osch MJ, Nabavi A, Alfke K, Norris DG, Jansen O. Superselective arterial spin labeling applied for flow territory mapping in various cerebrovascular diseases. J Magn Reson Imaging. 2013;38:496-503.
2. Hartkamp NS, Petersen ET, De Vis JB, Bokkers RP, Hendrikse J. Mapping of cerebral perfusion territories using territorial arterial spin labeling: techniques and clinical application. NMR Biomed 2013;26:901-12.
3. Wong EC. Vessel-encoded arterial spin-labeling using pseudocontinuous tagging. Magn Reson Med 2007;58:1086–1091.
4. Gevers S, Bokkers RP, Hendrikse J, Majoie CB, Kies DA, Teeuwisse WM, Nederveen AJ, van Osch MJ. Robustness and reproducibility of flow territories defined by planning-free vessel-encoded pseudocontinuous arterial spin-labeling. AJNR Am J Neuroradiol 2012;33:E21-E25.
5. Helle M, Norris DG, Rufer S, Alfke K, Jansen O, van Osch MJP. Superselective pseudocontinuous arterial spin labeling. Magn Reson Med 2010;64:777-786.
6. Hartkamp NS, Helle M, Chappell MA, Okell TW, Hendrikse J, Bokkers RP, van Osch MJ. Validation of planning-free vessel-encoded pseudo-continuous arterial spin labeling MR imaging as territorial-ASL strategy by comparison to super-selective p-CASL MRI. Magn Reson Med. 2014;71:2059-70.
7. Bescós J, Sonnemans J, Habets R, Peters J, van den Bosch H, Leiner T. Vessel Explorer: A tool for quantitative measurements in CT and MR angiography. Medicamundi 2009:53/3.
8. Alsop, D.C., et al. Recommended implementation of arterial spin-labeled perfusion MRI for clinical applications: A consensus of the ISMRM perfusion study group and the European consortium for ASL in dementia. Magn Reson Med 2015;73:102-16.
Figures