3623
The influence of acquisition parameters on CBF and BOLD sensitivity in 3 and 7 Tesla ASL fMRI1Maastricht University, Maastricht, Netherlands, 2Application Development, Siemens, Erlangen, Germany
Synopsis
Arterial spin labeling (ASL) measures cerebral blood flow (CBF) non-invasively. Compared to the BOLD signal, CBF is quantitative and more directly linked to neural activation, albeit with lower SNR. Due to increased SNR and T1 relaxation time, ultra-high field MRI promises benefits for ASL. However, technical challenges remain to exploit its full potential. Here, we compared 3T and 7T ASL implementations and studied the influence of labeling schemes, resolution, parallel imaging, and field strength on the CBF and BOLD functional contrast. We found 3T pCASL being advantageous for low-resolution and 7T FAIR for high-resolution and acquisitions utilizing parallel imaging.
Introduction
Arterial spin labeling (ASL) is a non-invasive MRI technique, which quantitatively measures cerebral blood flow (CBF) by magnetically labeling water spins in the arterial blood. With respect to the BOLD signal, CBF is quantitative marker of brain physiology and has higher spatial specificity and reproducibility. However, ASL also presents some drawbacks, such as low signal-to-noise ratio (SNR). It is commonly accepted that BOLD fMRI benefits from ultra-high field (UHF, 7T or higher)1-3 and there are indications that UHF is advantageous for ASL because of the SNR boost and the longitudinal relaxation time increase4-6. Nevertheless, technical challenges remain, such as B0- and B1-inhomogeneities, temporal resolution, and SAR limitations.
The aim of this study was to investigate the effects of labeling scheme, field strength, parallel imaging and spatial resolution in view of functional studies using ASL to simultaneously acquire CBF and BOLD signal.
Methods
Two experiments were performed, including nine and eight healthy volunteers (Experiment 1 and 2, respectively) with normal or corrected-to-normal vision. Written informed consent was obtained from all participants.
Measurements were performed on a MAGNETOM Prisma 3T and a whole-body 7T research scanner (Siemens Healthcare, Erlangen) using prototype sequences and a 64- and 32-channel head coil, respectively. Half of the participants were first scanned at the 3T and immediately afterwards at the 7T, and vice versa. To improve labeling efficiency at the 7T, dielectric pads (18x18 cm2) were positioned next to the temporal lobes7.
In Experiment 1, three ASL schemes, namely FAIR QUIPSS II (3T_FAIR)8, PICORE Q2TIPS (3T_PQ2T)9 and pCASL (3T_pCASL)10,11, were acquired at the 3T and one ASL scheme, namely FAIR QUIPSS II (7T_FAIR) with tr-FOCI inversion pulse12, at the 7T. For each sequence, 13 slices covering the visual and auditory cortices were acquired at a resolution of 3.0mm isotropic (TR=2.5s, TE=13ms, TI1/TI1=700/1800ms or labeling/PLD=975/1005ms, and Partial Fourier 6/8). Additionally, a pCASL sequence with parameters following the recommendations of the ASL white paper13 (WHITEP; TR=3.6s, labeling/PLD=1500/1580ms) was acquired as reference for the mean GM perfusion values. One 4 min baseline perfusion run (and relative M0 image) was acquired for each ASL scheme.
In Experiment 2, 3T_FAIR, 3T_pCASL, and 7T_FAIR were acquired using GRAPPA 3 to allow dual-echo acquisition (TE=13 and 37ms; only 1st echo data are presented here) and in-plane resolution of 1.5, 2.0, 2.5, and 3.0mm (slice thickness=3.0mm, TR=2.5s, TI1/TI2=700/1800ms or labeling/PLD=925/875ms). Functional runs were acquired while participants were attending to a visual stimulation paradigm (hemifield 8Hz-flickering-checkerboard presented in 8 blocks of 25s stimulation and 35s rest) and fixating on a cross at the center of the screen.
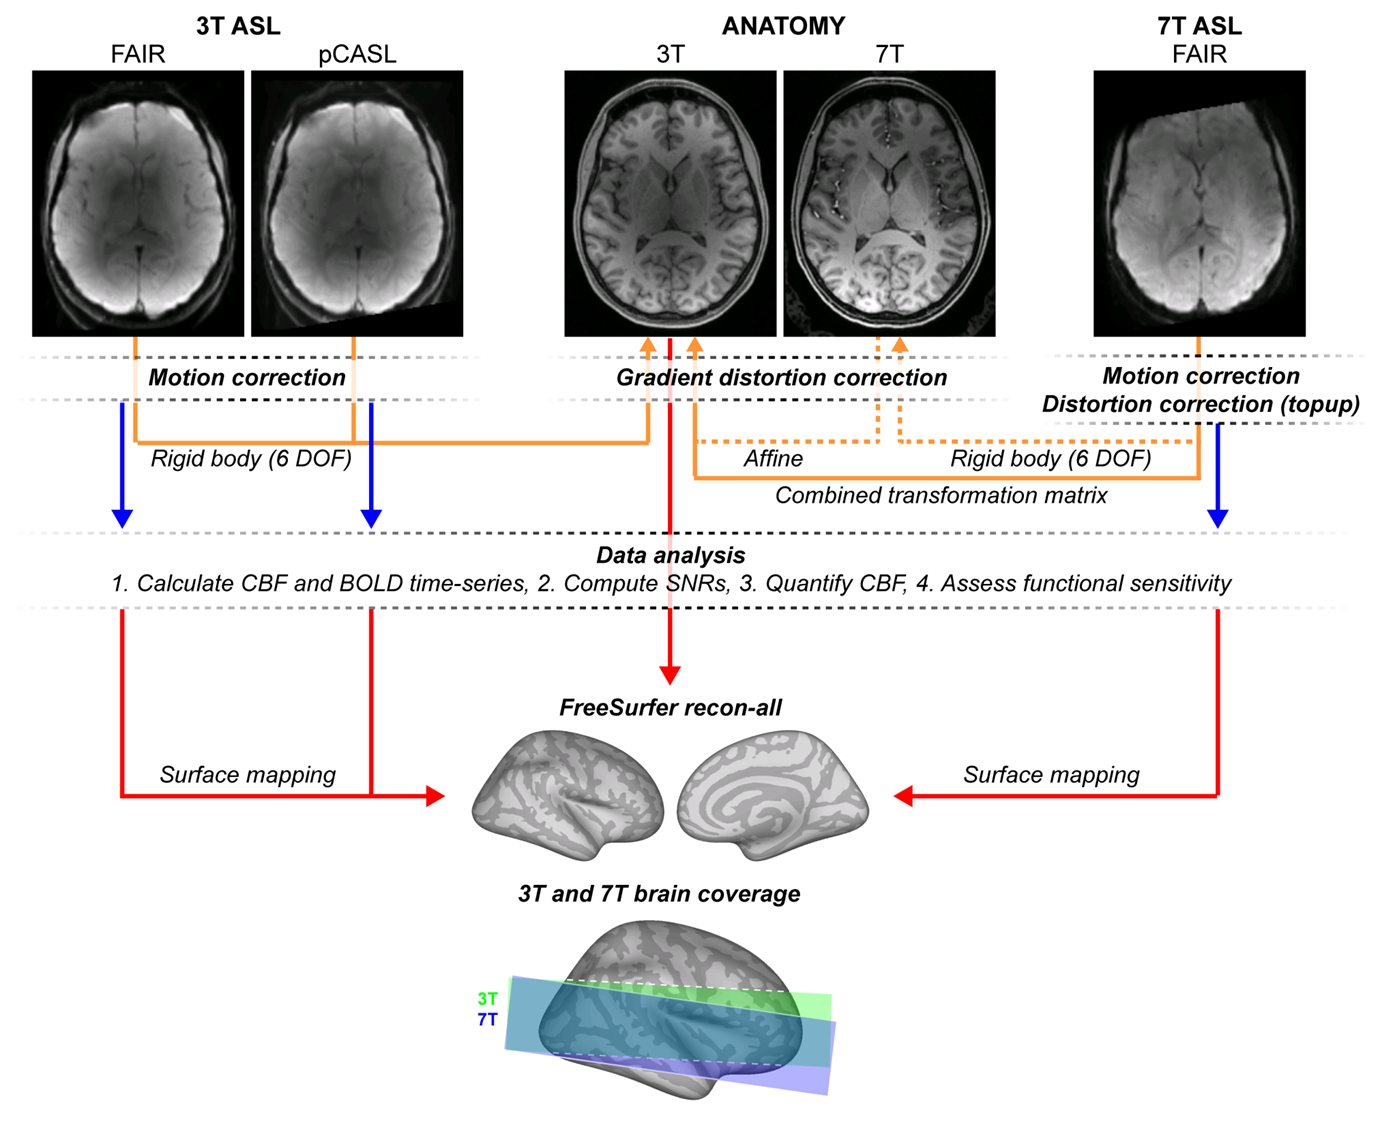
CBF and BOLD signal qualities were evaluated using (see Figure 1): perfusion temporal SNR (tSNR; i.e., mean/std of the perfusion time-course), control tSNR (i.e., mean/std of the control time-series), perfusion SNR14,15, and full GLM ASL analysis16,17.
Results and Discussion
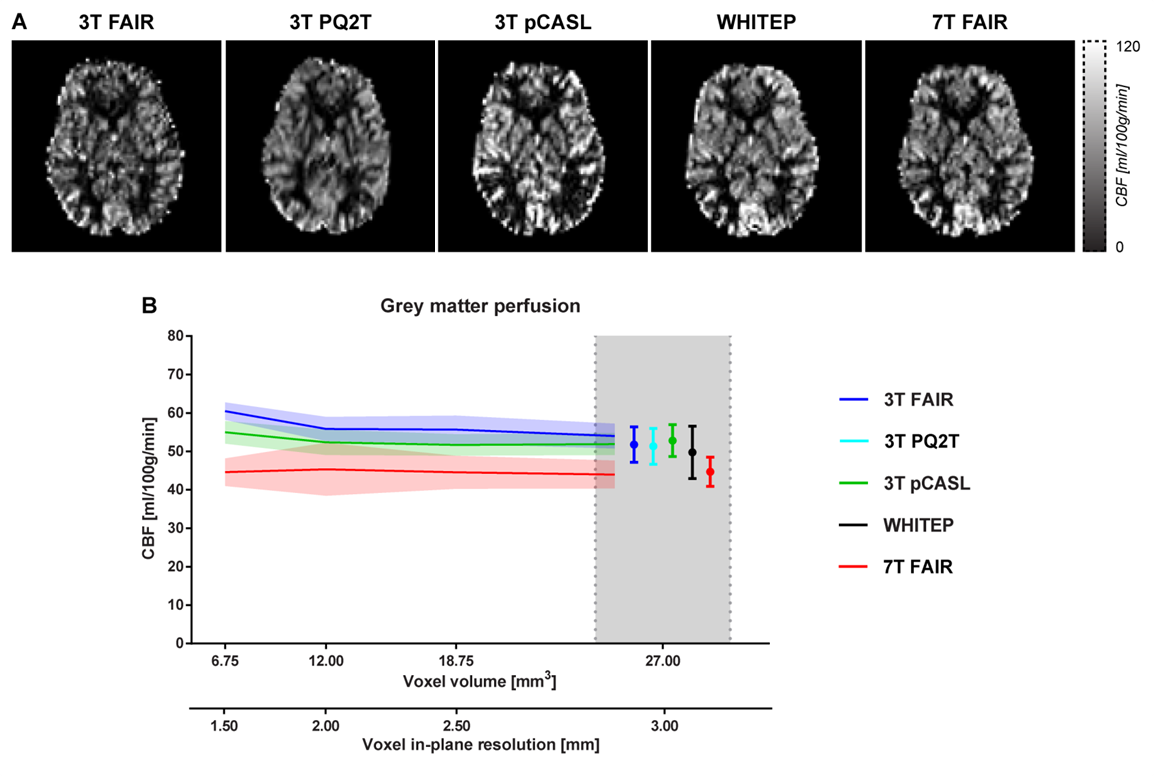
All the perfusion maps (Figure 2A) similarly show clear contrast between GM and white matter regions. However, they present some local differences (e.g., bright sagittal sinus for the FAIR schemes and sparse perfusion map posteriorly for 3T_pCASL), and the GM perfusion signal is generally lower in the 7T_FAIR map. Importantly, the mean GM CBF was relatively independent from the voxel resolution and use of parallel imaging (Figure 2B).
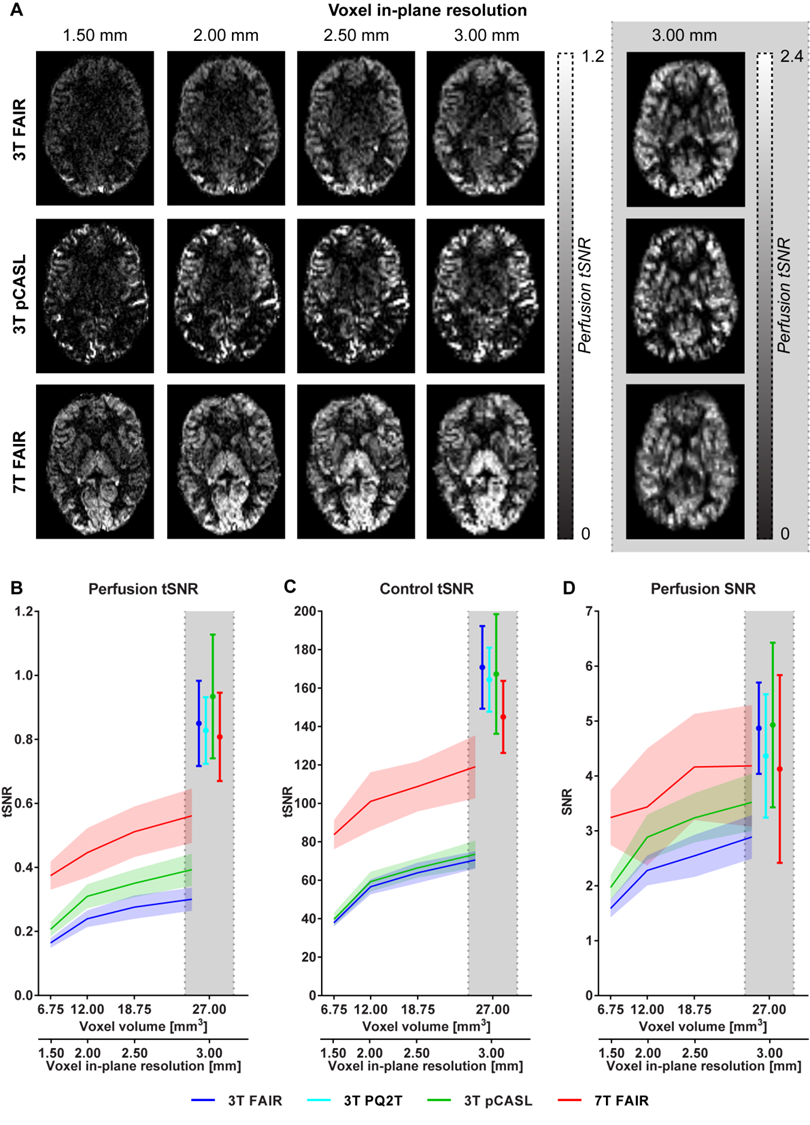
As expected, perfusion tSNR increases with increasing voxel volume and has lower values for acquisitions using parallel imaging (Figure 3A-B). No significant differences in perfusion tSNR were observed for Experiment 1. In contrast, 7T ASL yields higher perfusion tSNR values than 3T at all voxel sizes investigated when parallel imaging is used (p<0.001 for all comparisons; Experiment 2). Within the 3T ASL sequences, pCASL has higher perfusion tSNR than FAIR (p<0.001 for all resolutions). Similar behavior was observed for the perfusion SNR (Figure 3D), but with reduced differences between the performance with and without parallel imaging.
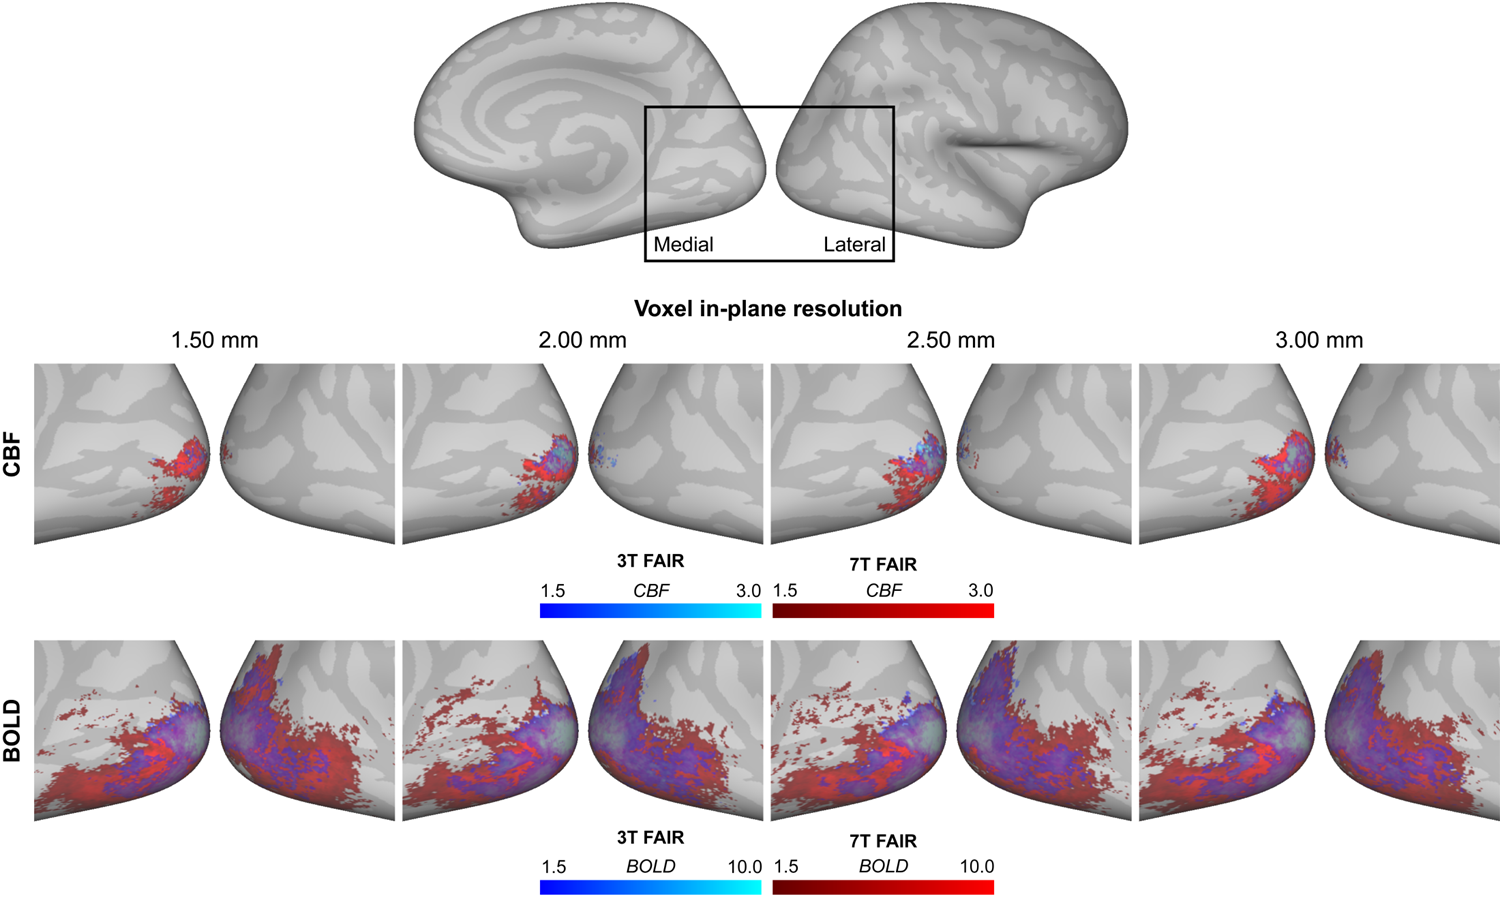
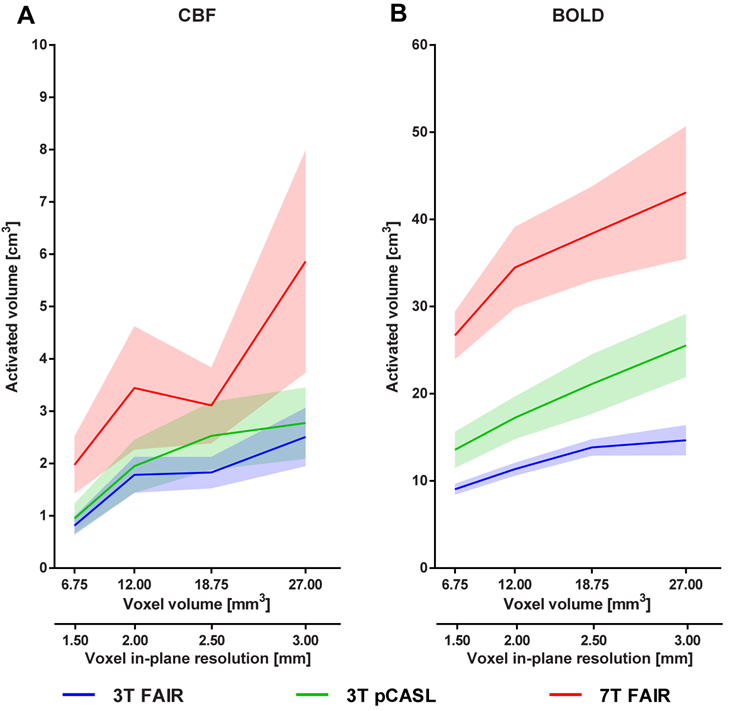
The stimulation resulted in consistent activation of the right visual cortex, with BOLD activation being more widespread and having higher Z-statistics values than the CBF activation (Figure 4 and 5). The activated volume was larger for larger voxel volumes, for 7T_FAIR with respect to both 3T acquisitions, and for 3T_pCASL compared to 3T_FAIR (for CBF/BOLD: n.s./p=0.011).
Conclusions
We investigated the effect of labeling scheme, spatial resolution, and parallel imaging on ASL sensitivity for both baseline perfusion and simultaneous CBF and BOLD signal functional measurements. On the basis of our results, we recommend 3T_FAIR and 3T_pCASL for imaging at low spatial resolution without acceleration, while 7T_FAIR for high resolution acquisitions or such using parallel imaging.Acknowledgements
No acknowledgement found.References
1. Donahue, M.J., et al., Blood oxygenation level-dependent (BOLD) total and extravascular signal changes and DeltaR2* in human visual cortex at 1.5, 3.0 and 7.0 T. NMR Biomed, 2011. 24(1): p. 25-34.
2. Uludag, K., B. Muller-Bierl, and K. Ugurbil, An integrative model for neuronal activity-induced signal changes for gradient and spin echo functional imaging. Neuroimage, 2009. 48(1): p. 150-65.
3. van der Zwaag, W., et al., fMRI at 1.5, 3 and 7 T: characterising BOLD signal changes. Neuroimage, 2009. 47(4): p. 1425-34.
4. Gardener, A.G., P.A. Gowland, and S.T. Francis, Implementation of quantitative perfusion imaging using pulsed arterial spin labeling at ultra-high field. Magn Reson Med, 2009. 61(4): p. 874-82.
5. Gardener, A.G. and P. Jezzard, Investigating white matter perfusion using optimal sampling strategy arterial spin labeling at 7 Tesla. Magn Reson Med, 2015. 73(6): p. 2243-8.
6. Ivanov, D., et al., Optimization of simultaneous multislice EPI for concurrent functional perfusion and BOLD signal measurements at 7T. Magn Reson Med, 2016.
7. Teeuwisse, W.M., W.M. Brink, and A.G. Webb, Quantitative assessment of the effects of high-permittivity pads in 7 Tesla MRI of the brain. Magn Reson Med, 2012. 67(5): p. 1285-93.
8. Wong, E.C., R.B. Buxton, and L.R. Frank, Quantitative imaging of perfusion using a single subtraction (QUIPSS and QUIPSS II). Magn Reson Med, 1998. 39(5): p. 702-8.
9. Luh, W.M., et al., QUIPSS II with thin-slice TI1 periodic saturation: a method for improving accuracy of quantitative perfusion imaging using pulsed arterial spin labeling. Magn Reson Med, 1999. 41(6): p. 1246-54.
10. Dai, W., et al., Continuous flow-driven inversion for arterial spin labeling using pulsed radio frequency and gradient fields. Magn Reson Med, 2008. 60(6): p. 1488-97.
11. Wu, W.C., et al., A theoretical and experimental investigation of the tagging efficiency of pseudocontinuous arterial spin labeling. Magn Reson Med, 2007. 58(5): p. 1020-7.
12. Hurley, A.C., et al., Tailored RF pulse for magnetization inversion at ultrahigh field. Magn Reson Med, 2010. 63(1): p. 51-8.
13. Alsop, D.C., et al., Recommended implementation of arterial spin-labeled perfusion MRI for clinical applications: A consensus of the ISMRM perfusion study group and the European consortium for ASL in dementia. Magn Reson Med, 2015. 73(1): p. spcone.
14. Feinberg, D.A., A. Beckett, and L. Chen, Arterial spin labeling with simultaneous multi-slice echo planar imaging. Magn Reson Med, 2013. 70(6): p. 1500-6.
15. Glover, G.H. and S. Lai, Self-navigated spiral fMRI: interleaved versus single-shot. Magn Reson Med, 1998. 39(3): p. 361-8.
16. Hernandez-Garcia, L., H. Jahanian, and D.B. Rowe, Quantitative analysis of arterial spin labeling FMRI data using a general linear model. Magn Reson Imaging, 2010. 28(7): p. 919-27.
17. Mumford, J.A., et al., Estimation efficiency and statistical power in arterial spin labeling fMRI. Neuroimage, 2006. 33(1): p. 103-14.
Figures