3622
Improved Calculation of Arterial Blood Equilibrium Magnetization in Arterial Spin Labeling1Department of Medical Radiation Physics, Lund University, Lund, Sweden, 2Diagnostic Radiology, Lund University, Lund, Sweden, 3Lund University Bioimaging Center, Lund University, Lund, Sweden, 4Department of Radiology (Adjunct), Johns Hopkins School of Medicine, Baltimore, United States, 5Danish Research Centre for Magnetic Resonance, Copenhagen University Hospital Hvidovre, Copenhagen, Denmark
Synopsis
The calibration factor (equilibrium magnetization of arterial blood) in arterial spin labeling is usually calculated by dividing a PD image with a constant brain-blood partition coefficient, $$$\lambda$$$. A more accurate approach would be to divide a map corresponding to the PD of the perfused parenchymal tissue with a $$$\lambda$$$ map (i.e, taking into account different values of $$$\lambda$$$ in different tissue types). In this work, we demonstrate how this can be achieved using partial volume (PV) estimates. In vivo results are demonstrated and compared with the conventional method.
Purpose
To suggest an improved new way to estimate the equilibrium magnetization of arterial blood ($$$M_{0a}$$$) in arterial spin labeling (ASL).Introduction
$$$M_{0a}$$$ is the central calibration factor for converting perfusion weighted signal to quantitative perfusion values in ASL [1]. The most common approach to estimate $$$M_{0a}$$$ is by dividing the equilibrium voxel magnetization, $$$M_0$$$, by the brain-blood partition coefficient for water, $$$\lambda$$$. A separate PD-weighted scan is often used for $$$M_0$$$, together with an average whole-brain partition coefficient, $$$\bar{\lambda}=\:$$$0.9 ml/g [1]. The advantage of calculating voxel-wise $$$M_{0a}$$$ values is that T2(*) contrast and B1+/- inhomogeneities are automatically corrected for in the perfusion calculation [2].
A drawback of this conventional approach is that the $$$M_{0a}$$$ map will be PD-weighted, leading to bias (inverse PD-weighting) in the perfusion maps [3], mainly because differences in $$$\lambda$$$ between gray matter (GM) and white matter (WM) are not accounted for [3,4]. Furthermore, since the conventional $$$M_{0a}$$$ calculation does not account for the fact that cerebrospinal fluid (CSF) is non-perfused, bias can also arise due to partial volume of CSF in the voxel (e.g., in cortical GM). In other words, $$$\lambda$$$ is proportional to the voxel-wise tracer distribution volume [5], which is seldom taken into account in ASL. Hence, in this work, we exploit partial volume (PV) data for improved calculation of $$$M_{0a}$$$.
Methods
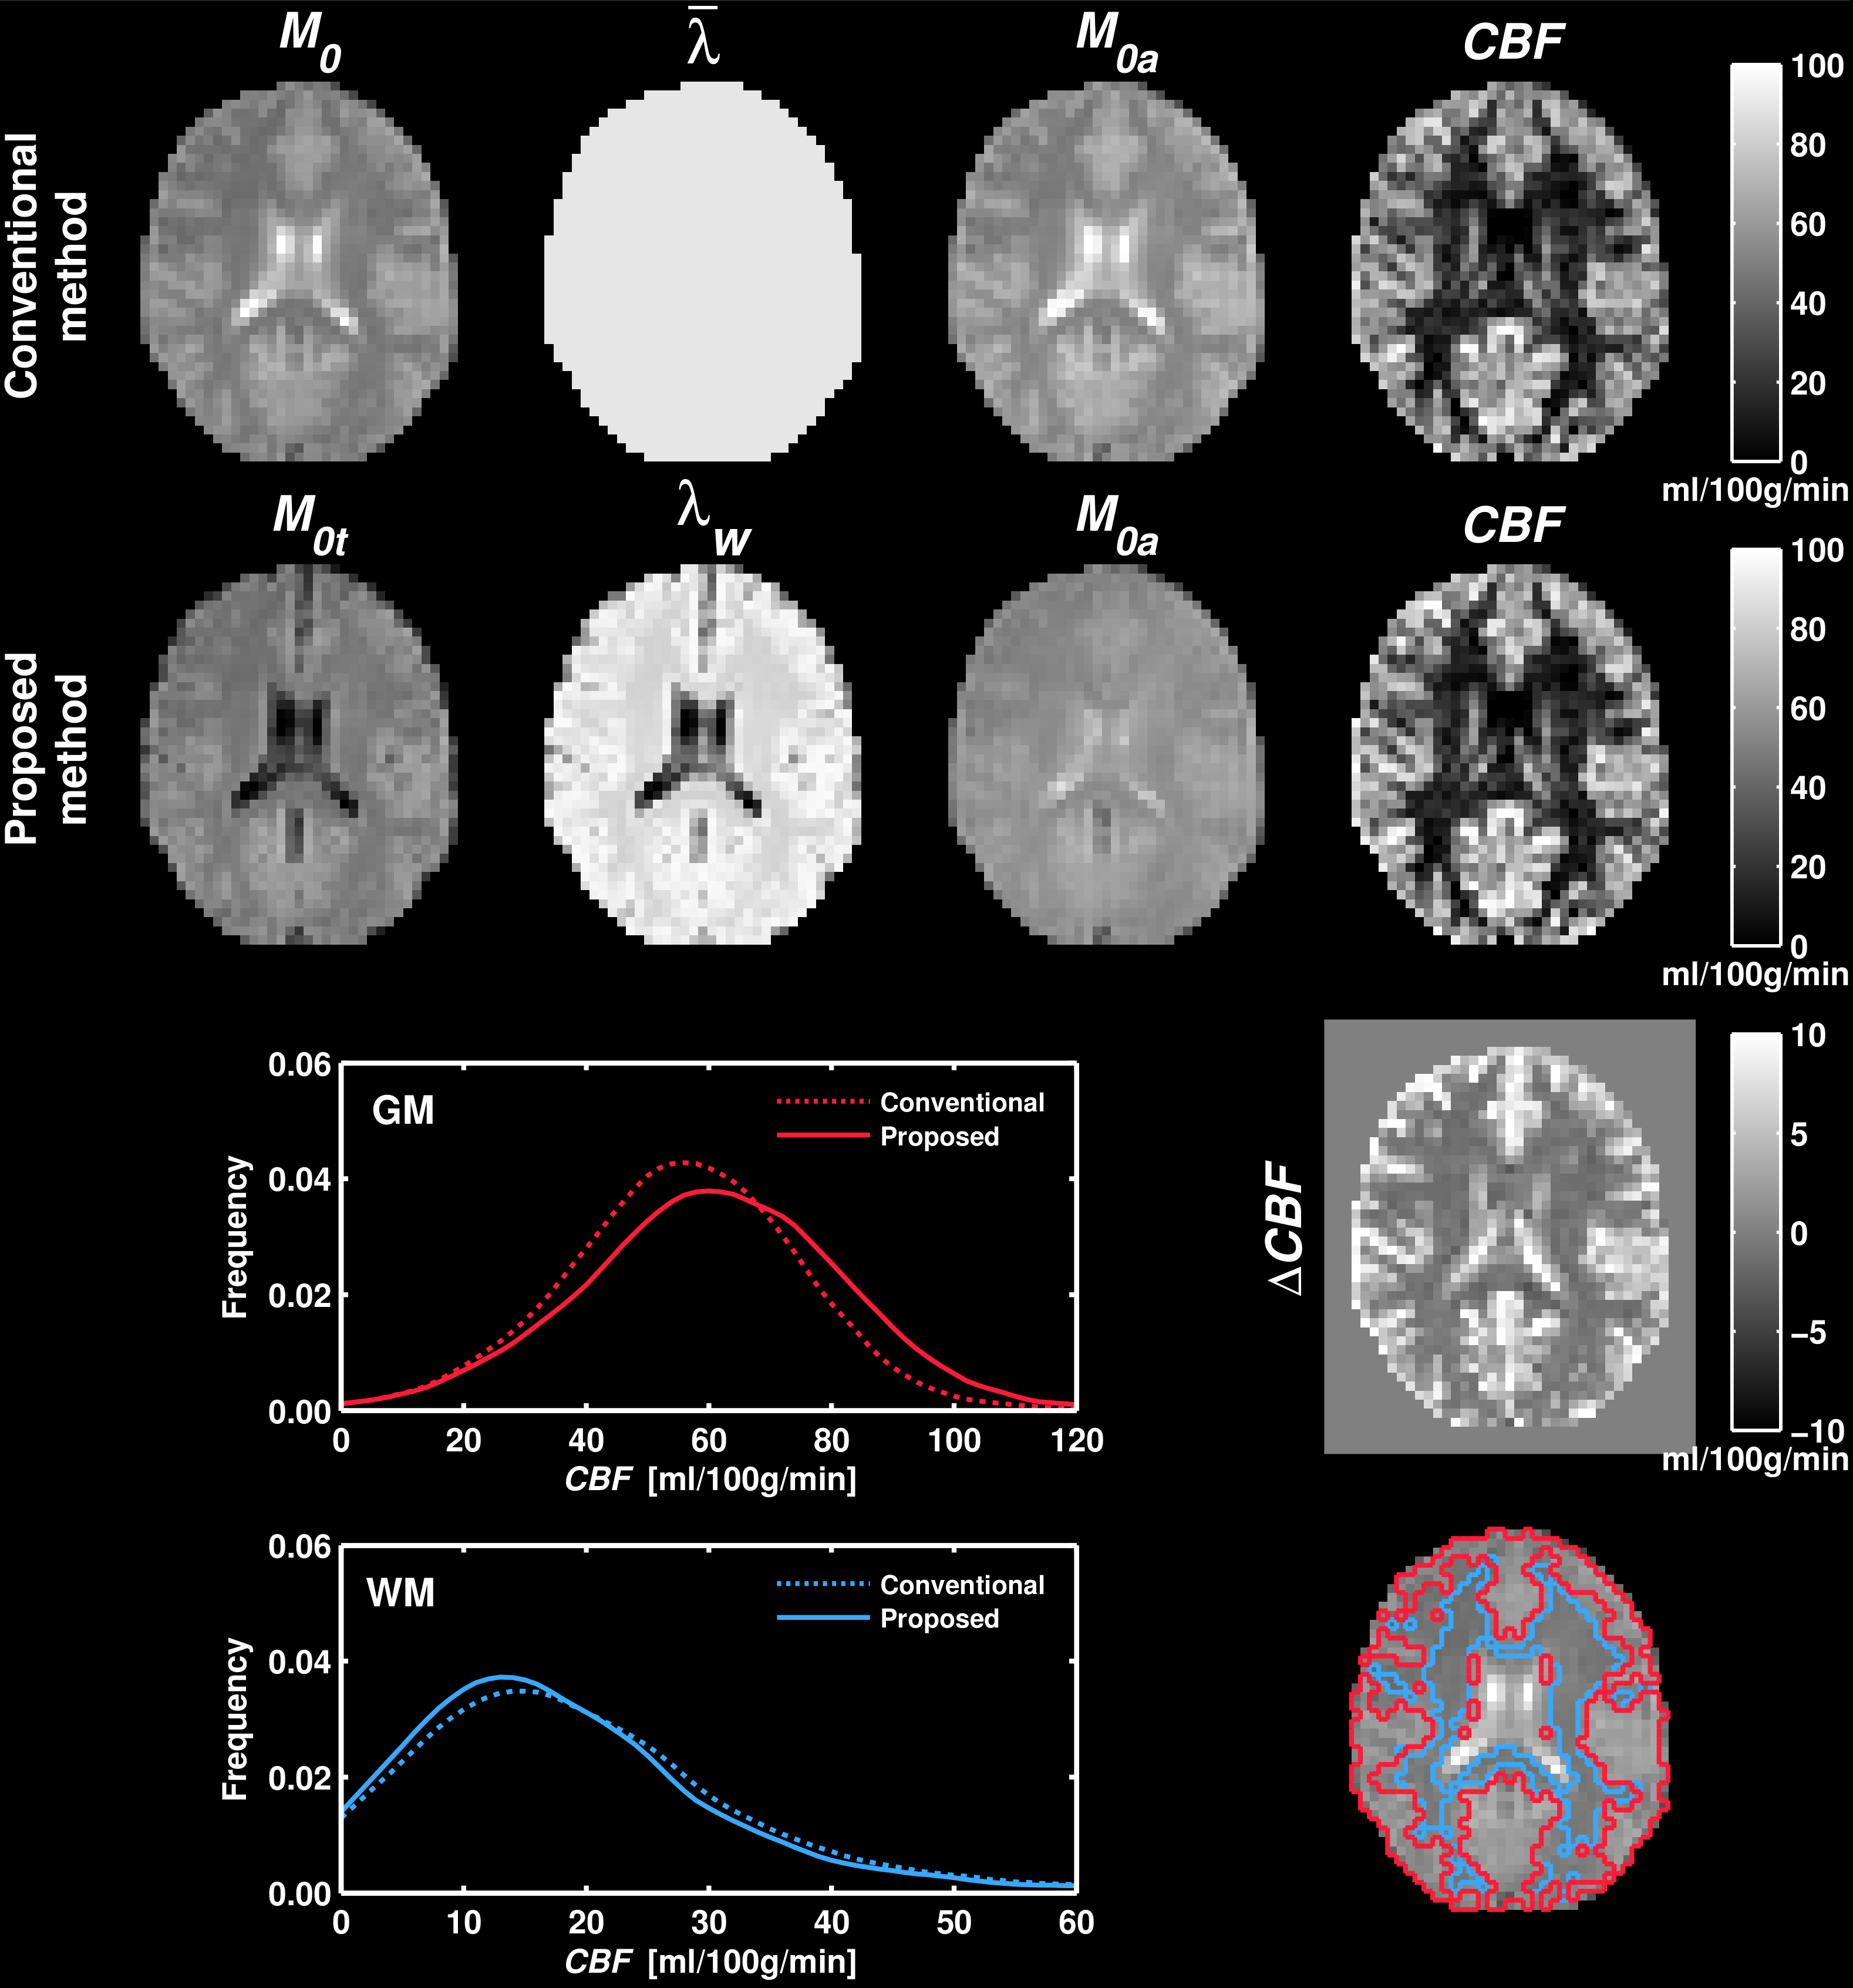
Acknowledging that the labeled water does not distribute in CSF ($$$\lambda_{CSF}=0$$$), the equilibrium magnetization of perfused parenchymal tissue was calculated as $$M_{0t}=M_0(1-m_{CSF})$$ where $$$m_{CSF}$$$ is the fractional magnetization of CSF [6]. A weighted $$$\lambda$$$ map was calculated according to $$λ_w=w_{GM}\lambda_{GM}+w_{WM}\lambda_{WM}$$ where $$$w_{GM}$$$ and $$$w_{WM}$$$ are the fractional weights of GM and WM [5,6]. Finally, $$$M_{0a}$$$ was calculated as $$$M_{0a}=M_{0t}/\lambda_w$$$. The $$$M_0$$$ map, as well as fractional magnetizations, weights and volumes ($$$v_i$$$), were acquired from saturation recovery data using the FRASIER approach [7] with the same readout as the ASL scan. $$$\lambda_{GM}=\:$$$0.98 ml/g and $$$\lambda_{WM}=\:$$$0.82 ml/g were taken from the literature [4].
Perfusion was calculated with the basic model [8], and results were compared with the conventional method (i.e., $$$M_{0a}=M_0/\bar{\lambda}$$$) using ROI analysis. GM and WM ROIs were obtained by thresholding PV values according to $$$v_i>\:$$$75% and performing morphological closing. The Wilcoxon signed rank test was used to test for differences between the methods, with mean ROI values constituting paired data points for each subject ($$$n=\:$$$7, $$$\alpha=\:$$$0.05).
Data acquisition was performed at 3T (Achieva, Philips Healthcare, Best, The Netherlands). Seven healthy subjects (4 M, mean age 33 y) gave written informed consent, and the study was approved by the local ethics committee. Pseudo-continuous ASL (PCASL) data were acquired using label duration = 1650 ms, post-label delay = 1550 ms, and averages = 29. PV data were acquired using nine saturation times. Both sequences used multi-slice single-shot EPI with 3.75×3.75×8 mm3 voxel size, 13 slices, and TR = 4000 ms.
Results
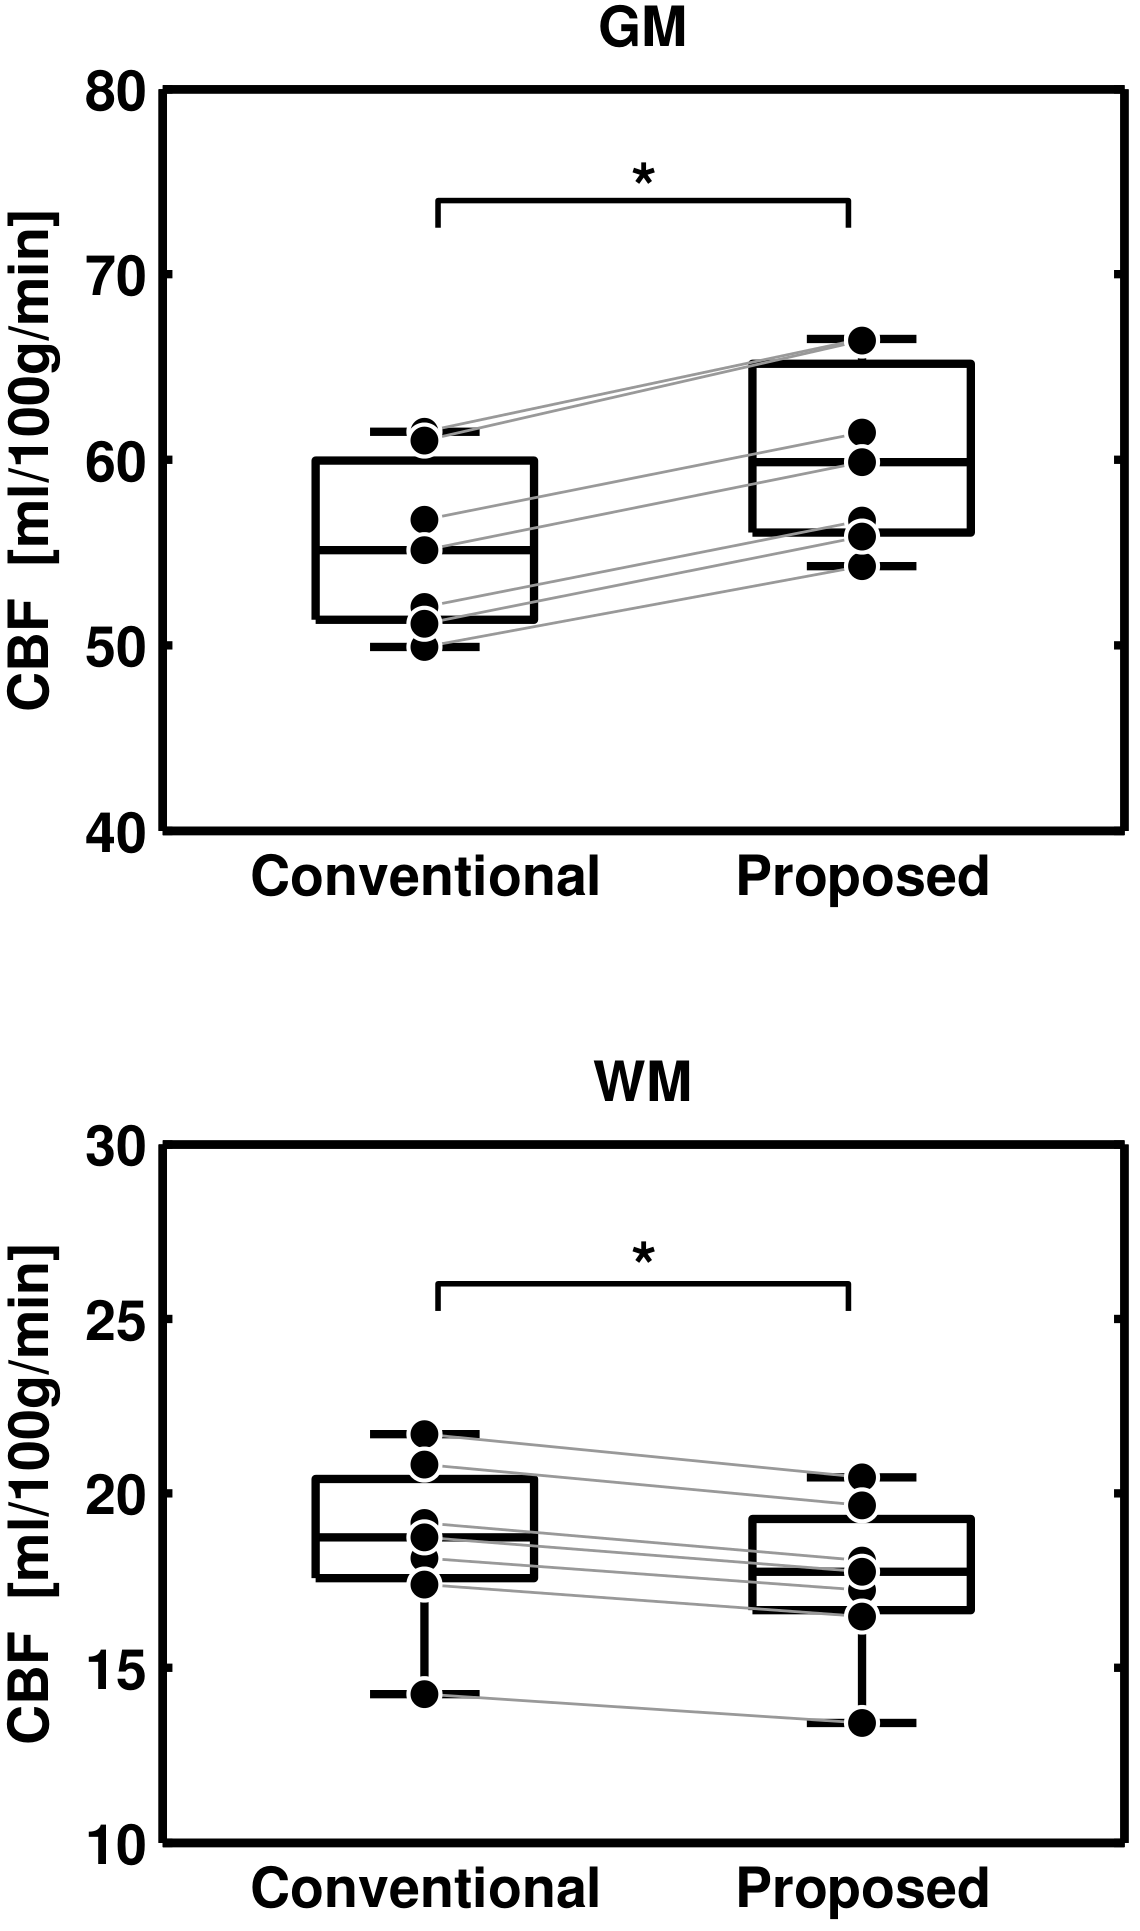
Example maps, as well as GM and WM perfusion distributions over all subjects, is shown in Figure 1. For the proposed method, the $$$M_{0a}$$$ map is more homogenous and the perfusion estimates are apparently higher in GM. Mean perfusion estimates in GM were 60.2 and 55.4 ml/100g/min (+8.7%) with the proposed and conventional method, respectively. The corresponding WM values were 17.8 and 18.8 ml/100g/min (-5.4%), respectively. Figure 2 visualizes the test for differences between the two methods. The proposed method yielded significantly higher perfusion values in GM and significantly lower perfusion values in WM.Discussion and Conclusion
With a similar objective, Dai et al. suggested to acquire a uniform calibration map [3]. As with our approach, a nonstandard scan was required. Çavuşoğlu et al. [9] and Chen et al. [10] reported dependence of perfusion estimates on $$$M_{0a}$$$ method, and Petersen et al. suggested using B1-corrected $$$M_0$$$ or T1 maps for assigning $$$\lambda$$$ values voxel-wise [2]. However, these studies did not account for the voxel-wise tracer distribution volume.
Some limitations should be noted. First, no correction for differences in T2* between tissue and blood was applied. Second, the calibration should ideally be independent of literature $$$\lambda$$$ values [3,11]. Third, the method relies on accurate PV estimates. If no PV data are available, it may be feasible to use segmentation of the ASL data or a high-resolution scan. Alternatively, to reduce bias in GM perfusion, $$$\lambda_{GM}$$$ may be used instead of $$$\bar{\lambda}$$$ if WM perfusion is dismissed.
We have proposed and applied a new and improved approach to perform calibration in ASL. The proposed method yielded significantly different perfusion values compared with the conventional method, and yielded more homogenous $$$M_{0a}$$$ maps which corresponds to a more accurate calibration [2,3,6].Acknowledgements
This project was supported by the Swedish Research Council, grant no. 2011-02971 and the European COST Action BM1103, ‘Arterial Spin Labelling Initiative in Dementia’ (AID).References
[1] Williams et al. Proc Natl Acad Sci USA 1992;89;212–216.
[2] Petersen et al. Proc Joint 15th ISMRM 24th ESMRMB, Berlin, Germany, 2007:376.
[3] Dai et al. Magn Reson Med 2011;66:1590–1600.
[4] Herscovitch and Raichle. J Cereb Blood Flow Metab 1985;5:65–69.
[5] Lassen and Perl. Tracer kinetic methods in medical physiology. New York, Raven Press, 1979, pp. 54–56.
[6] Ahlgren et al. Proc 28th ESMRMB, Leipzig, Germany, 2011:554.
[7] Shin et al. Neuroimage 2010;52:1347–1354.
[8] Alsop et al. Magn Reson Med 2014;73:102–116.
[9] Cavusoglu et al. Magn Reson Imaging 2009;27:1039–1045.
[10] Chen et al. Proc 19th ISMRM, Montréal, Canada, 2011:300.
[11] Roberts et al. J Magn Reson Imaging 1996;6;363–366.
---
Figures