3620
Defining the optimal post-labeling delay for pCASL using patient specific estimates of blood velocity in the carotid artery1Radiology & Imaging Sciences, NIH Clinical Center, Bethesda, MD, United States
Synopsis
Pseudo-continuous arterial spin labeling (pCASL) with 3D non-segmented acquisition scheme allows assessment of full brain CBF with sufficiently high SNR and resolution in an efficient manner. Post-labeling delay is a critical parameter which needs to be determined preferably on a per subject basis since PLD can change based on the physiological condition of a subject. Multiple post-labeling delay (PLD) pCASL could address this issue. However, multiple PLD pCASL is not feasible for the 3D non-segmented acquisition scheme. In this work, we related the velocity in carotid artery (CA) measured using two schemes to PLD in ten volunteers. A relationship between the CA velocity and optimal PLD was derived which allows for optimal PLD to be determined on the fly for each subject.
Purpose
To optimize the post-labeling delay (PLD) for pseudo-continuous arterial spin labeling (pCASL) study using patient specific carotid artery blood velocity measurements.
Introduction
Pseudo-continuous arterial spin labeling with centric encoded 3D acquisition provides higher SNR (1) and improves CBF quantification as the PLD is consistent throughout the image (defined by the end of labeling to the kz = 0 acquisition). Proper imaging of gray matter perfusion requires a PLD sufficiently long to allow all tagged blood to move from the arteries into the tissue, but not so long as to suffer significant SNR loss from T1 decay. Although multiple PLD pCASL can remove the macrovascular component of the ASL signal (2), such a technique is not feasible for non-segmented 3D acquisition with full brain coverage. Therefore, a patient specific method for determining the optimal PLD is desired since PLD has a dependence on the physiological state of a subject. In this work, we establish a relationship between blood velocity in the carotid artery and the optimal PLD. Furthermore, we establish this relationship using two distinctly different rapid methods to estimate blood velocity, either of which could be adapted for determining PLD during an exam.Methods
Volunteers: Ten volunteers (6M, 4F; age: 43±12.2 yrs) were scanned under an IRB approved protocol on a 3T Philips Achieva TX scanner using an 8 channel head coil.
Velocity measurement: Velocity in the carotid artery was determined using two schemes: (a) standard phase contrast imaging and (b) sagittal 3D T1 weighted spoiled gradient echo (SPGR) (resolution: 1mm3) (part of a routine non contrast brain MRI at our institute). Velocity was determined using the inflow effect in the 3D volume for method (b). ROIs were placed at two transverse (reformatted) locations along the carotid artery and jugular vein separated by about 40 mm in the cranio-caudal direction. Signal from the jugular vein provided B1 inhomogeneity correction as well as steady-state signal for blood. Using the in-flow dependent arterial signal, steady state venous signal and measured distance between the two locations, arterial blood velocity was estimated from Bloch equations for SPGR.
ASL measurement: The pCASL sequence with non-segmented 3D EPI acquisition had the following scan parameters: label duration = 1.65 s, label delay = {600 to 2000} ms in steps of 200 ms; FOV = 24×20 cm, res: 3×3×4mm3, EPI TR/TE = 22/11ms, centric kz encoding, SENSE (y) = 2.5, 32 slices, spectral-spatial excitation pulse θ = 25° with optimal flip angle train for reduced blurring (3,4), 10 dynamic pairs, scan time: ~2:30. Two background suppression (BS) adiabatic inversion pulses were used so that GM and CSF suppression was approximately equal for all delay times.
Analysis: 3D MPRAGE images were registered to ASL images and used to generate a gray matter (GM) mask using SPM-12. Mean ΔM (tagged – control) (normalized for time) was computed over the GM mask and fit to PLD using a third order polynomial and optimal TD determined at maximum ΔM. Finally, a linear relationship between CA blood velocity (CABV) and optimal PLD was ascertained using velocity measurements from both sequences. All curve fitting was checked for statistical significance of χ2 goodness of fit or Pearson correlation.
Results
Figure 1 shows an example plot of mean ΔM vs PLD in a volunteer. A third order polynomial provided excellent fit (χ2 fit P-value>0.99) in all cases. Figure 2 shows the ASL (∑ ΔM) images obtained in the same individual for a range of delay times. While ASL images obtained at TD<1.6 s show increased vascular signal, images with TD>1.6 s exhibit lower SNR. Figure 3 shows a plot of the relationship between velocity measured from PC and 3D SPGR against optimal delay time obtained in the ten volunteers.Discussion
Labeling efficiency and flow velocity were assumed to be constant for each subject during the duration of each study. Collateral flow and stenosis of the carotid artery as well as increased vessel tortuosity with aging can affect velocity determination and relationship between CABV and optimal PLD. Sampling the delay time at closer intervals could improve estimation of optimal PLD. However, we found mean change in signal of just 0.65% from peak ΔM for a ±100 ms error from estimated optimal TD. There was better correlation between maximum velocity and optimal PLD for both cases.Conclusion
Optimal PLD can be determined from carotid artery blood velocity on a per subject basis. Velocity can be determined using either of the two methods during a scan session which could then be used to determine optimal PLD for the pCASL sequence employed here.Acknowledgements
No acknowledgement found.References
(1) Alsop DC, Detre J, Golay X et al. Recommended implementation of arterial spin-labeled perfusion MRI for clinical applications: A consensus of the ISMRM perfusion study group and the European consortium for ASL in dementia. Magn Reson Med 2015; 73:102-116.
(2) Mezue M, Segerdahl A, Okell T et al., Optimization and reliability of multiple postlabeling delaypseudo-continuous arterial spin labeling during rest andstimulus-induced functional task activation. J Cereb Blood Flow Metab 2014; 34:1919-1927.
(3) Stehling MK. Improved signal in “snapshot” FLASH by variable flip angles. Magn Reson Imaging 1992; 10: 165–167.
(3) Gai N, Talagala L, Butman J. Whole-brain cerebral blood flow mapping using 3D echo planar imaging and pulsed arterial tagging. J Magn Reson Imaging 2011; 33:287-295.
Figures
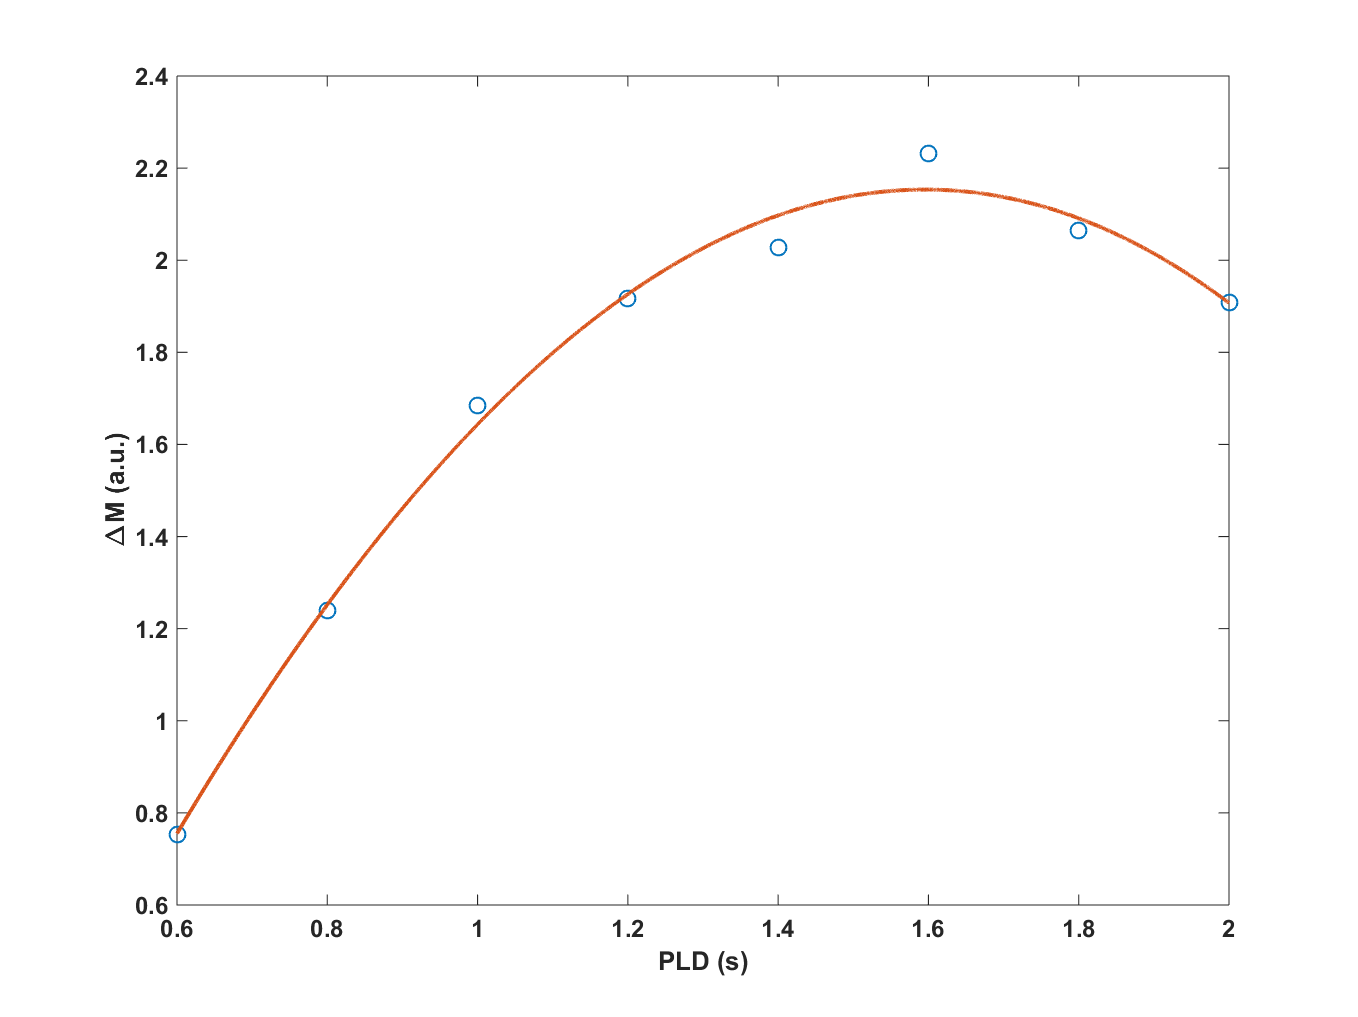
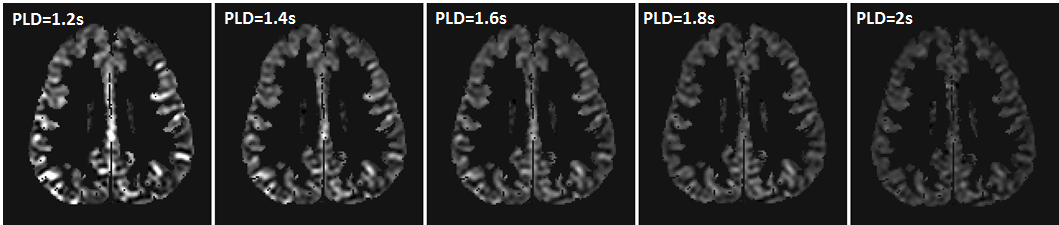
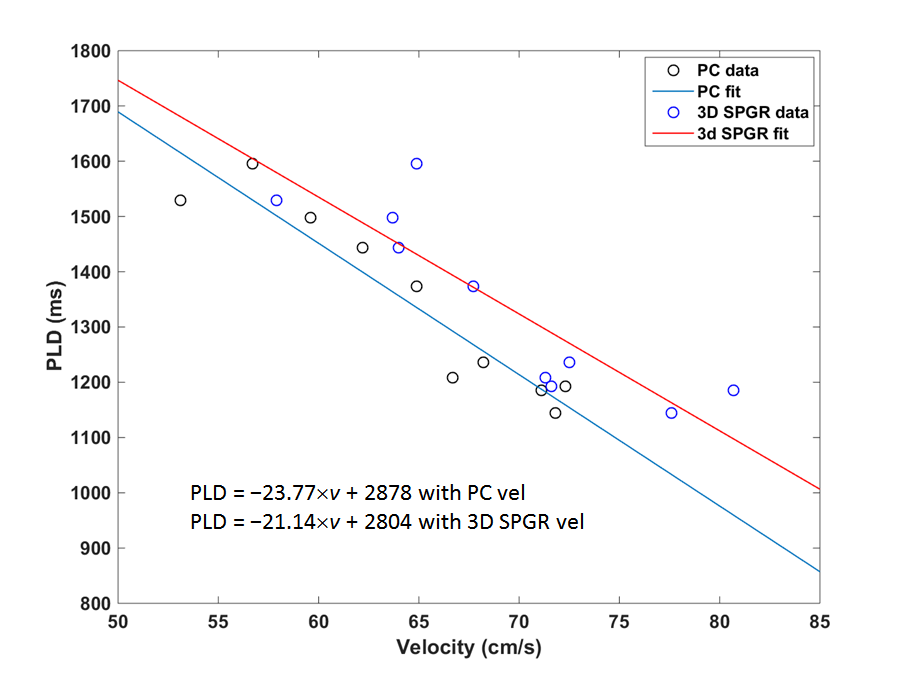
Figure 3: Plot shows the optimal PLD as a function of velocity estimated by the two methods. Pearson correlation (r) was -0.95 with PC velocity and -0.88 with SPGR based velocity measurement (p < 0.01 for both cases). Both exhibit similar slopes. The gap between the lines is due to a small bias in velocities determined by the two methods.