3618
In-vivo evaluation of pCASL labeling scheme and position1Neurology, University of Pennsylvania, Philadelphia, PA, United States, 2Radiology, University of Pennsylvania, Philadelphia, PA, United States, 3Radiology, Beth Israel Deaconess Medical Center and Harvard Medical School, MA, United States, 4Psychiatry, University of Pennsylvania, PA, United States
Synopsis
Despite recent consensus in the ASL community on pseudo-continuous ASL as preferred labeling method, several challenges still exist towards optimizing pCASL labeling efficiency in-vivo, including its sensitivity to vessel tortuosity and off-resonance effects. In this work, we assess the impact of labeling plane location and labeling scheme on the ASL perfusion signal.
Introduction
Arterial Spin Labeled (ASL) perfusion MRI provides non-invasive quantification of cerebral blood flow, but absolute quantification relies on assumed parameters and ASL SNR is intrinsically low. Optimization of ASL acquisition parameters is crucial to achieve high-quality, reliable perfusion maps. A recent consensus document supports pseudo-continuous ASL (pCASL) as the preferred labeling method1. However, pCASL efficiency must be optimized within an assumed range of flow velocities and several in-vivo challenges still exist including: 1) vessel tortuosity affecting net velocity along the labeling axis, and 2) off-resonance effects reducing labeling efficiency. A Time-Of-Flight (TOF) angiogram can be used to select the labeling location, at the expense of added protocol time and complexity, while use of an unbalanced pCASL scheme may improve robustness against off-resonance field effects2,3.
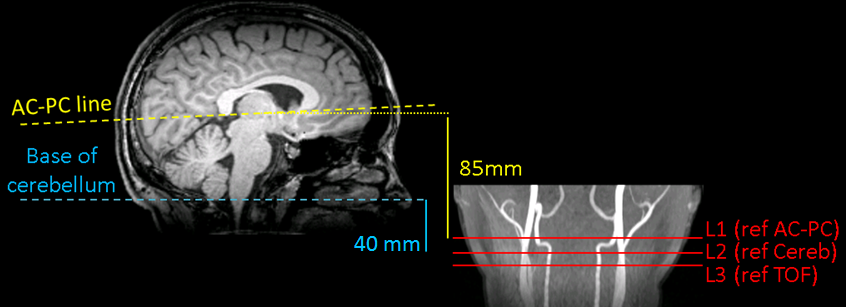
We evaluated the impact of labeling scheme and location on the ASL signal (ΔM) (Fig.1).
Specifically, we compared two non-TOF guided labeling plane locations: L1) 85mm
below the AC-PC line1,4 and L2) 40mm below
the cerebellum; to TOF-guided L3) above the carotid bifurcation and below the V3
segment3,5.
L3 was acquired twice, varying the labeling scheme (balanced/unbalanced: bpCASL/ubPCASL).
Methods
5 subjects (1F, age=23–37 years) consenting to an ongoing double-blind placebo-controlled study participated.
The study was conducted on a 3T Siemens Trio using a 32-channel head array. Subjects were scanned 4 times, consisting of two scans separated by 3h, repeated at the same time of day after one week. A localizer, a B0 map and a TOF were acquired, followed by 4 ASL scans in pseudorandomized order with a fixed readout, consisting of a single-shot background-suppressed 3D RARE Stack-Of-Spirals accelerated in the partition-encoding direction6 (R=2, whole-brain FOV, 3.75mm isotropic resolution):
- bpCASL, labeling position L1, 36 label/control images
- bpCASL, labeling position L2, 36 label/control images
- bpCASL, labeling position L3, 72 label/control images
- ubpCASL, labeling position L3, 72 label/control images
PCASL was implemented with labeling duration/PLD=1.8s/1.8s1,7. A T1-weighted MPRAGE anatomical image was acquired for registration purposes.
Images were processed using FSL5.0.8, SPM8 and custom Matlab scripts. ASL images were realigned8 and registered to the MPRAGE. Mean ΔM and tSNR maps were derived for each series. Final ΔM maps were smoothed (FWHM=8mm) and registered to the MNI152 template for group-level analysis. The MPRAGE was segmented into GM and WM probability maps to create tissue and whole-brain masks.
Statistical analysis focused on global and voxel-wise ΔM effects. To control for baseline differences and/or medication effects, ΔM measures were normalized within-session by the ΔM of the ubpCASL acquisition (L3).
Effect of labeling position: A repeated-measures ANOVA was conducted with within-subject factor ‘position’ on global ΔM, followed by pair-wise comparisons: L2-L1, L3-L1 and L3-L2.
Effect of labeling scheme: Statistical significance was assessed both globally and voxelwise using a Linear Mixed Effects model (ΔMub - ΔMb ~ 1 + (1 + Session | Subject)).
Frequency-offset information was extracted from the B0 maps at position L3.
Results and discussion
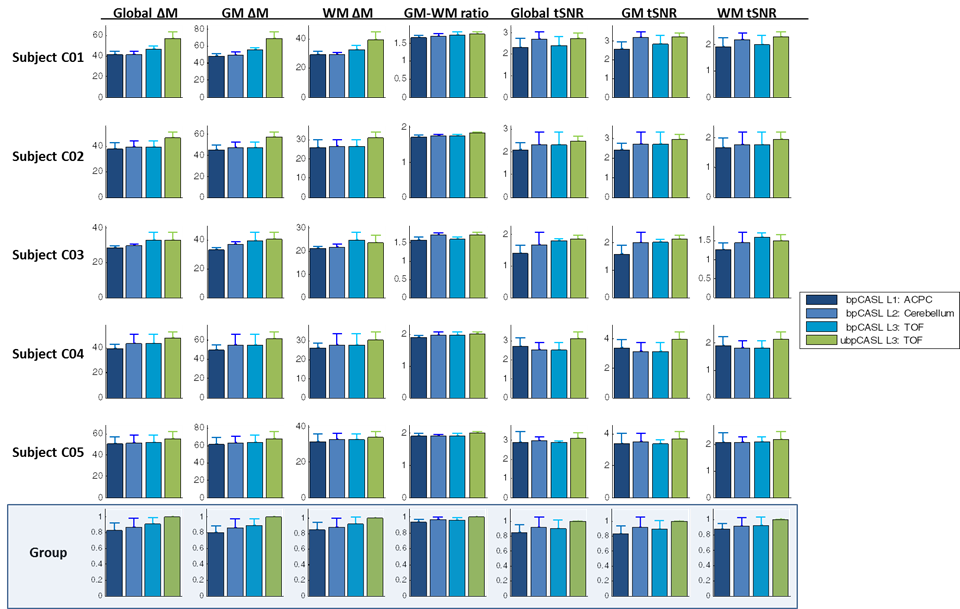
Mean ΔM and tSNR measures are displayed in Fig.2. Both scheme and position affected ΔM values globally and in GM and WM segments, with the highest ΔM/tSNR observed for the TOF-guided ubpCASL acquisition. GM-WM ratio was relatively stable.
Effect of labeling position: A significant effect of position was found on global ΔM (p<0.05). ASL signal increased by 7% when position was TOF-guided (p=0.0016), compared to using the anatomical AC-PC line. Cerebellum-based acquisitions also produced higher signal (4%) compared to AC-PC (p=0.037), with no significant difference found versus the TOF-guided acquisitions.
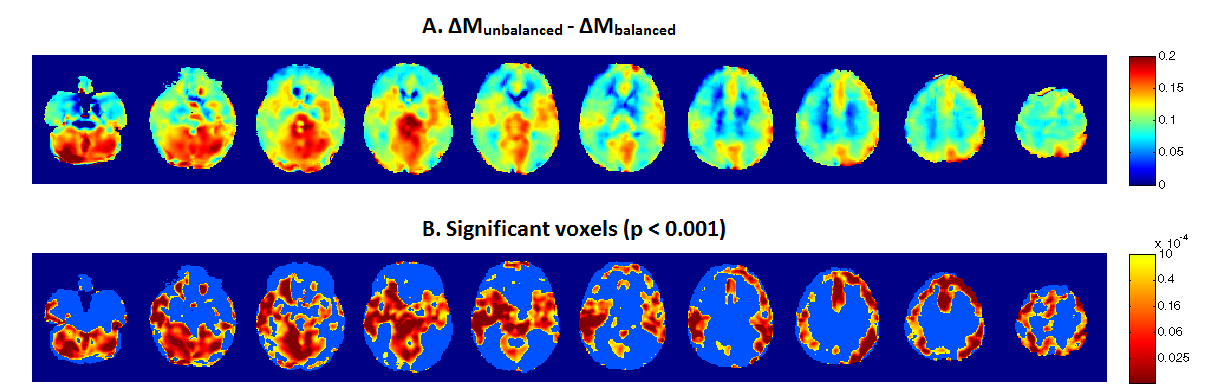
Effect of labeling scheme: Acquisitions using ubpCASL resulted in a mean 11.7% global ΔM increase (p<0.0001), compared to bpCASL. Voxelwise differences (Fig.3, p<0.001 unc.) were observed throughout GM, with highest perfusion gains observed in posterior circulation regions (cerebellum, posterior cingulate and thalamus).
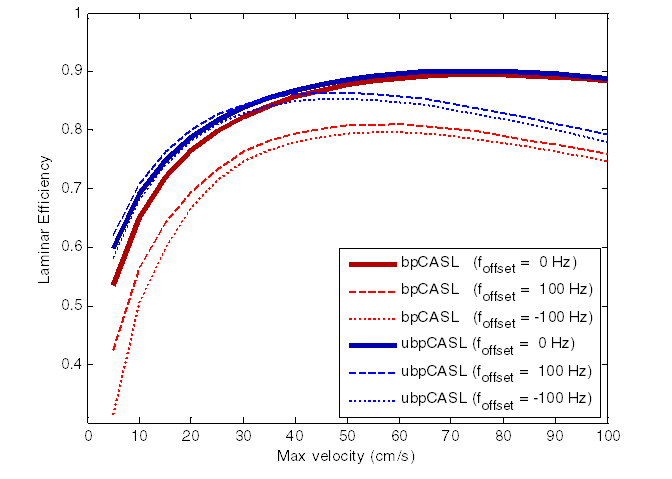
Frequency-offset range at L3 was [-81,132Hz] (average magnitude foffset=51.3Hz). The effect of labeling scheme as a function of flow velocity was then simulated9 for foffset=0 and foffset=±100 Hz (Fig.4). Simulations confirm the robustness of ubpCASL in the presence of off-resonance, as previously reported2,3, with greater effect at lower velocities, potentially explaining why PCA regions show the highest signal difference between schemes.
Conclusion
A labeling plane 85mm below the AC-PC line appears to be suboptimal, despite previous reports1,4. For non-angiographic prescribed labeling locations, a plane 40mm below the cerebellum produced closer results to the TOF-guided location3,10, translating into higher labeling efficiency.
These preliminary analyses demonstrate in-vivo the superiority of ubpCASL2,3. The highest perfusion gain is obtained inside the posterior vascular territory, suggesting vertebral flow is more sensitive to off-resonance effects, in line with previous results11, likely due to lower velocity. Continued analysis will verify the current findings in a larger sample.
Acknowledgements
NIH grants MH080729 and EB015893.References
1. Alsop DC, Detre JA, Golay X, et al. Recommended implementation of arterial spin-labeled perfusion MRI for clinical applications: A consensus of the ISMRM perfusion study group and the European consortium for ASL in dementia. Magn Reson Med. 2015;73(1):102-116.
2. Wu W-C, Fernández-Seara MA, Detre JA, Wehrli FW, Wang J. A theoretical and experimental investigation of the tagging efficiency of pseudocontinuous arterial spin labeling. Magn Reson Med. 2007;58(5):1020-1027.
3. Zhao
L, Vidorreta M, Soman S, Detre JA, Alsop DC. Improving the robustness of
pseudo-continuous arterial spin labeling to off-resonance and pulsatile flow
velocity. Magn Reson Med. 2016. In Press.
4. Aslan S, Xu F, Wang PL, et al. Estimation of labeling efficiency in pseudocontinuous Arterial Spin Labeling. Magn Reson Med. 2010;63(3):765-771.
5. Chen Z, Zhang X, Yuan C, Zhao X, van Osch MJP. Measuring the labeling efficiency of pseudocontinuous arterial spin labeling. Magn Reson Med. 2016;0:1-12.
6. Vidorreta M, Chang Y V., Fernández-Seara MA, Detre JA. Single-Shot Whole-Brain Background-Suppressed pCASL MRI with 1D Accelerated 3D RARE Stack-Of-Spirals Readout. In: Proceedings of the International Society of Magnetic Resonance in Medicine. Vol 23. Toronto; 2015:269.
7. Vidorreta M, Wang Z, Rodríguez I, Pastor MA, Detre JA, Fernández-Seara MA. Comparison of 2D and 3D single-shot ASL perfusion fMRI sequences. Neuroimage. 2012;66C:662-671.
8. Wang Z. Improving cerebral blood flow quantification for arterial spin labeled perfusion MRI by removing residual motion artifacts and global signal fluctuations. Magn Reson Imaging. 2012;30(10):1409-1415.
9. Maccotta L, Detre JA, Alsop DC. The efficiency of adiabatic inversion for perfusion imaging by arterial spin labeling. NMR Biomed. 1997;10(4-5):216-221.
10. Chen Z, Zhang X, Webb AG, Zhao X, van Osch MJP. A novel method to estimate labeling efficiency for pseudo-continuous arterial spin labeling imaging. In: Proceedings of the International Society of Magnetic Resonance in Medicine. Vol Toronto, Canada; 2015:2953.
11. Jahanian H, Noll DC, Hernandez-garcia L. B0 field inhomogeneity considerations in pseudo-continuous arterial spin labeling ( pCASL ): effects on tagging efficiency and correction strategy. NMR Biomed. 2011;24(10):1202-1209.
Figures