3612
A Multi-Variate Regional Study of Acute Lung Injury Using Hyperpolarized [1-13C] PyruvateHooman Hamedani1, Mehrdad Pourfathi1, Yi Xin1, Stephen Kadlecek1, Maurizio Cereda2, Harrilla Profka1, Ian Duncan1, Sarmad Siddiqui1, Nicholas Drachman1, Kai Ruppert1, and Rahim Rizi1
1Radiology, University of Pennsylvania, Philadelphia, PA, United States, 2Anesthesiology and Critical Care, University of Pennsylvania, Philadelphia, PA, United States
Synopsis
In this study we seek to investigate the dependency of the changes of lactate-to-pyruvate ratio on various covariates in the settings of experimental acute lung injury using a random-effect model.
Introduction
Assessment of metabolic alterations in the lungs using hyperpolarized carbon-13 MRI is challenging due to the lung’s modest energy needs, sensitivity to oxygenation and alterations of blood flow. The dependency on a large number of covariates can increase the variability of the study, and potentially make quantification of metabolic changes in the lungs caused by the injury. In this study, we used a linear mixed-effect model to assess the dependence of alterations of regional lactate-to-pyruvate ratio in an experimental acid aspiration injury model in rats.Methods
Twenty-three Sprague-Dawley rats (346±34g) were ventilated with a tidal volume (TV) of 8.2±0.6 mL/kg and a positive end-expiratory pressure (PEEP) of 6.0±2.2cmH2O for 5hrs. All rats received three doses of HP [1-13C]-pyruvate at t=60min, t=120 and t=300min after the start of ventilation. Hydrochloric acid (pH 1.25) was instilled into the trachea of the injured rats (n=18) at t=70min with variable dosages (0.5ml/kg (n=2), 1ml/kg (n=11) and 2ml/kg (n=5)) to achieve different severity of injury across cohorts. Control rats did not receive any acid. Peak-inspiratory pressure (PIP) was monitored using a pressure sensor. All rats were imaged in the supine position using a 1H/13C quadrature birdcage coil (m2m) at 4.7T (Varian Inc.). Proton images were acquired using a multi-slice gradient echo (TR/TE=80/1.5ms, α=10°, 128x128 voxels). ~22 µL of [1-13C]-pyruvate was polarized using a HyperSense DNP polarizer and was subsequently melted using 4mL of a dissolution buffer at 180°C to yield a neutral isotonic solution of 80mM [1-13C]-pyruvate at ~37°C. Hyperpolarized pyruvate was administered 12s after the dissolution via the tail-vein within 8s at 5.7±2.0ml/kg dose. An axial carbon-13 chemical shift image was acquired 12s after the end of injection using a 16x16 FID-CSI sequence (TR/TE=35/0.35ms, α=12°, FOV=45x45mm2, 15mm slice thickness), using a custom outward spiral k-space trajectory [7]. Regional metabolites were quantified using custom routines in MATLAB2014b. To study the relationships between the measured regional continuous variables and factors (i.e. time, cohort, anatomical position), and to test the main hypothesis of our study, a variance component analysis was performed. In the first step of the analysis, decision trees were used to explain variances in the data. A tree-based model can be constructed by a stepwise principle. As shown in figure 2, the algorithm sorts out which of the available variables explain most of the variance observed in the response variable (determined a-priori), then determines a threshold value (for each identified variable) that best partitions the variance in the response. The process is repeated for values of the identified variable that are larger and smaller than the threshold until no residual explanatory variable is left. The analysis was performed using nlme package in R. The model was fit using maximum likelihood technique and backward elimination based on Akakie information criteria. Once the significant covariates were determined, the final model was constructed using the restricted maximum likelihood technique. The first maximal model contained all the variables and all their interactions. Any factor/variable that not significant was removed from the model: in each step the reduced model was compared with the original one with an ANOVA test and based on the change in AIC.Results and Discussion
The first fixed-effect variable shows the effect of injury (injured cohort) as a significant increase of lactate-to-pyruvate ratio (38.8%, P= 0.0035) from the baseline (0.145/0.375). The third Injection time-point was a significant term (P=0.0353) with a positive 14.2% (0.053/0.375) effect on the lactate-to-pyruvate. The change in the 2nd injection time did not reach the level of significance (P=0.2676), which is expected as neutrophilic infiltration occurs at least one hour after the start of injury [6]. The injected dose of HCl was another significant contributor (P=0.0167) showing a 26% decrease in the level of inflammation (-0.098/0.375). While weight was a significant covariate (P=0.0025), the effect was not considerable (-0.001/0.375). The application of PEEP lowered the injury by 3.25% (-0.0122) and the association with PIP (P=0.0170) shows that the model can predict the mechanical damage. Random-effects explained the variance in the slopes of the regression terms. Approximately 60% of variance was explained by the variability in rats and very little by different regions in each slice. At the end of the analysis, 39% of the variance in the nested model remained unexplained.Conclusion
The study suggests that despite the presence of several covariates in the study of lung injury, the utility of a random-effect model can accurately describe the contribution of these factors to the changes of the lactate-to-pyruvate ratio in the lungs due to inflammation.Acknowledgements
This work was supported by the National of Institutes of Health (NIH) R01 HL124986.References
[1] Cereda M. et al, Anesthesiology, 2016;124:121–131
[2] Mistry N. et al, MRM, 2008;59:289–297
[3] Drachman N. et al, MRM Sep 2016
[4] Thind K. et al, Radiotherapy and Oncology 2014;110:317–322
[5] Shaghaghi et. al., NMR in biomedicine, 27(8):939-947 (2014)
[6] KENNEDY TP, et al. anesth. Analg. 1989;69:87–92.
[7] Kadlececk S, et al. The 24th Annual Meeting of ISMRM 2016.
Figures
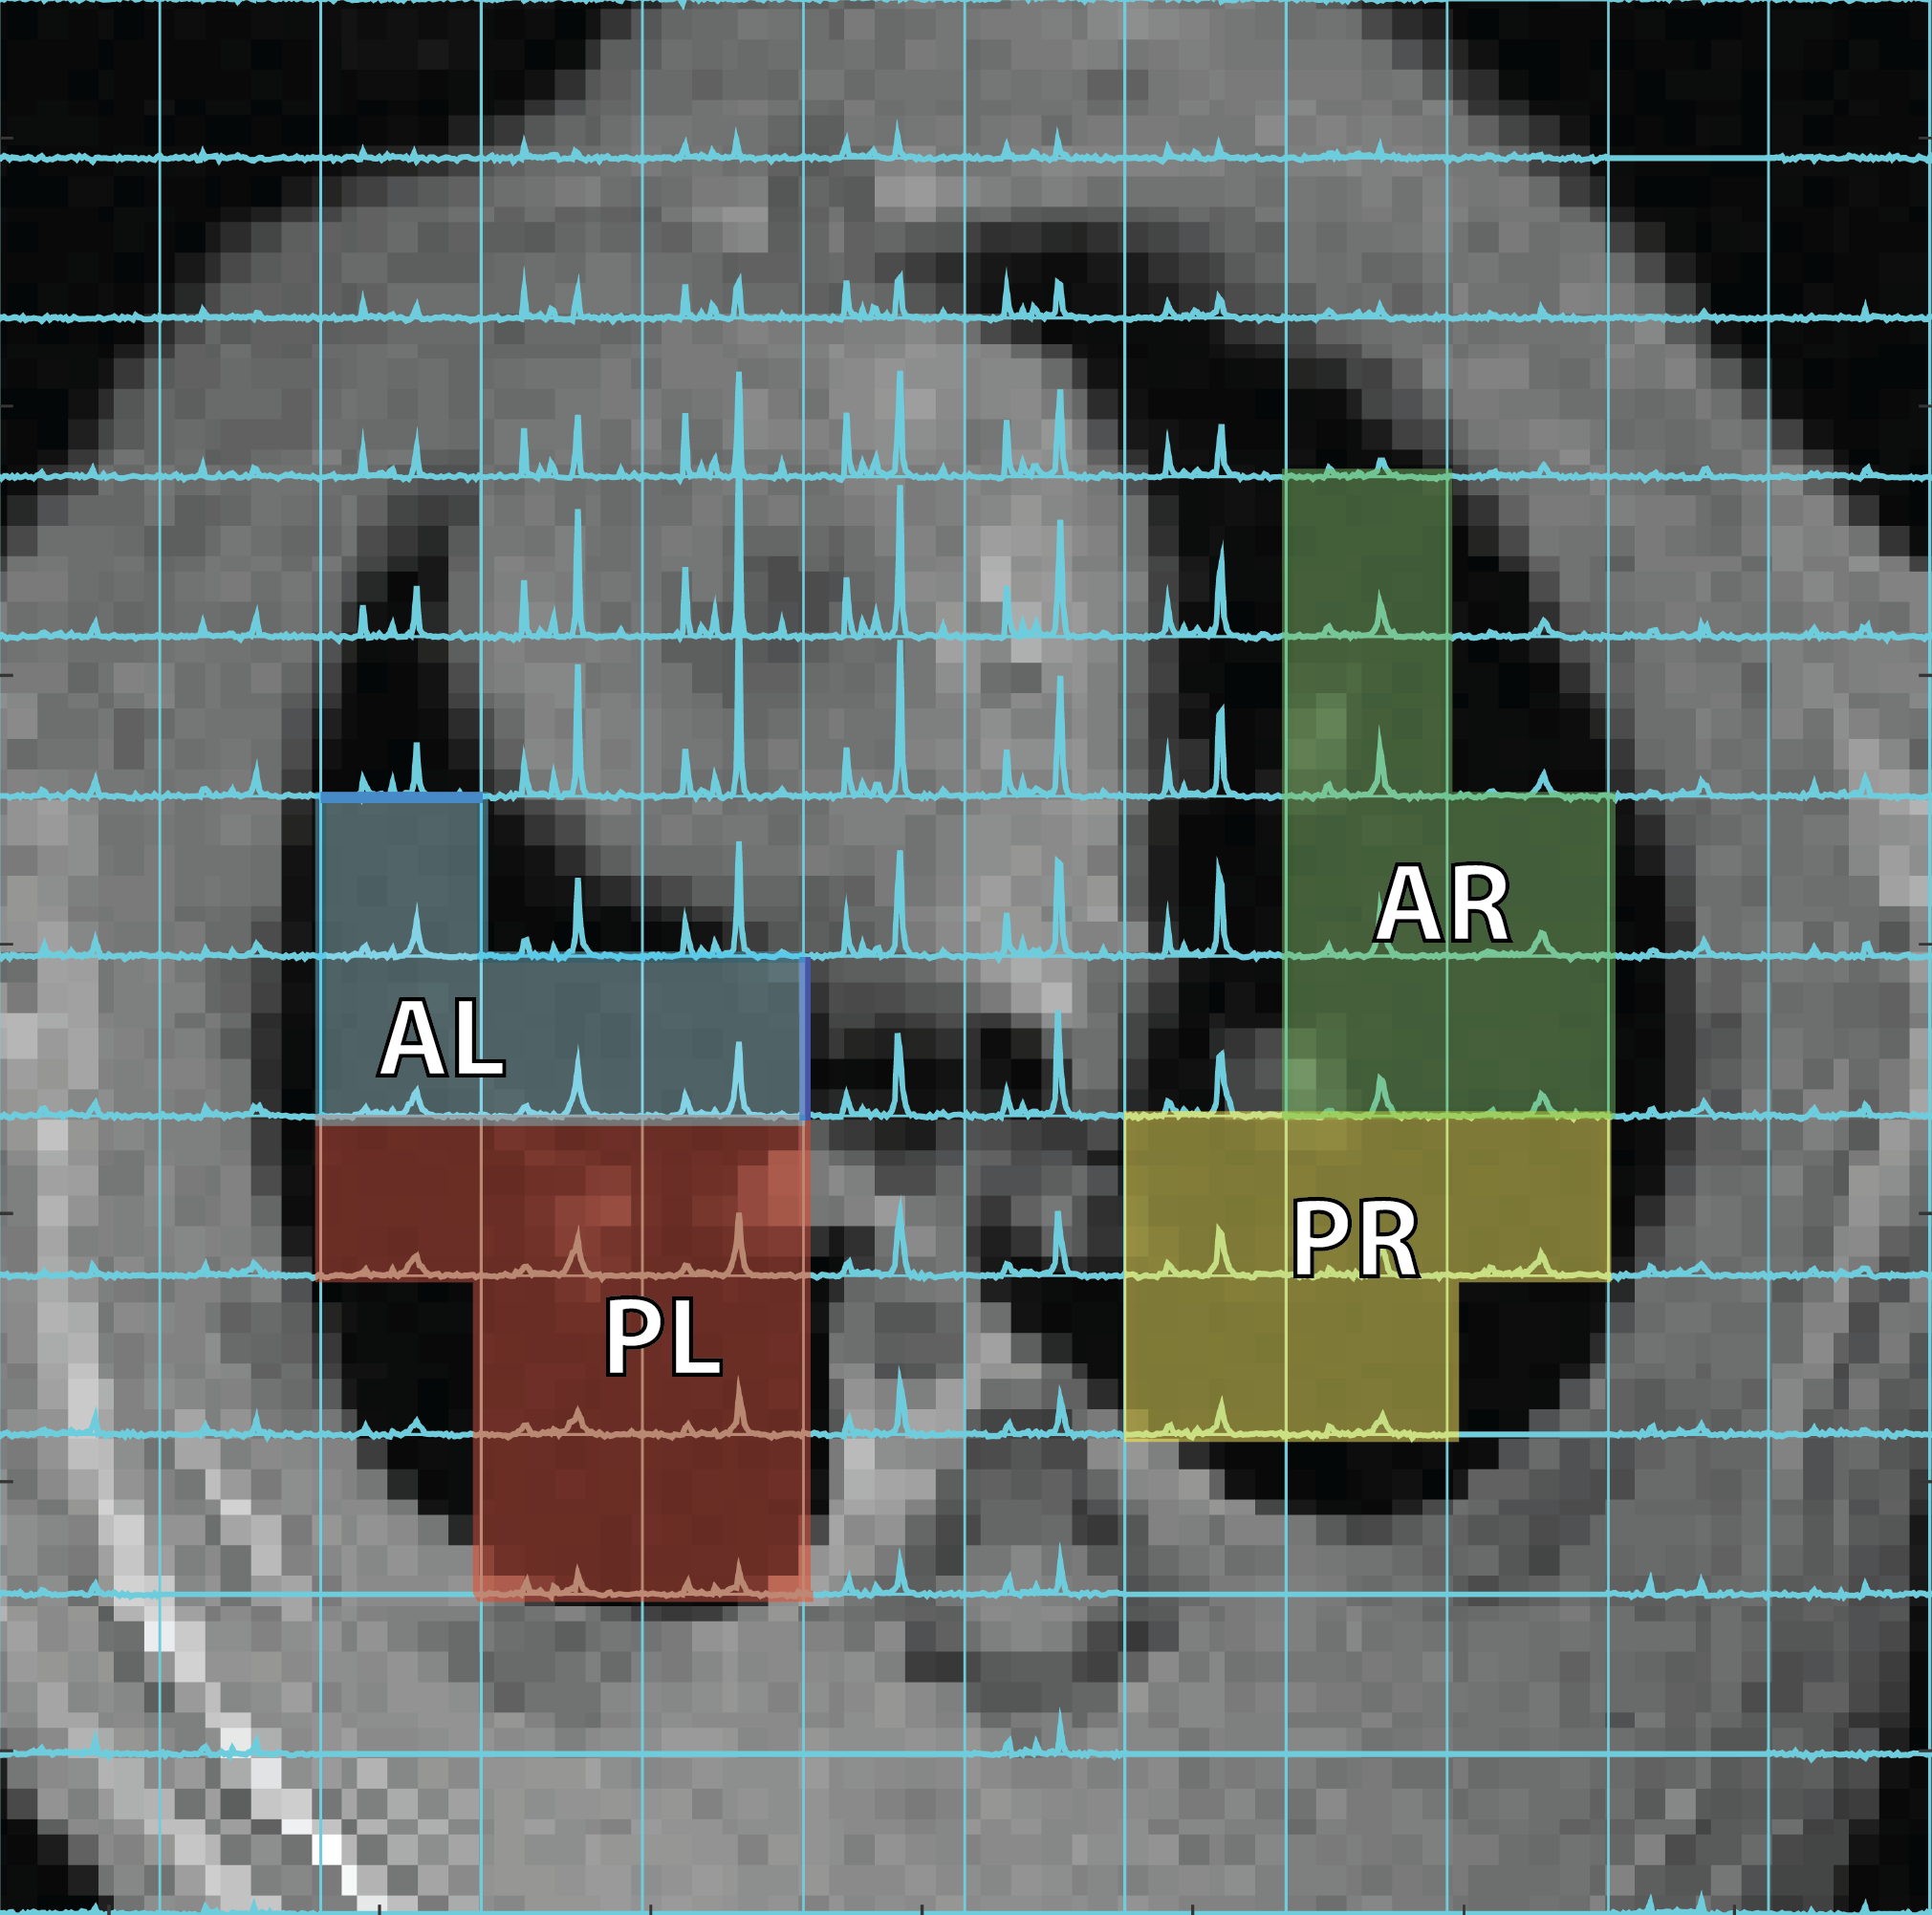
Figure 1. Voxel selection of the carbon-13 spectroscopic image for different regions highlighted in different colors (AL: anterior left, PL:
posterior left, AR: anterior right anterior, PR: posterior right).
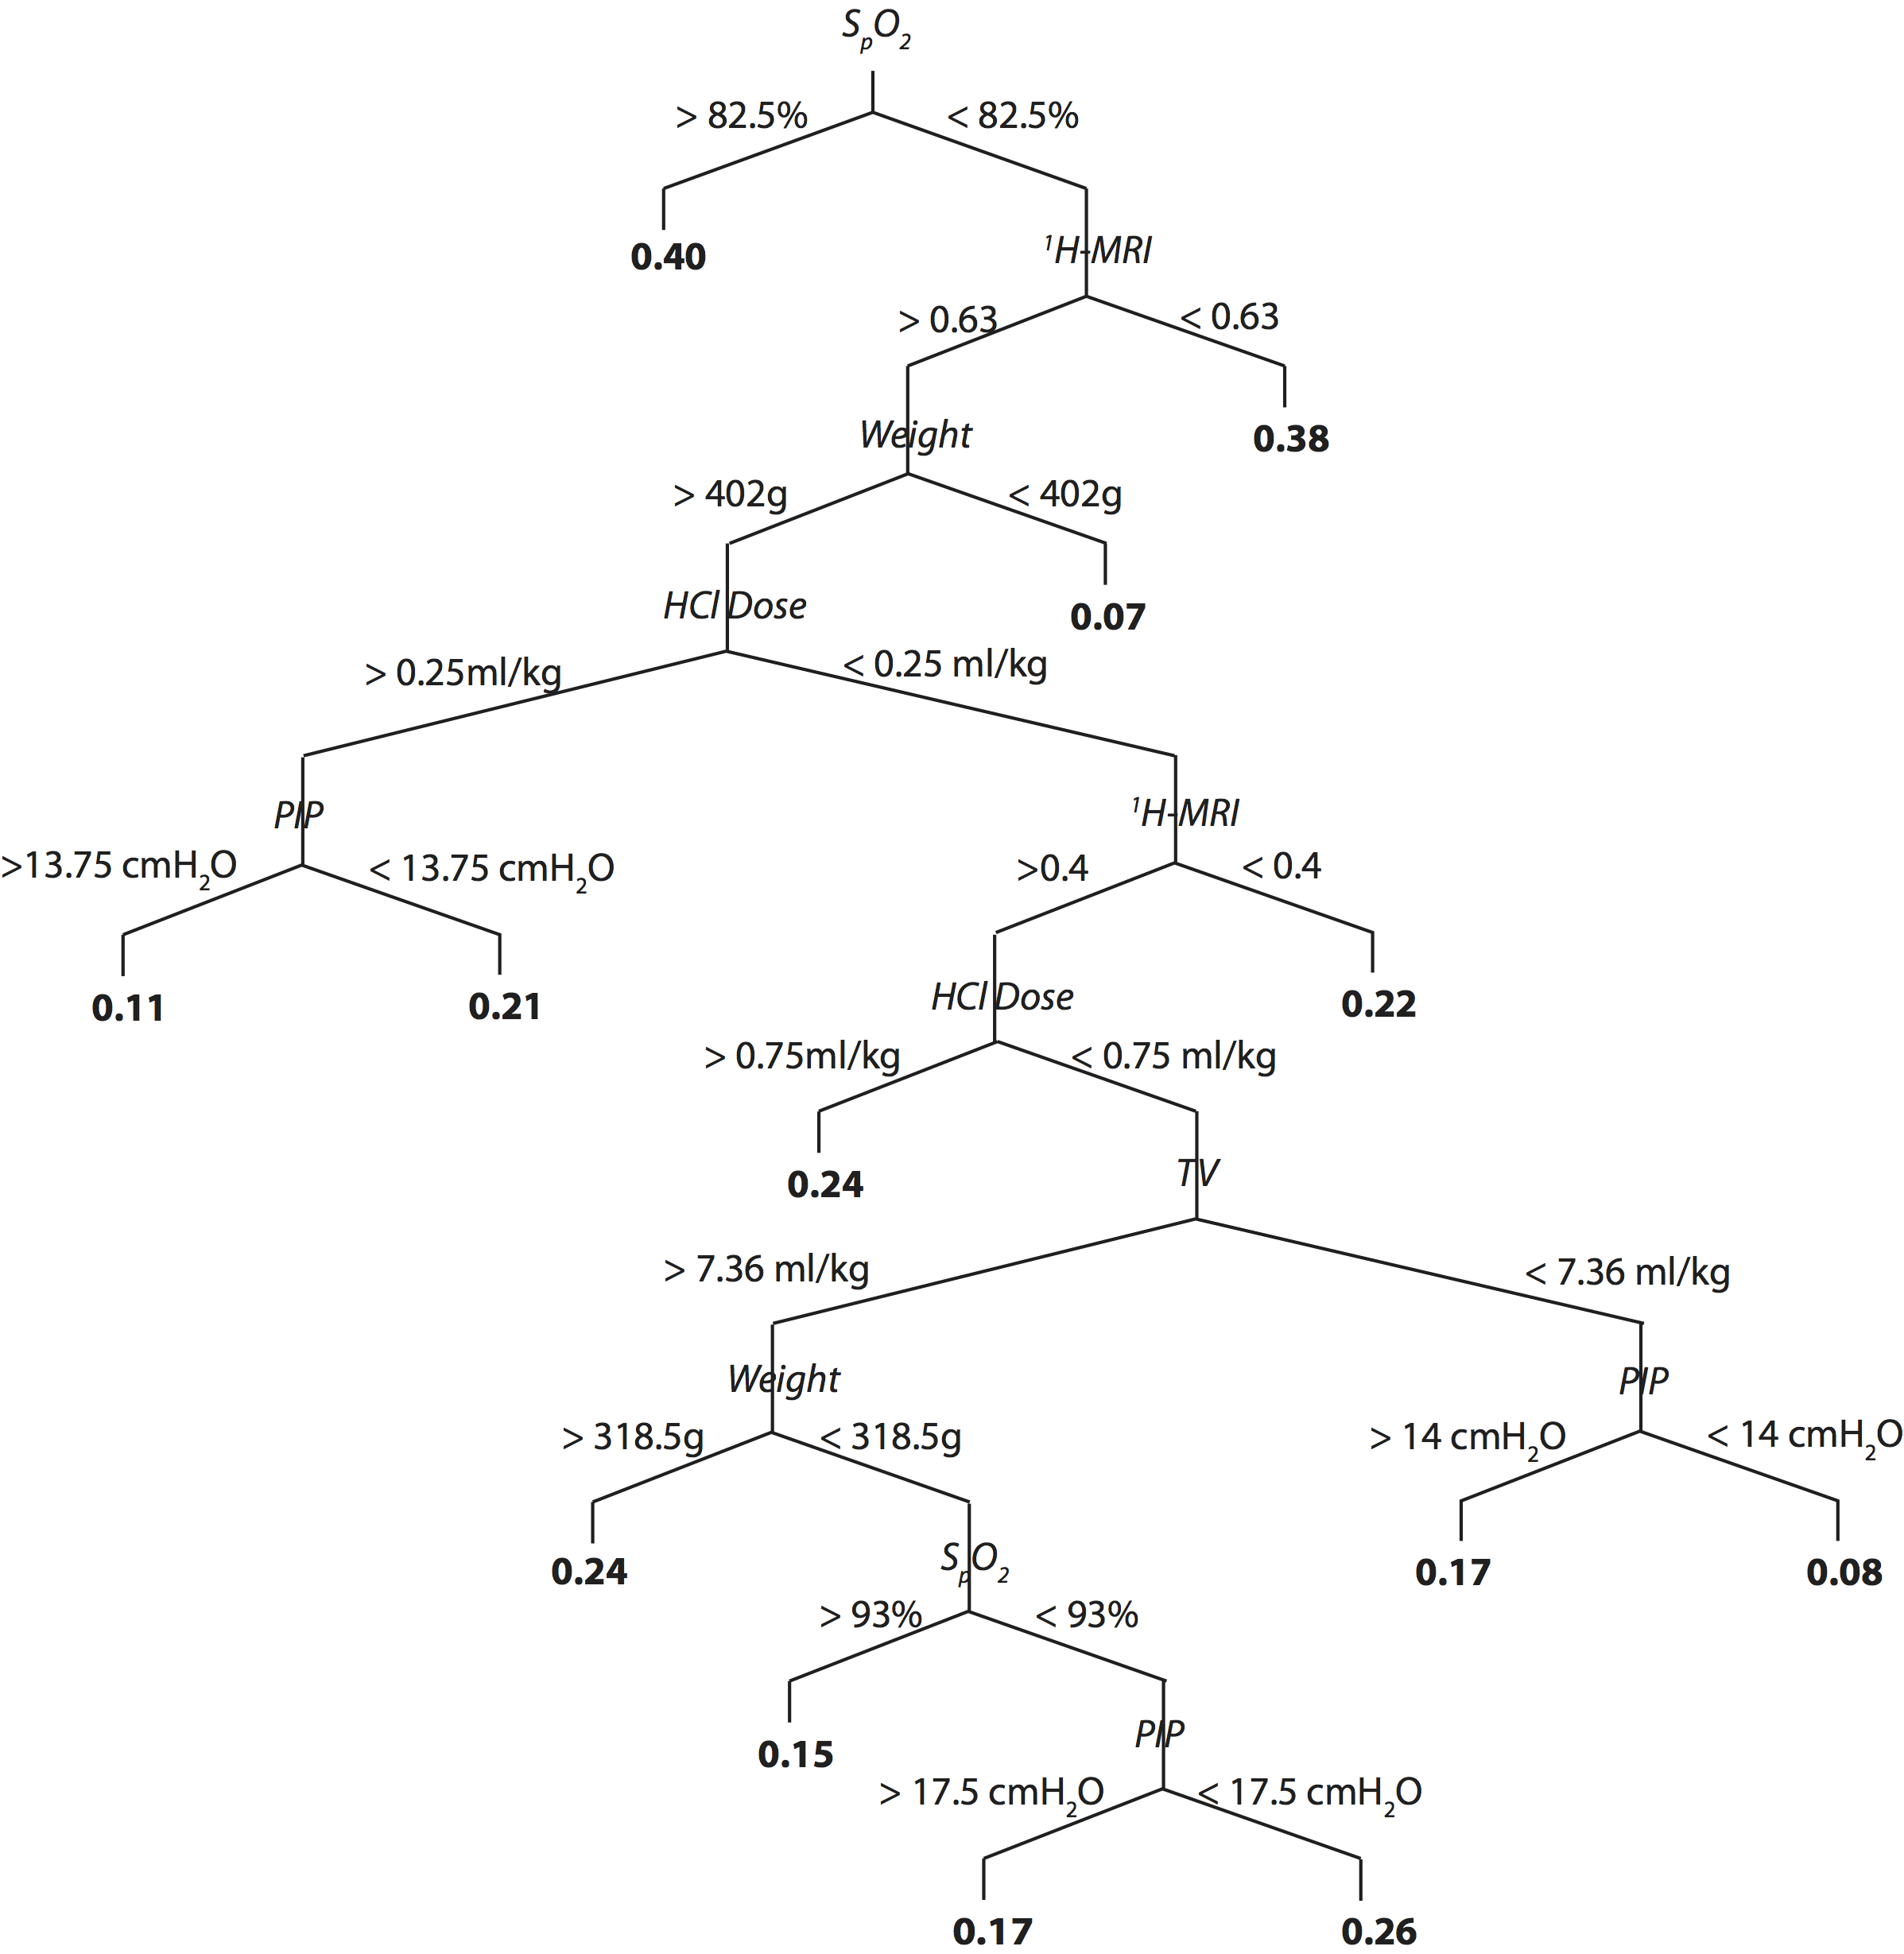
Figure 2. Decision tree, showing the dependence of lactate-to-pyruvate on different covariates.
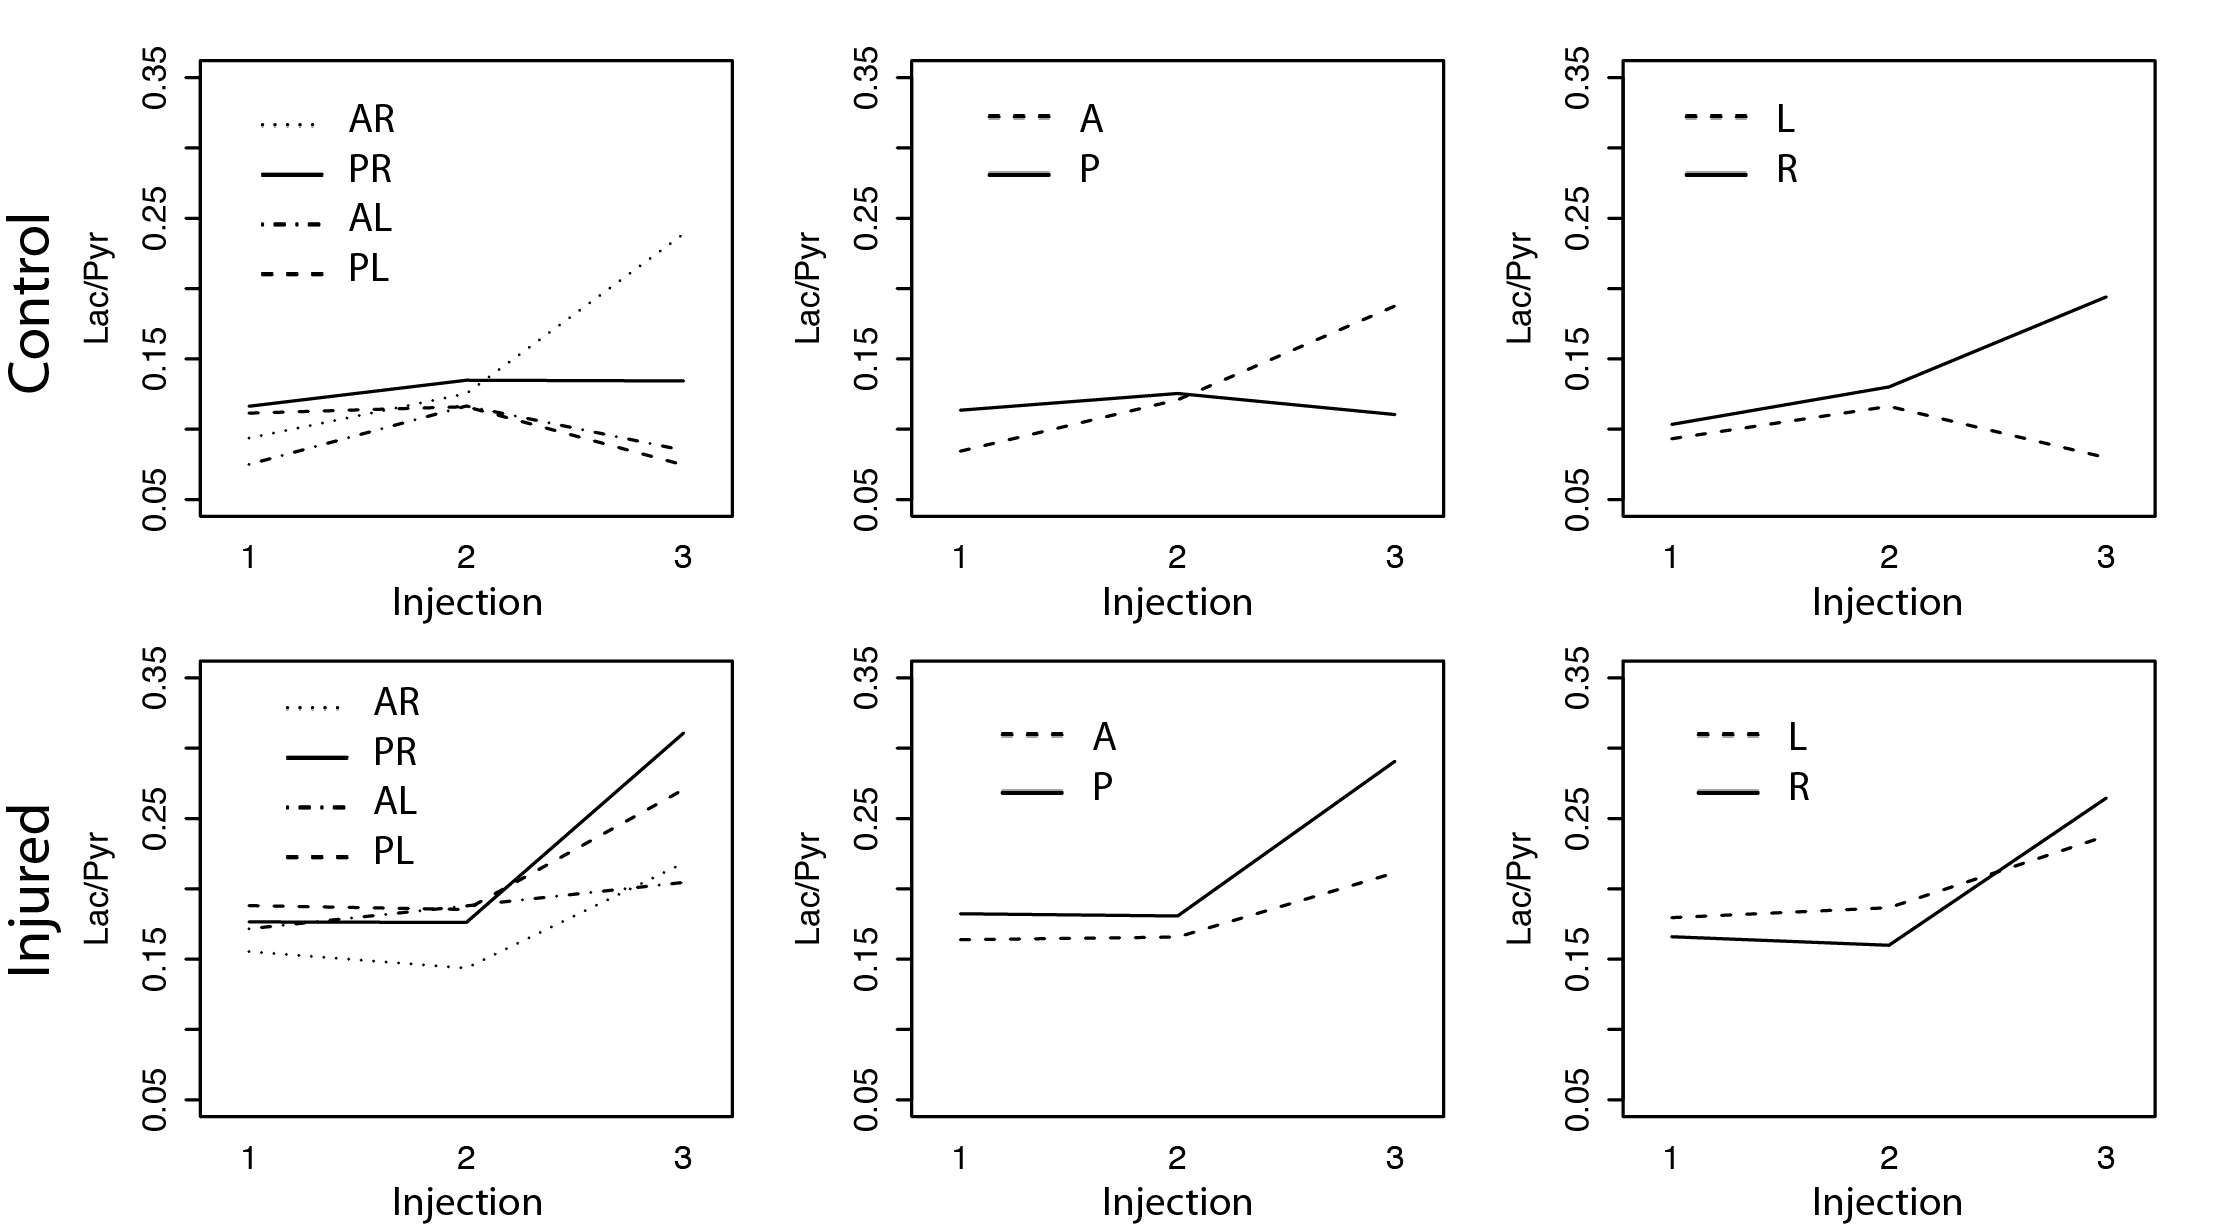
Figure 3. Lactate-to-pyruvate ratio for various injection time in control and injured rats in different regions.
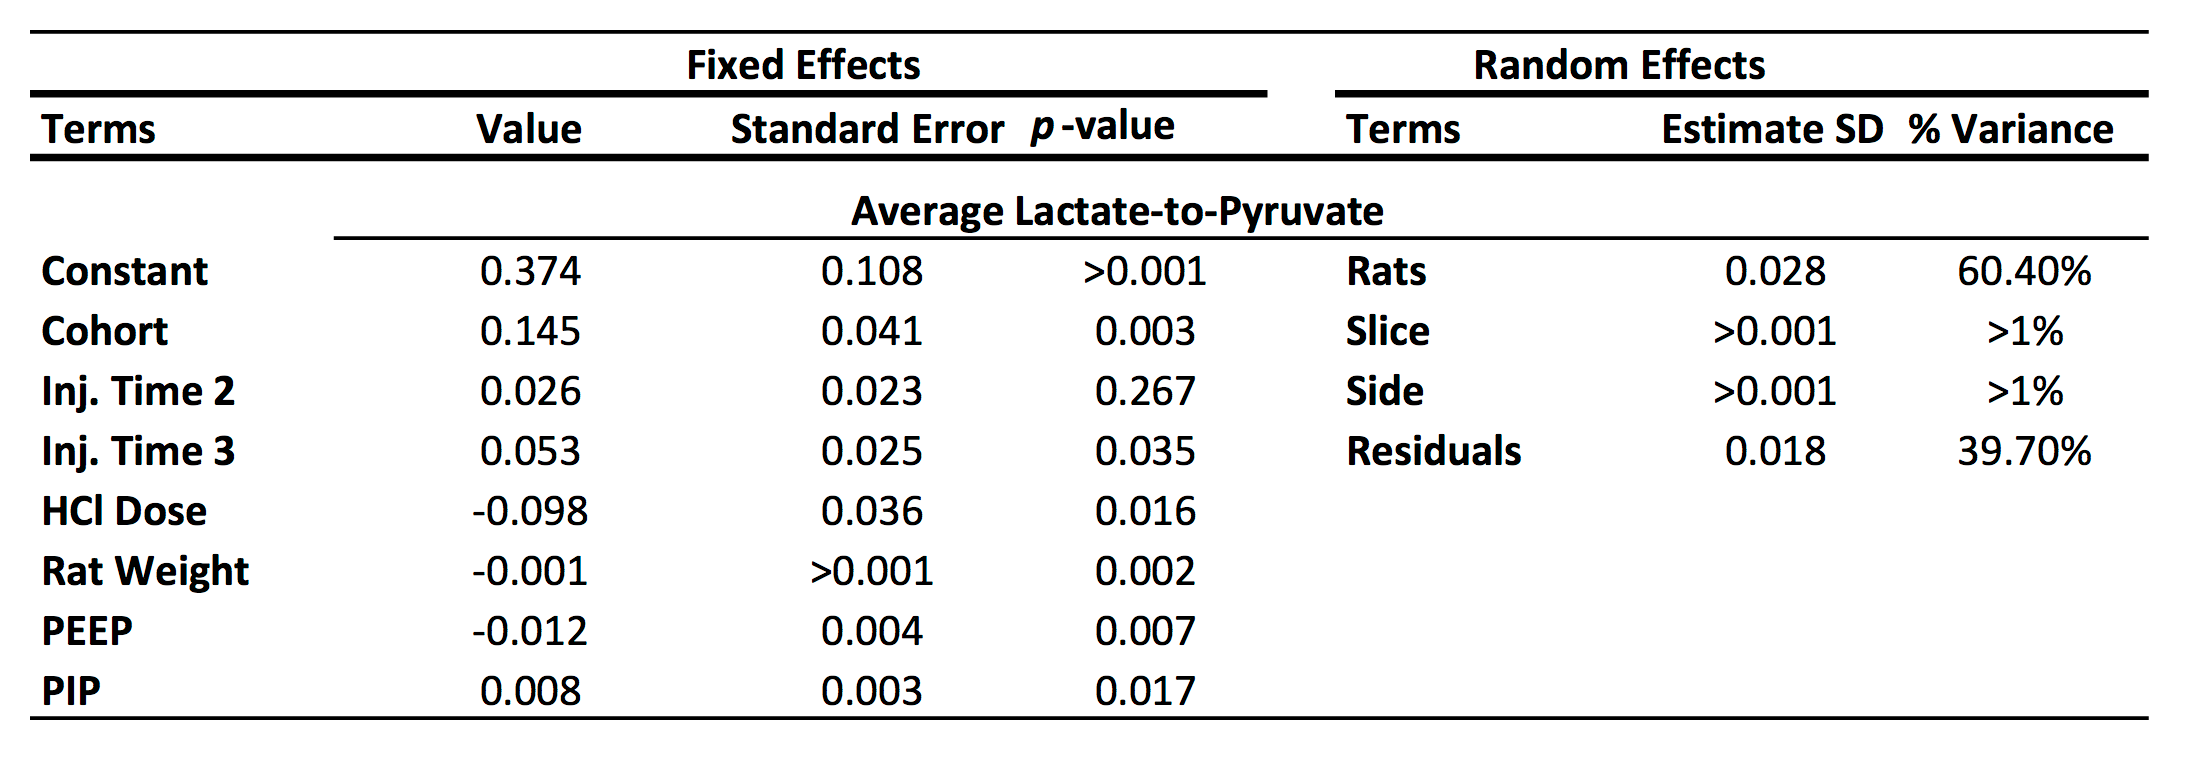
Figure 4. Summary of the mixed-effect model results