3609
Molecular Detection of Inflammation in a Macrophage Cell Model Using Hyperpolarized 13C-Pyruvate1Radiology and Biomedical Imaging, University of California San Francisco, San Francisco, CA, United States, 2University of California San Diego
Synopsis
Carbon-13 magnetic resonance with dynamic nuclear polarization is a potential molecular imaging strategy to detect and monitor inflammation. In this study we investigated hyperpolarized 13C-pyruvate and alterations in its conversion to 13C-lactate as an imaging biomarker for disease severity and monitoring treatment response in inflammatory disorders.
Aim
Inflammation plays major roles in infection and autoimmune disease, but current strategies to monitor these diseases are limited. Macrophages are found throughout the body and are first responders as well as regulators of immunological processes in both homoestatic as well as pathologic conditions. Macrophages become activated to defend the body against disease processes e.g. infectious agents and help initiate and recruit other immune cells. Hence, here we investigate the metabolic adaptations of macrophage cells upon stimulation to mount an immune response to pathogens as well as its response to drug treatment by examining specific enzymatic activities using hyperpolarized carbon-13 MR, a non-invasive molecular imaging strategy.Methods
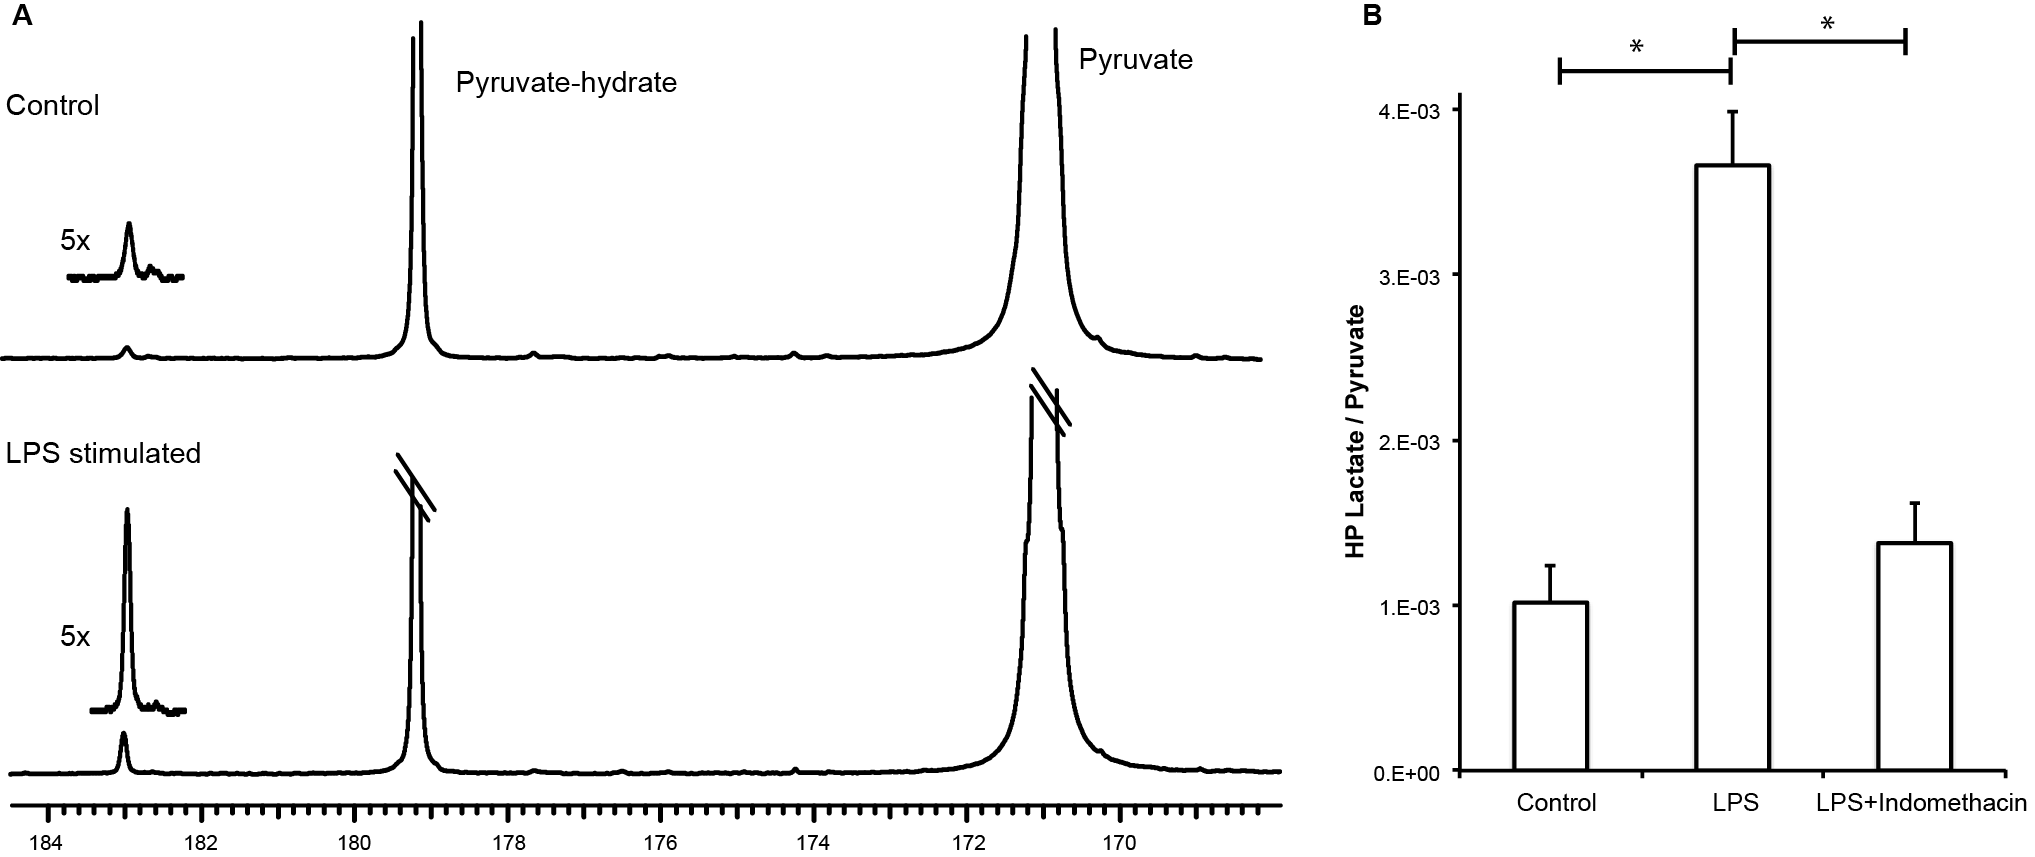
15 million J774A.1 mouse macrophage cells were cultured in RPMI media to 60-80% confluency before being transferred onto cytodex microcarrier beads. Cells were either quiescent/unstimulated (control) or activated with 100 ng/mL of E. coli lipopolysaccharides (LPS) treatment with 10 μM of the non-steroidal anti-inflammatory drug (NSAID) indomethacin (IND). Cell coated beads (>90% surface coverage) were maintained at physiologic conditions at 37°C, with continuous perfusion of fully oxygenated media in an NMR compatible bioreactor1 7.5ml of [1-13C] pyruvate polarized on the Hypersense (Oxford Instruments) was dissolved in 5ml of phosphate buffer and 750 µl of it was injected into the bioreactor containing the macrophages. 13C spectra were obtained on a 500 MHz Varian Inova (Agilent Technologies) with a 5 mm broadband probe using dynamic pulse-acquire scheme with a 30° RF excitation and repetition time of 3 seconds. Correlative biochemical measures for nitric oxide (NO) (Griess reaction, Promega), RNA expression, lactate dehydrogenase (LDH) activity and co-factor levels (NAD assay, Abcam kit) were performed as previously described1.Results
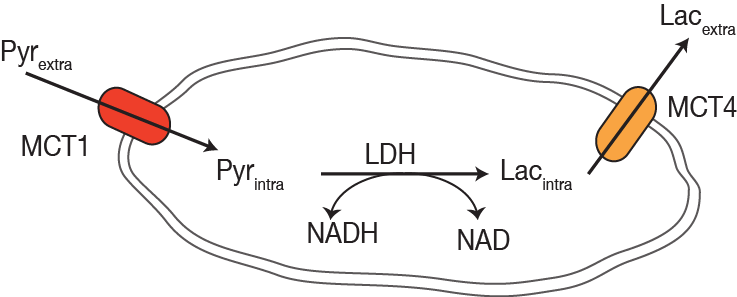
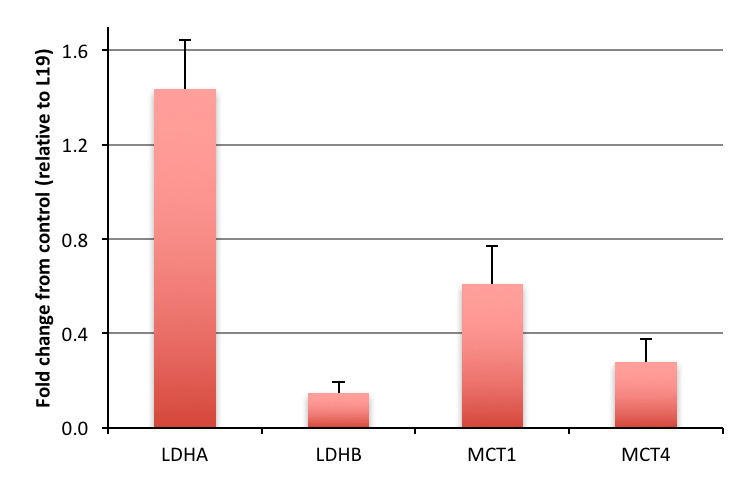
Hyperpolarized lactate signal was significantly elevated in activated macrophages, 3.66±0.33 (*e-3, p=0.0001) (via LPS stimulation) when compared to control (1.02±0.23 *e-3). The hyperpolarized lactate signal was significantly decreased after treatment back to 1.38±0.24 (*e-3, p=0.0001) (Figure 1). The hallmark of stimulated macrophages (or M1 polarization) is the production of NO. Macrophage activation and treatment affect was also confirmed by changes in NO production: LPS stimulated macrophages had 18±2 mM NO which with treatment reduced by 50% (SE: ±3%), while the control cells had negligible NO production. Furthermore, the increased hyperpolarized lactate signal can be correlated to the multiple factors (Figure 2) compounding to produce the 3.5 fold increase after LPS stimulation, such as enzyme/transporter expression, LDH activity and NADH levels. Figure 3 shows the RNA expression of stimulated macrophages relative to control cells (normalized to the housekeeping gene L19). Significantly increased LDHA expression with a concomitant increase in the monocarboxylate tansporters (MCT1 and MCT4), synergistically promote increased lactate production as well as its efflux. The LDH activity was also significantly (p<0.005) increased in stimulated cells by 50% (SE: ±8%). Lastly the cofactor necessary for the interconversion of lactate and pyruvate, i.e. NADH, also is strikingly increased by 50% (SE: ±9%, p=0.0059) in the activated macrophages.Results and Discussion
We have clearly demonstrated that activated macrophages have an increased lactate production that can be detected by hyperpolarized carbon-13 MR. Additionally the hyperpolarized lactate signal also serves as a biomarker of therapeutic response, as it decreases to baseline levels after treatment. Our observations of increased lactate and LDH are in line with elevated glycolysis characteristic of the inflammatory cells2. Upregulation of MCT4, the monocarboxylate transporter purportedly adapted for lactate export, suggests a compensatory effect to extrude the greater amounts of lactate produced by the activated macrophages. This cell model system may pave the way for future preclinical testing of hyperpolarized 13C-pyruvate and alterations in its conversion to lactate as a non-invasive imaging biomarker for the detection and treatment monitoring of inflammation.Acknowledgements
We would like to thank Sukumar Subramaniam, Dave Korenchan, Jinny Sun and Romelyn DeLos Santos for their help with the experiments.References
1. Keshari KR, Wilson DM, Van Criekinge M, Sriram R, Koelsch BL, Wang ZJ, VanBrocklin HF, Peehl DM, O'Brien T, Sampath D, Carano RA, Kurhanewicz J. “Metabolic response of prostate cancer to nicotinamide phophoribosyltransferase inhibition in a hyperpolarized MR/PET compatible bioreactor. Prostate.” 2015 Oct;75(14):1601-9. doi: 10.1002/pros.23036.
2. Boscá L, González-Ramos S, Prieto P, Fernández-Velasco M, Mojena M, Martín-Sanz P, Alemany S. “Metabolic signatures linked to macrophage polarization: from glucose metabolism to oxidative phosphorylation.” Biochem Soc Trans. 2015 Aug;43(4):740-4. doi: 10.1042/BST20150107.
Figures