3603
Multiparametric tumor characterization using simultaneous 1H-MRI, [18F]FDG PET and hyperpolarized [1-13C]pyruvate MRSI1Department of Nuclear Medicine, Klinkum rechts der Isar, Munich, Germany, 2Department of Chemistry, Technical University Munich, Munich, Germany, 3Department of Radiology, Medical Physics, Medical Center - University of Freiburg, Faculty of Medicine, University of Freiburg, Freiburg, Germany, 4German Consortium for Translational Cancer Research (DKTK), Partnersite Freiburg, German Center for Cancer Research (DKFZ), Heidelberg, Germany, 5Department of Clinical Physiology, Nuclear Medicine & PET, Rigshospitalet, Copenhagen, Denmark, 6Department of Radiology, Klinikum rechts der Isar, Munich, Germany, 7Deparment of Medical Engineering, Technical University Munich, Munich, Germany
Synopsis
In order to understand complex mechanisms of the tumor biology, multimodal imaging approaches are useful. Here we present a workflow to characterize subcutaneous MAT-B-III tumors in rats on a clinical 3T PET/MR. Proton imaging was used for tumor localization and to characterize tumor cellularity by diffusion-weighted imaging. Glucose uptake and downstream glucose metabolism of pyruvate by lactate dehydrogenase (LDH) was addressed by [18F]FDG-PET and hyperpolarized [13C]pyruvate metabolic imaging. The [18F]FDG standard uptake values and the LDH activity were consistently and reproducibly higher compared to normal tissue.
Introduction
Multimodal imaging is a powerful approach not only for tumor localization and characterization, but also to understand tumor biology better.1 Metabolic imaging using 13C-labelled substances is a relatively new technique triggered by the invention of dissolution dynamic nuclear polarization, enabling sensitivity gains by several orders of magnitude.2 Here we present a multiparametric workflow to characterize the tumor biology and compare the glucose uptake rate and glucose downstream metabolism by [18F]FDG-PET and hyperpolarized [13C]pyruvate imaging (hyperPET3) combined with 1H-MRI.Methods
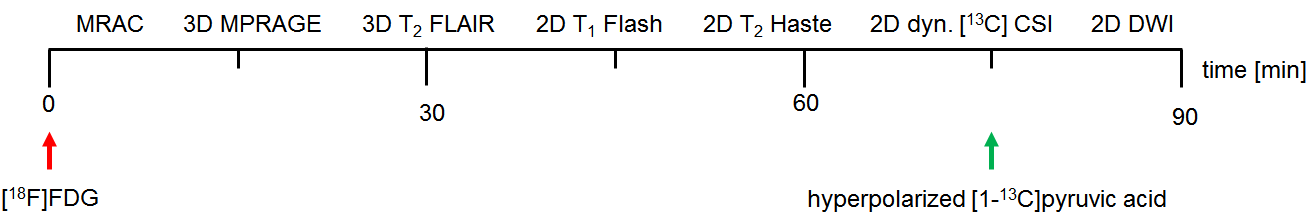
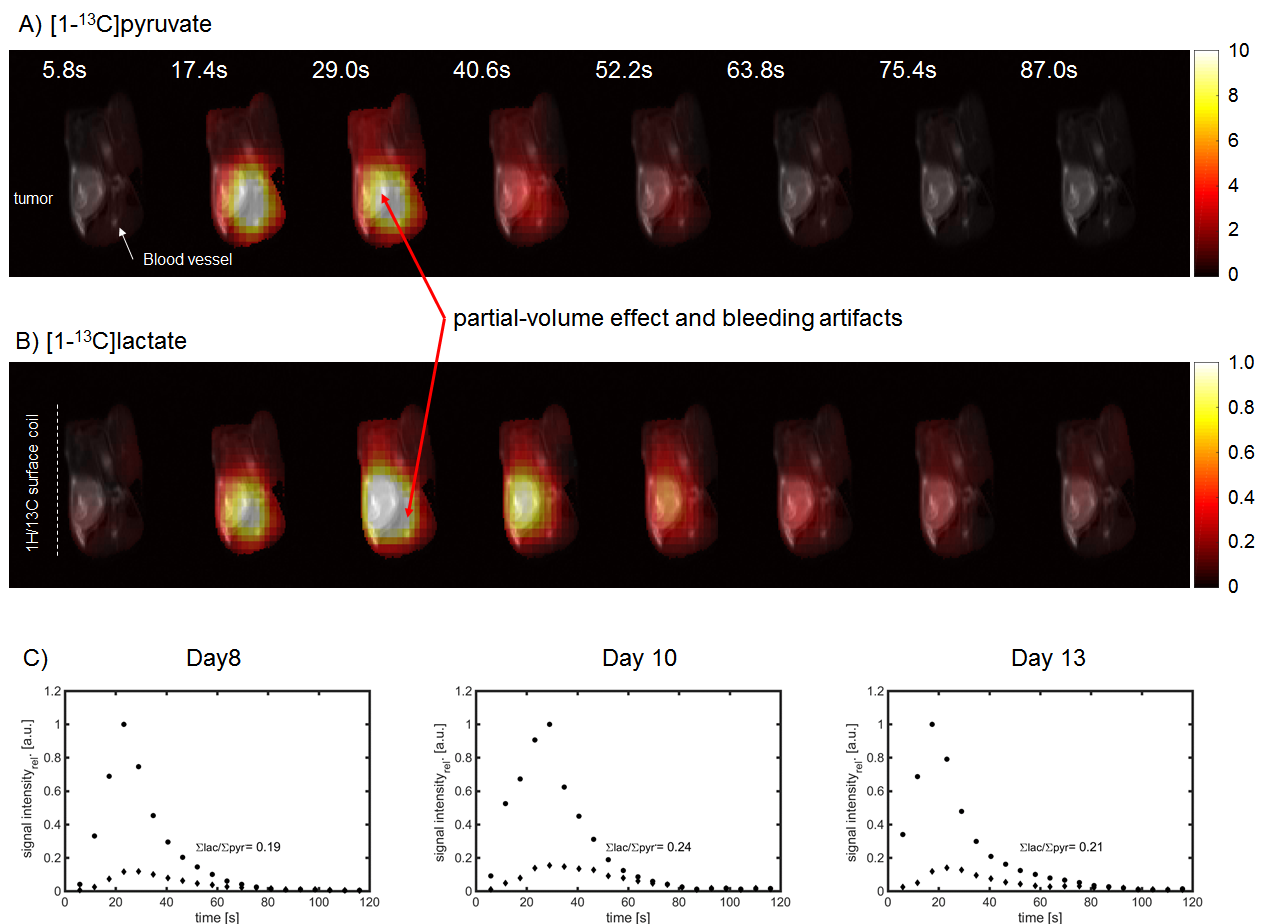
Multimodal imaging was performed 8, 10 and 13 days after cell implantation in four female Fischer344 rats (Charles River, right flank, subcutaneously, 1x10⁷ cells/200µL). Before and after each session, blood glucose and lactate levels were measured. Breathing and blood oxygenation were monitored continuously. 11±2MBq [18F]FDG were injected via the tail-vein followed by a 90min PET acquisition. Simultaneously, we applied the following proton and [13C]MRSI protocol: MRAC, 3D T2-FLAIR, 3D MPRAGE, 2D T1-FLASH, 2D T2-HASTE, diffusion-weighted imaging and 2D [13C]-CSI (Fig. 1). CSI acquisition parameters are given in Fig. 3. Pyr-samples were hyperpolarized (Hypersense, Oxford instruments), dissolved (90±3mM , pH7.5±0.2) and transferred to the animal within 22±2s. 13C-imaging and injection (duration 22±4s) were started simultaneously. For tumor cellularity characterization, ADC-maps from diffusion-weighted images were calculated (b-values=10, 150, 300, 500, 700s/mm2).4
PET data were acquired in list-mode format and reconstructed using 3D osem. Tumor standard uptake values (SUV50, 50%>SUVmax) were measured in the last dynamic 15min frames. Pyr and lactate (lac) signal areas were integrated over whole tumor regions of interest (ROI) defined in T2-HASTE images. Metabolic activity of LDH is given as the ratio of summed signals of the lac and pyr metabolic time-course (∑lac/∑pyr).5
Results and Discussion
Physiological parameters of all examined animals are summarized in Fig. 2. Metabolite maps of an axial slice of one animal are shown in Fig. 3A and B. Pyr to lac conversion is mainly seen in the tumor and the mean ∑lac/∑pyr-value of all experiments was 0.23±0.07. The images reveal bleeding artifacts and partial volume effects of pyr and lac. ∑lac/∑pyr values for smaller tumors located close to a vessel are therefore smaller than those of larger tumors. Fig. 3C shows reproducible dynamic pyr and lac metabolite time-courses of a tumor.
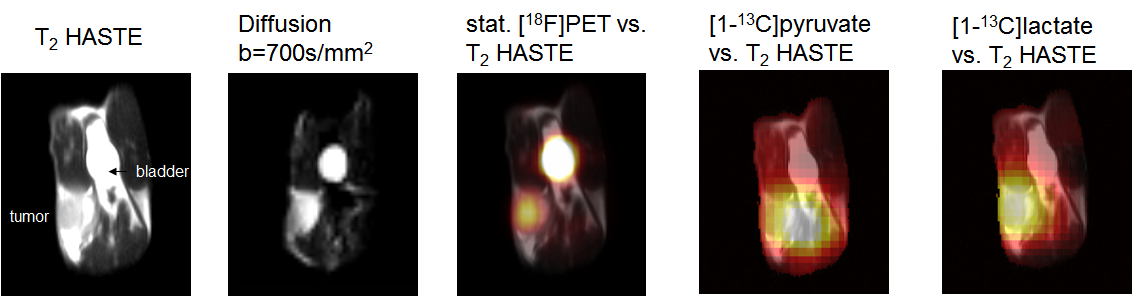
ADC-values of whole tumor ROIs increased for older/larger tumors (0.83±0.28, 1.03±0.21 and 1.18±0.21x10⁻³mm2/s for each respective day). This indicates a decrease in cellularity, probably due to the formation of necrosis, which was also observed with PET. Analysis of non-necrotic tumor tissue shows constant ADC-values over time (ADCmean=0.50±0.03mm2/s).
Our multimodal imaging protocol allowed to co-register and overlay images of different contrast mechanisms, including T2-weighted images, diffusion-weighted images, static PET, and metabolite maps of pyr and lac (Fig. 4). An accumulation of [18F]FDG was found in the tumor, which correlates well with a higher tumor LDH activity compared to non-malignant tissue. The FDG uptake appears to be constant for all experiments (SUV50=6.7±1.8), which was also shown for the LDH activity.
Conclusion
We presented a multimodal workflow for tumor characterization using 1H-MRI and hyperPET. The FDG uptake and the LDH activity appear to be constant for all measurements. However, low spatial resolution, partial volume effects and bleeding artifacts need to be taken into account for a more accurate ∑lac/∑pyr estimation. Increasing the spatial resolution or using more advanced imaging approaches could compensate for such effects. We are therefore currently evaluating steady state sequences.Acknowledgements
EU Grant No. 294582 (MUMI), DFG (SFB 824)References
1 Serrao, E. M. & Brindle, K. M. Potential Clinical Roles for Metabolic Imaging with Hyperpolarized [1-13C]Pyruvate. Frontiers in Oncology 6, doi:10.3389/fonc.2016.00059 (2016).
2 Ardenkjaer-Larsen, J. H. et al. Increase in signal-to-noise ratio of > 10,000 times in liquid-state NMR. Proceedings of the National Academy of Sciences of the United States of America 100, 10158-10163, doi:10.1073/pnas.1733835100 (2003).
3 Gutte, H. et al. Simultaneous hyperpolarized (13)C-pyruvate MRI and (18)F-FDG-PET in cancer (hyperPET): feasibility of a new imaging concept using a clinical PET/MRI scanner. American journal of nuclear medicine and molecular imaging 5, 38-45 (2015).
4 Padhani, A. R. et al. Diffusion-Weighted Magnetic Resonance Imaging as a Cancer Biomarker: Consensus and Recommendations. Neoplasia 11, 102-125 (2009).
5 Hill, D. K. et al. Model free approach to kinetic analysis of real-time hyperpolarized 13C magnetic resonance spectroscopy data. PloS one 8, e71996, doi:10.1371/journal.pone.0071996 (2013).
Figures