3602
3D CMRO2 Mapping in Human Brain with Direct 17O-MRI: Comparison of Methods for Image Reconstruction and Partial Volume Correction1Dept. of Radiology, Medical Physics, Medical Center – University of Freiburg, Freiburg, Germany, 2German Cancer Consortium (DKTK), Heidelberg, Germany, 3German Cancer Research Center (DKFZ), Heidelberg, Germany
Synopsis
This study presents a comparative analysis of different reconstruction techniques for quantification of 3D maps of the cerebral metabolic rate of oxygen consumption (CMRO2) in human brain. CMRO2 maps were calculated from a direct 17O-MRI experiment at 3T in which 17O gas was inhaled. Conventional Kaiser-Bessel reconstruction of 17O MR images was compared to two iterative reconstruction methods using total variation (TV) and anisotropic diffusion (AD) of coregistered proton data as constraints. AD-constraint reconstruction, which acts as a non‑homogeneous edge‑preserving smoothing filter, enabled CMRO2 mapping at clinical field strengths by increasing the SNR, and reducing partial volume effects.
Introduction
Oxygen metabolism is altered in brain tumors and neurodegenerative diseases, and can be assessed by the cerebral metabolic rate of oxygen consumption (CMRO2). CMRO2 can be measured by either 15O-PET [1] or by direct 17O-MRI with administration of 17O-enriched gas [2–6]. Recently, we performed a profile likelihood (PL) analysis that shows that CMRO2 can be reliably quantified with 17O-MRI [6].
The purpose of this study was to enable 3D CMRO2 quantification with 17O-MRI at 3T with partial volume effects (PVE) correction. Therefore, conventional Kaiser-Bessel (KB) gridding was compared to iterative reconstruction techniques with a total variation (TV) constraint and with a proton-based constraint using coregistered 1H-MR data of higher spatial resolution as prior information. Here, an anisotropic diffusion (AD) metric of 1H-MR data was used as an edge-preserving constraint [7]. Reconstructions were compared for numerical 17O‑MRI phantom and in vivo 17O‑MRI images and CMRO2 maps.
Material and Methods
Direct 4D 17O-MR data of a male volunteer (50 years) were acquired with a 3D UTE density-adapted radial sequence [8] (nominal resolution Δx=10mm, temporal resolution Δt=1min) in an 17O-MRI inhalation experiment [6] (3L of 70%-enriched 17O gas; NUKEM Isotopes Imaging) at 3T (Siemens Magnetom TIM Trio) using a custom-built Tx/Rx 17O quadrature head coil.
For all 17O-MR phantom and in vivo images, KB gridding without/with Hanning filtering (KBwH/KBnH) was used. After gridding, the two iterative reconstructions were applied: TV-constraint and AD-constraint [7].
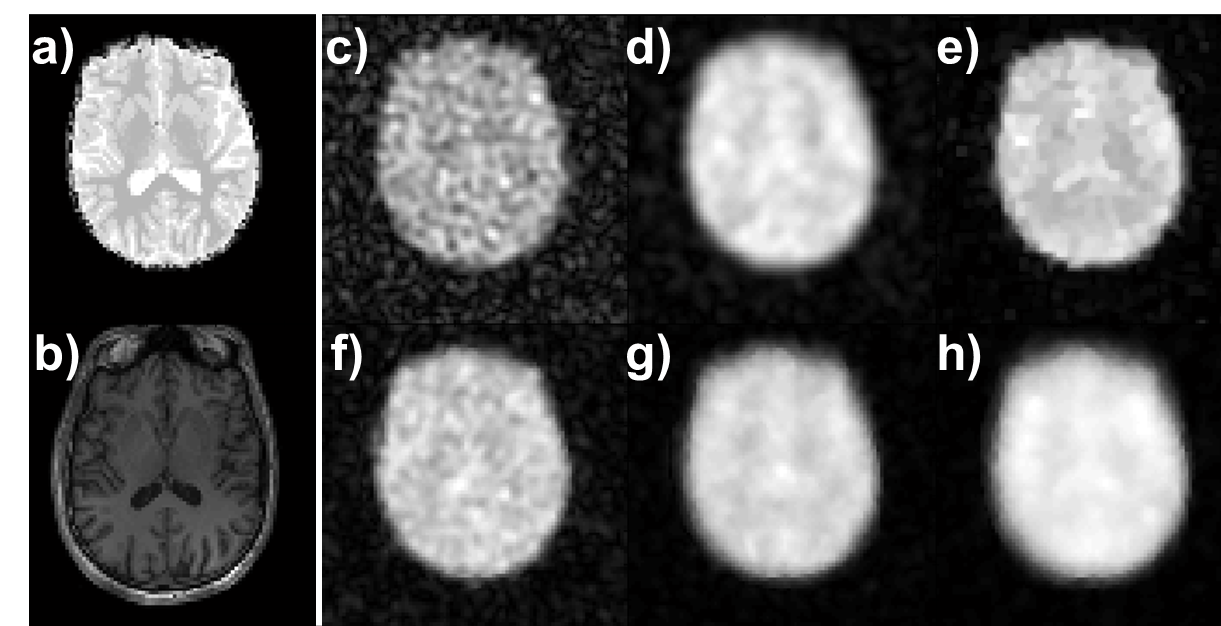
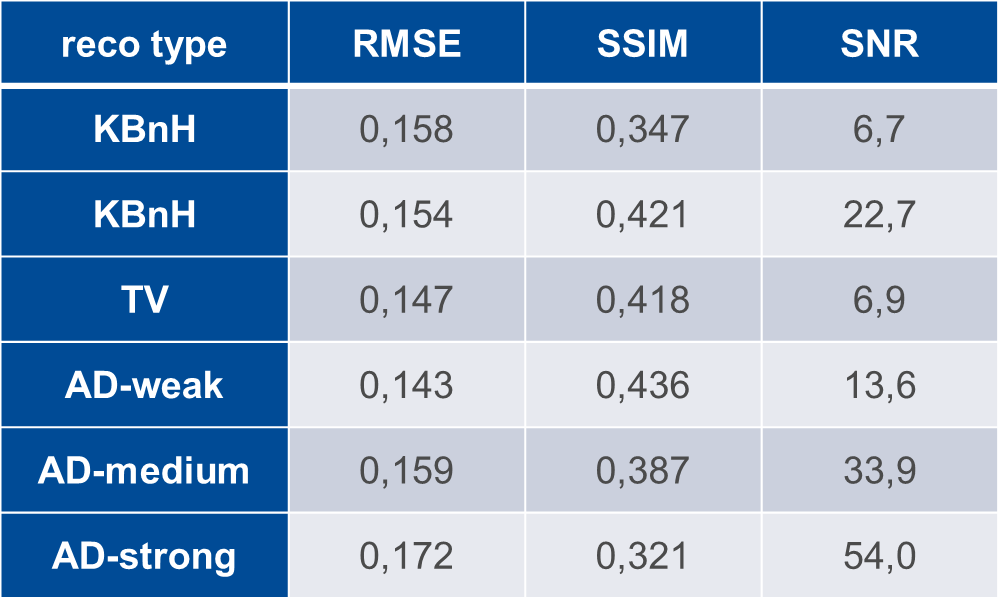
First, 17O MRI phantom images were reconstructed with different weighting factors for TV/AD constraints (λTV/λAD) over the range λ∈[10-3…10-5] to identify the values which give the best correspondence with the original phantom image. Therefore, root-mean-square error (RMSE) and structural similarity (SSIM, [9]), which is based on image luminance, contrast and structure comparison, were calculated. RMSE, SSIM, and SNR values, which were calculated by a pseudo-multiple-replica approach [10], were used for comparison of quality and precision of different reconstructions.
Second, optimized 𝜆 values were used to reconstruct in vivo 17O-MR images. 3D CMRO2 maps were calculated for all reconstruction techniques from a realistic pharmacokinetic model with PL-based confidence intervals (CI) [6]. The percentage P of the pixels (Pnot-fitted), for which CMRO2 mapping failed due to low SNR, was then calculated.
Finally, CMRO2 values and corresponding CIs calculated from the signal averaged over 10 pixels (V=10 ml) with GM/WM content higher than 73%/87% were used to quantify GM/WM tissue separation and PVEs correction.
Results and Discussion
In the 17O-MRI phantom (Fig.1), KBwH led to increase in SSIM by 21% and in SNR by 338% (Tab.1) compared to KBnH, whereas TV-constrained reconstruction resulted in 7%/20% better RMSE/SSIM values, but did not substantially change SNR values. AD‑constrained reconstruction with λ=10, denoted by AD-weak, showed best correspondence with the original image (Fig. 1a) with 9%/26% improvement in RMSE/SSIM compared to KBnH. However, the SNR values were 40% lower compared to KBwH. Higher λAD values (λAD=50/100 denoted by AD-medium/strong) were also investigated and gave 49%/138% higher SNR, but a 3%/12% and 7%/24% worse RMSE and SSIM, compared to KBwH.
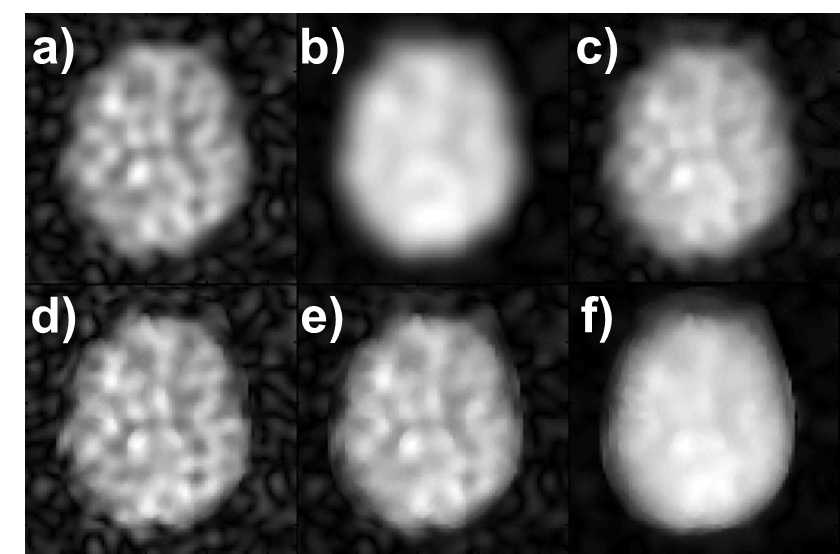
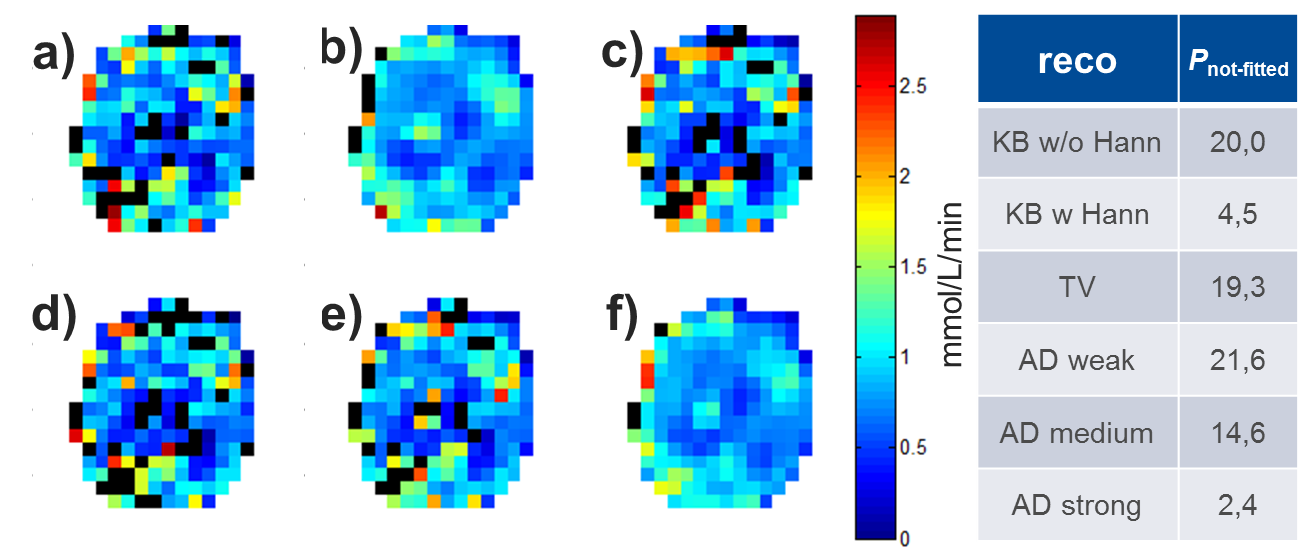
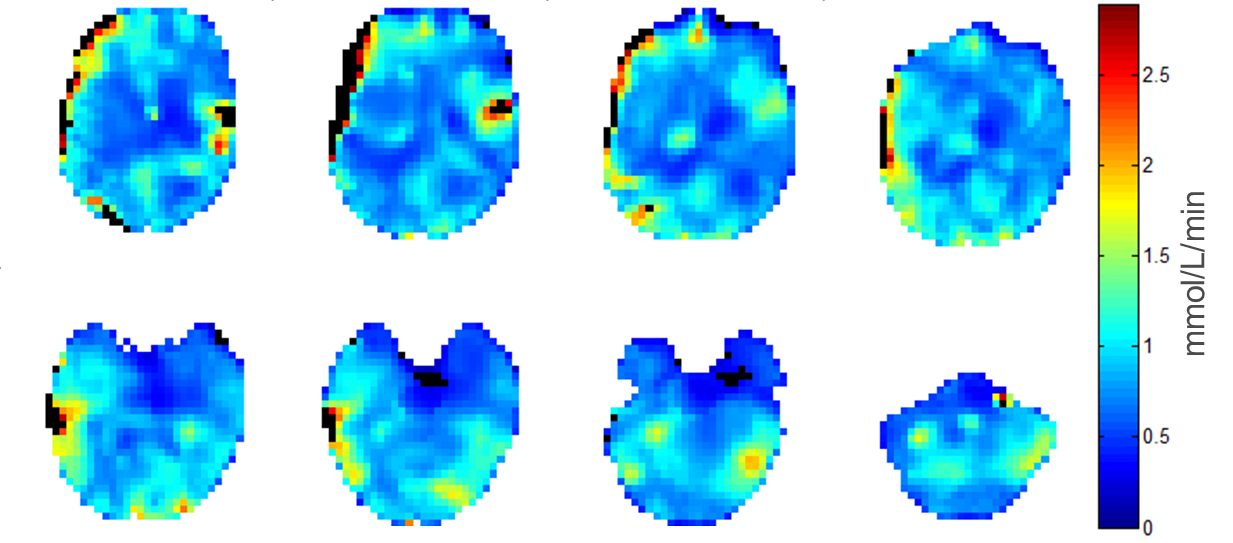
In vivo images reconstructed with different methods showed that KBwH and AD‑strong reconstruction (λAD=1000) yields a substantial SNR increase and made ventricles circumscribable (Fig. 2). With AD-strong reconstruction, fine GM structures could be seen. CMRO2 maps of different reconstruction techniques showed that only AD-strong and KBwH reconstructions provide CMRO2 maps with sufficient quality – the other methods had Pnot‑fitted>14% (Fig. 3). AD‑strong had Pnot-fitted=2.4%, which is 47% smaller then KBwH. CMRO2 maps of AD-strong method interpolated to a larger matrix (Fig. 4), reveal CMRO2 differences in various brain tissues: smaller CMRO2 in WM and CSF regions compared to GM regions.
CMRO2 values in small GM/WM regions were 0.82/0.76 µmol/gtissue/min for KBwH and 0.84/0.74 µmol/gtissue/min for AD-strong. GM and WM separation for AD-strong was 70% better compared to KBwH. PL-based CIs for the AD technique were 11/13% smaller compared to conventional reconstruction. Filtering among the neighboring pixels was beneficial: AD method smoothed data among pixels with similar intensity (mostly within one brain tissue component) and preserved borders within different tissue compartments (edge‑preservation), which is favorable compared to isotropic homogeneous Hanning filtering.
Conclusions and Outlook
The results show that smoothing among neighboring pixels enables quantification of 3D CMRO2 maps in dynamic 17O-MR experiments. TV-constraint reconstruction does not provide a substantial SNR increase. Iterative reconstruction with edge-preserving proton-based AD constraint is favorable and corrects for PVEs. The reconstruction techniques are planned to be applied in further dynamic 17O-MR experiments on patients with brain tumors (e.g., glioblastoma) to investigate the metabolism of different tumor regions.Acknowledgements
Support from NUKEM Isotopes Imaging is gratefully acknowledgedReferences
[1] Leenders KL, Perani D, Lammertsma AA, Heather JD, Buckingham P, Healy MJ, Gibbs JM, Wise RJ, et al. Cerebral blood flow, blood volume and oxygen utilization. Normal values and effect of age. Brain 1990;113:27–47.
[2] Atkinson IC, Thulborn KR. Feasibility of mapping the tissue mass corrected bioscale of cerebral metabolic rate of oxygen consumption using 17-oxygen and 23-sodium MR imaging in a human brain at 9.4 T. Neuroimage 2010;51:723–733.
[3] Hoffmann SH, Begovatz P, Nagel AM, Umathum R, Schommer K, Bachert P, Bock M. A measurement setup for direct 17O MRI at 7 T. Magn. Reson. Med. 2011;66:1109–1115.
[4] Hoffmann SH, Radbruch A, Bock M, Semmler W, Nagel AM. Direct 17O MRI with partial volume correction: first experiences in a glioblastoma patient. MAGMA 2014;27:579–87.
[5] Borowiak R, Kurzhunov D, Wagner P, Reisert M, Bock M. Dynamic 17O-MRI at 3 Tesla for in vivo CMRO2 Quantification. In: In proceedings of 23rd Annual Meeting of ISMRM; Toronto, Canada. ; 2015. p. 4633.
[6] Kurzhunov D, Borowiak R, Hass H, Wagner P, Krafft AJ, Timmer J, Bock M. Quantification of oxygen metabolic rates in Human brain with dynamic 17O MRI: Profile likelihood analysis. Magn. Reson. Med. 2017
[7] Kurzhunov D, Borowiak R, Wagner P, Reisert M, Bock M. Proton-Constrained CMRO2 Quantification with Direct 17O-MRI at 3 Tesla. In: In proceedings of 23rd annual meeting of ISMRM; Toronto, Ontario, Canada. ; 2015. p. 2450.
[8] Nagel AM, Laun FB, Weber M-A, Matthies C, Semmler W, Schad LR. Sodium MRI using a density-adapted 3D radial acquisition technique. Magn. Reson. Med. 2009;62:1565–1573.
[9] Wang Z, Bovik AC, Sheikh HR, Simoncelli EP. Image quality assessment: From error visibility to structural similarity. IEEE Trans. Image Process. 2004;13:600–612.
[10] Robson PM, Grant AK, Madhuranthakam AJ, Lattanzi R, Sodickson DK, McKenzie C. Comprehensive quantification of signal-to-noise ratio and g-factor for image-based and k-space-based parallel imaging reconstructions. Magn. Reson. Med. 2008;60:895–907.
[11] Borowiak R, Groebner J, Haas M, Hennig J, Bock M. Direct cerebral and cardiac 17O-MRI at 3 Tesla: initial results at natural abundance. MAGMA 2014;27:95–99.
Figures