3600
Post-mortem Cardiac and Skeletal Muscle 19F MRI of PFCE-labeled and FuGENE-transfected Cardiac Progenitor Stem Cells in the C57BL/6 Mouse1Cardiovascular Medicine, University of Oxford, Oxford, United Kingdom, 2Department of Tumor Immunology, Radboud University, Nijmegen, Netherlands, 3Physiology, Anatomy and Genetics, University of Oxford, Oxford, United Kingdom
Synopsis
Stem cell (SC) technologies constitute a potential new therapeutic approach aiming to achieve tissue regeneration. Despite advances in the visualization of pre-labeled SCs with SPIOs (1H MRI), and of nanoparticles (NPs) containing perfluoro-crown-ethers (PFCE) [2-4] in 19F MRI, there have been no prior reports on cardiac 19F imaging with direct SC injections. We report herein the implementation of a fast acquisition protocol for cardiac and skeletal muscle 19F imaging of the C57BL/6 mouse post-mortem, and identify the minimum cellular load for PFCE labels to achieve visualization following direct SC cell injections.
Introduction
Stem cell (SC) technologies constitute a potential new therapeutic approach aiming to achieve tissue regeneration. Despite advances in the visualization of pre-labeled SCs with SPIOs (1H MRI) [1], and with nanoparticles (NPs) containing perfluoro-crown-ethers (PFCE) [2-4] in 19F MRI, there have been no prior reports on cardiac 19F imaging following direct intra-cardiac SC injections. We report herein the implementation of a fast acquisition protocol for cardiac 19F imaging of the C57BL/6 mouse post-mortem that was optimized a priori on skeletal muscle, and identify the minimum cellular load for PFCE labels to achieve SC visualization.Methods
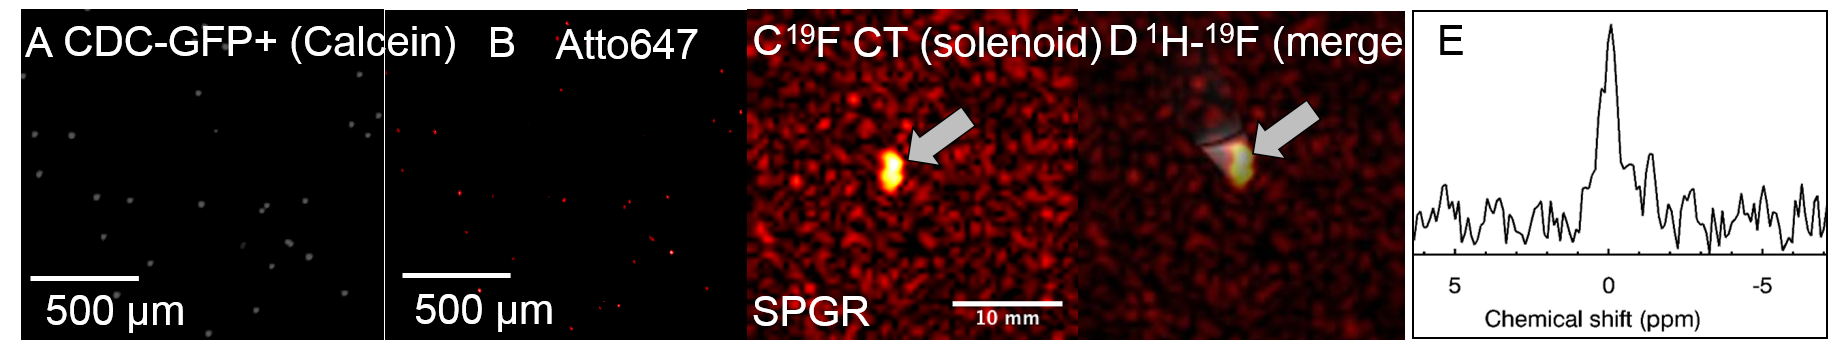
Cell Isolation/Labeling/Transfection: Cardiac progenitor cells (CPCs) were isolated from adult, C57BL/6 mouse atria, plated in IMDM, and incubated with PFCE-containing fluorescent NPs (Atto647) (10 mg/ml/million cells) and FuGENE (Promega, Madison, WI, USA) (25 μl in ~1 million cells) [5] for ~24 h [6]. Cell pellet suspensions were then used for MRI, confocal microscopy, and for flow cytometry after fixation in 2% paraformaldehyde solution. Successful labeling was confirmed using a CyAn ADP flow cytometer (Beckman Coulter, USA).
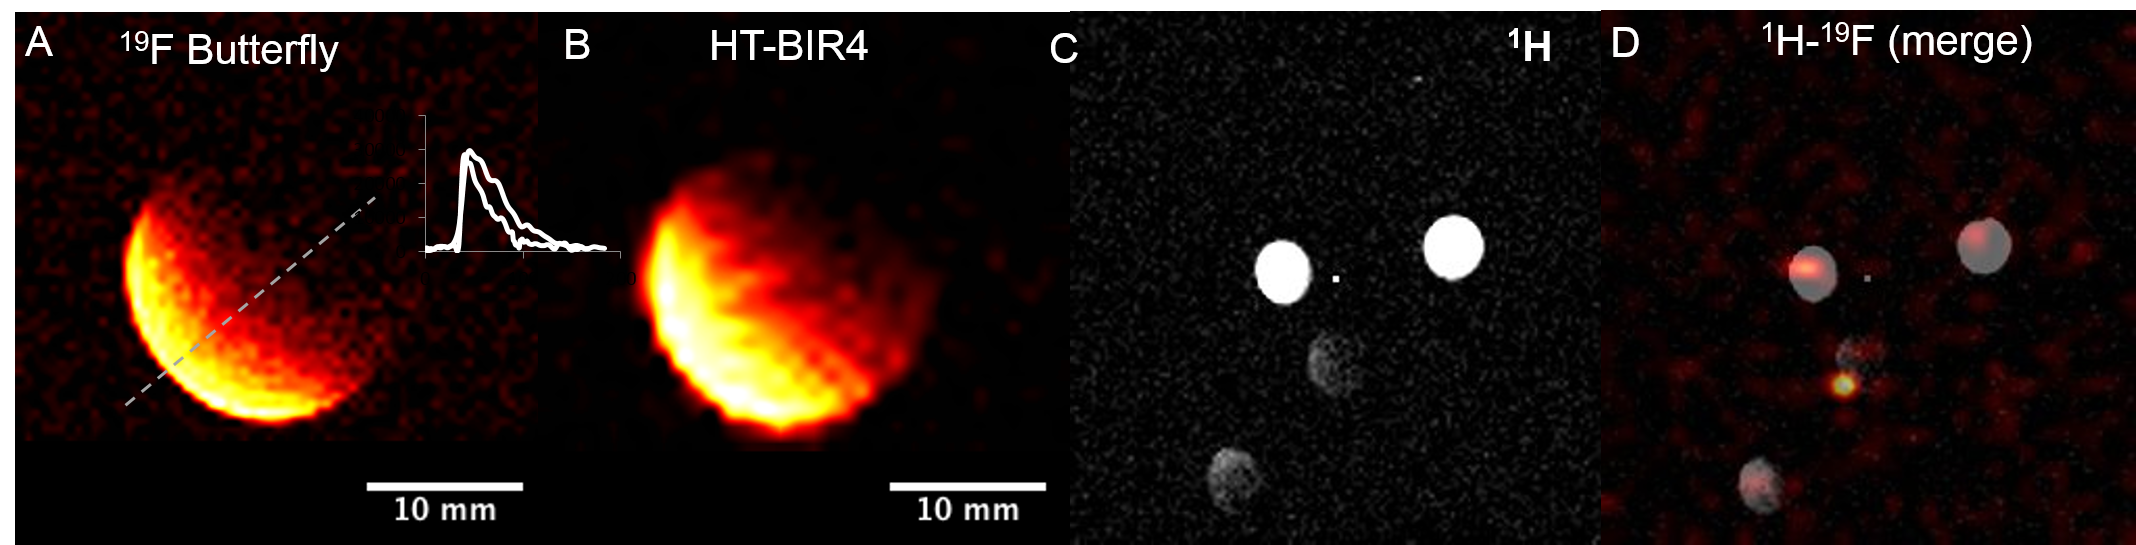
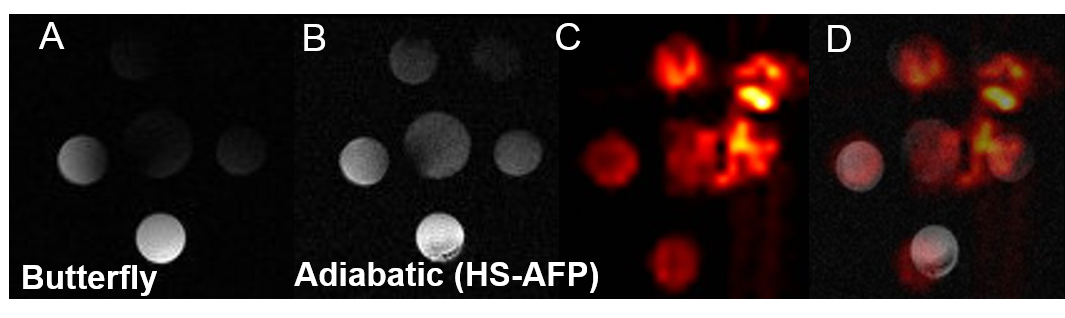
MRI/MRS: Radiofrequency (RF) Coils: An eight-rung, low-pass, quadrature birdcage (diameter=34 mm), a 40×20 mm2 butterfly (on a 28 mm diameter former), and a 5 (diameter) × 8 (length) mm2 solenoid, were constructed, tuned, and matched at 375.8 MHz for 19F-MRI. Aqueous/Cellular Phantoms and Relaxation Measurements: Phantoms (1-100 mM), contained TFA, PFCE NPs, or labeled CPCs. T1 and T2 measurements of phantoms were conducted (n=3) with the birdcage/solenoid coils using conventional inversion recovery and Carr-Purcell-Meiboom-Gill (CPMG) pulse sequences [a) T1: TR=5-8 s/512 points/number of excitations (NEX)=2-16/BW=4 kHz; b) T2: TR/TE=5 s/2 ms/2048 points/BW=4 kHz]. Adiabatic Excitation: Phantom studies (six vials with TFA at 5-10 mM) were conducted without/with the use of hyperbolic adiabatic half-passage (HS-AFP) and hyperbolic tangent B1-insensitive rotation (HT-BIR4) RF pulses [7-8] using the butterfly coil to determine ultimate concentration detection limits and B1 penetration [1H MRI: TR/TE=13.6/1.72 ms/α=50° (versus 180° for HS-AFP adiabatic excitation)/NEX=16/FOV=40×40 mm2/slice thickness (ST)=3 mm/BW=50 kHz/128×128; 19F MRI: TR/TE=8.7/4.4 ms/α=56° or 180° for HT-BIR4 and HS-AFP/NEX=8 or 1248/FOV=34×34 or 40×40 mm2/ST=5-6 mm/BW=4-8 kHz/32×32/BW HS-AFP/HT-BIR4=1.35 kHz/resolution=0.4 μs/cutoff=2-4%]. Cell Detection Threshold: Different cell densities (0.25-1 million CPCs) were labeled with NPs (10 mg/ml/million cells), transfected with FuGENE (25 μl/million cells), and imaged using SPGR with the butterfly coil [1H: TR/TE=62.34 ms/α=50°/NEX=2/ FOV=40×40 mm2/ST=2 mm/8 slices/BW=20 kHz/matrix=128×128; 19F: TR/TE=8.54/4.29 ms/α=180°/NEX=1024/FOV=40×40 mm2/ST=20 mm/BW=6 kHz/32×32, pulse width (HS-AFP)=3 ms/BW=1.35 kHz/resolution=4 μs/4% cutoff]. For MRS solenoid acquisitions: TR=500 ms/NEX=256/512 points/BW=20 kHz.
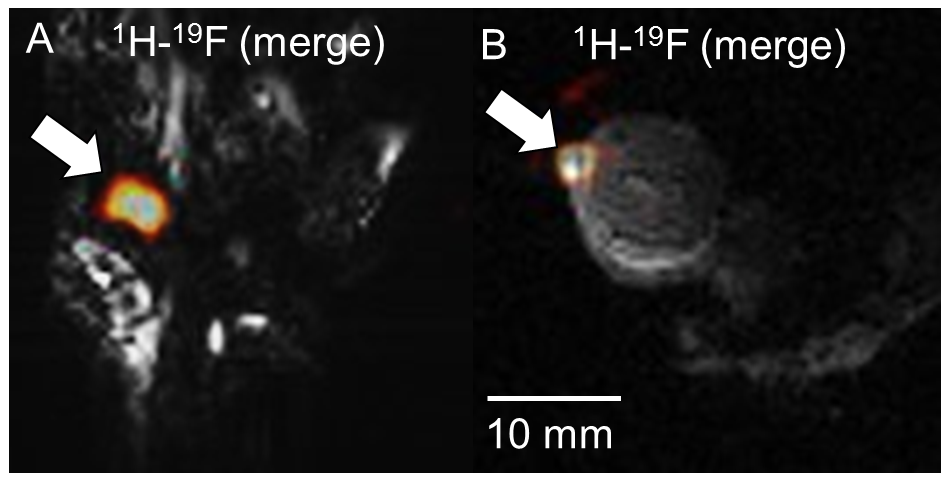
Post-Mortem Animal Model: Skeletal/Cardiac 19F-MRI: Labeled cells (~2.5x10⁶ in ~100 μl IMDM) were injected in the anterior left ventricular muscle and on the femoral area of the mouse hindlimb post-mortem in two mice, and imaged (butterfly coil). 1H images were acquired with the SPGR sequence (2D/3D acquisitions) using TR/TE=25.92/11.31 ms/α=50°/NEX=6/FOV=60×60 mm2/10 slices/ST=3.5 mm/128×128 (or 128×128×128), in 2.54 min. For 19F MRI: TR/TE=5.71-6.32/2.87-3.16 ms/α=30-50°/ NEX=1048-2096/FOV=50-60×50-60 mm2/ST=35 mm/BW=6 kHz/32×32, in 3.11-7.40 min. Image Processing: 19F images were processed in ImageJ (NIH, Bethesda, USA), and MRS spectra (TR=2 or 20 s, 512 points, BW=20 kHz, NEX=4 or 16, α=90°) in CSX (Johns Hopkins, USA) and IDL (Harris Geospatial, USA). Statistical Analyses: All results are mean ± standard deviation (SD). Two-tailed student t-tests determined relaxation changes post-labeling (XLSTAT, Addinsoft, USA).
Results
Relaxation values for NP solutions and transfected CPCs, respectively were: T1=773±36 and 1360±90 ms (p<0.001); T2=360±4 ms and 530±70 ms (p=NS). Increased field penetration (by 2.3 mm) was achieved with adiabatic (BIR4) excitation with the butterfly coil (Fig. 1), based on mid-profile locations where the signal fell to half its maximum value. The minimum detectable load of transfected CPCs was ~500k (or ~10k cells/voxel) in fast acquisitions (~3–5 min) using the butterfly coil (Fig. 1C-D). Successful implementation of the adiabatic pulses for 1H and 19F MRI using the butterfly coil enabled imaging of 19F concentrations of TFA solutions down to ~1 mM (Fig. 2). Successful labeling was confirmed with confocal microscopy (Fig. 3A-B) and flow cytometry (not shown). Additionally, MRS/MRI allowed quantification of progenitor cell NP concentrations (fully relaxed MRS, at 7.5–10 mg/ml/million cells) (Figure 3C-E) of the order of 0.3–0.5 mM (solenoid) and of ~2.5x10⁶ labelled CPCs injected post-mortem (Fig 4). The in vitro load detection thresholds for 19F PFCE labels (based on cell and TFA experiments) were 0.5 mM and 10 mM (butterfly vs. birdcage).Discussion
We demonstrate fast, cardiac/skeletal muscle 19F MRI post-SC injections in the mouse. The T1/T2 of PFCEs agreed with prior reports [6], while a T1-effect was demonstrated post-labeling/transfection possibly attributed to the mechanism of vesicular cellular uptake of FuGENE-packaged PFCE labels.Acknowledgements
The project leading to this abstract has received funding (CC) from the European Union’s Horizon 2020 research and innovation programme under the Marie Sklodowska-Curie grant agreement No 652986 and BHF grant FS/11/50/29038; and European Research Council (ERC) Starting Grant ERC-2013-StG-336454.References
1. Stuckey DJ, Carr CA, Martin-Rendon E, Tyler DJ, Willmott C, Cassidy PJ, Hale SJM, Schneider JE, Tatton L, Harding SE, Radda GK,Watt S, Clarke K. Iron particles for noninvasive monitoring of bone marrow stromal cell engraftment into, and isolation of viable engrafted donor cells from, the heart. Stem Cells 2006; 24:1968-1975.
2. Srinivas M, Morel PA, Ernst LA, Laidlaw DH, Ahrens ET. Fluorine-19 MRI for visualization and quantification of cell migration in a diabetes model. Magnetic Resonance in Medicine 2007; 58:725–734
3. Srinivas M, Cruz LJ, Boneto F, Heerschap A, Figdor CG, de Vries IJM. Customizable, multi-functional fluoricarbon nanoparticles for quantitative in vivo imaging using 19F MRI and optical imaging. Biomaterials 2010; 31:7070–7077.
4. Gomes RSM, das Neves RP, Cochlin L, Lima A, Carvalho R, Korpisalo P, Dragneva G, Turunen M, Liimatainen T, Clarke K, Yia-Herttuala, Carr C, Ferreira L. Efficient pro-survival/angiogenic miRNA delivery by an MRI-detectable nanomaterial. ACS Nano 2013; 7(4):3362–3372.
5. Constantinides C, McNeill E, Benson M, Urruela RS, Padilla S, Malandraki-Miller S, Maguire ML, Swider E, Ghaffari S, Carr CA, Srinivas M, Schneider JE. Improvements in the Cellular Uptake of Perfluorocarbon Nanoparticles and 19F MRS/MRI Detectability using the Transfection Agent FuGENE. ISMRM Workshop on Molecular and Cellular MRI: Focus on Integration: Amsterdam, Netherlands, June 2016.
6. Srinivas M, Philipp Boehm-Sturm P, Figdor CG, de Vries IJ, Hoehn M. Labeling cells for in vivo tracking using 19F MRI. Biomaterials 2012; 33:8830–8840.
7. Garwood M, Yong K. Symmetric pulses to induce arbitrary flip angles with compensation for RF inhomogeneity and resonance offsets. Journal of Magnetic Resonance 1991; 94:511–525.
8. Silver MS, Joseph RI, Hoult DI. Highly selective π/2 and π pulse generation. Journal of Magnetic Resonance 1984; 59:347–351.
Figures