3599
19F-based MRI cell tracking shows that the density of tumour associated macrophages in breast tumours corresponds to tumour aggressiveness and metastatic potential1Medical Biophysics, Western University, London, ON, Canada, 2Robarts Research Institute, London, ON, Canada
Synopsis
Tumour associated macrophages (TAMs) have been associated with tumour aggressiveness, including tumour growth and metastatic potential. 19F-based MRI is used in this study to track these cells in vivo, revealing the ability to differentiate TAM content between 3 murine models of breast cancer. Highly aggressive tumours had significantly higher 19F signal when compared to the low and non aggressive variants. This information may be of use as a biomarker, to differentiate between tumours with high infiltration of TAMs, which have the propensity to metastasize and progress quicker, versus tumours with less TAMs, which may not advance as quickly.
Introduction
The presence of tumour associated macrophages (TAMs) correlates strongly with poor outcomes in patients with breast cancer.1 Inflammation has long been associated with cancer and it is becoming clear that tumour promotion and progression are dependent on processes provided by cells in the tumour microenvironment, ie. TAMs.2 Despite strong evidence for a link between TAM content and outcome, there are few strategies for measuring TAMs in breast tumours and currently no in vivo approach. Here we demonstrate for the first time that fluorine-19 (19F)-based MRI cell tracking can be used to evaluate the density of TAMs in vivo in breast tumours and we show that TAM density correlates with tumour aggressiveness (metastatic potential and tumour growth) in three murine models of breast cancer.Methods
Three isogenic murine breast cancer cell lines were utilized: (1) 4T1, (2) 168FARN and (3) 67NR. 300,000 cells were injected orthotopically into the mammary fat pad in 3 separate groups of female BALB/c mice. 4T1 is known to be highly metastatic (nodes, bone, brain), 168FARN cells only metastasize to lymph nodes and 67NR cells are not metastatic. Mice (n=19) were imaged at 3 weeks post cancer cell implantation. Images were acquired 24 hours after intravenous (IV) injection of a red fluorescent perfluorocarbon (PFC) agent. Full body 1H and 19F images were acquired at 9.4T using a custom built 1H/19F birdcage coil. Images were acquired using a balanced steady state free precession (bSSFP) pulse sequence with spatial resolutions of 0.5x0.5x1.0 mm3 (19F) and 200x200x200 μm3 (1H). Image Analysis: Images were assessed for regions of 19F signal and the number of 19F spins per tumour was quantified by relating the detected 19F signal within the tumour to the 19F signal generated by a reference tube containing a known amount of 19F spins. Tissue Analysis: Mice were euthanized and tumours excised immediately following MRI. Tumour tissue was examined using fluorescence microscopy to detect the Texas Red fluorescence of the PFC and then stained using the anti-F4/80-FITC antibody to identify macrophages. Immunohistochemistry and fluorescence were compared with MRI images.Results
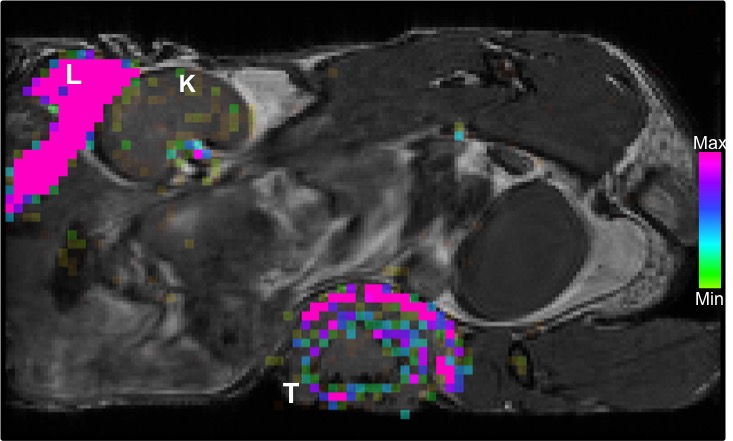
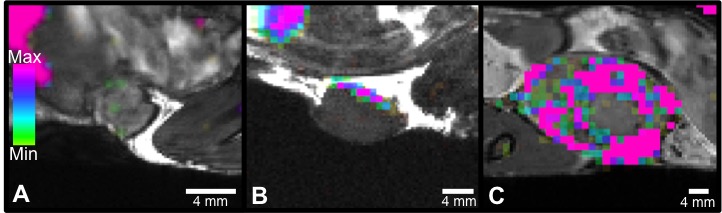
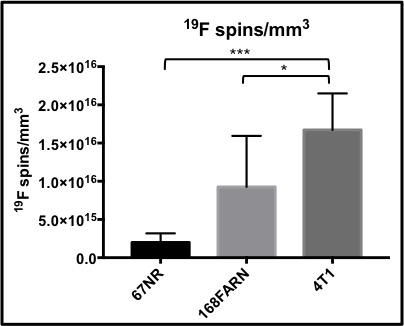
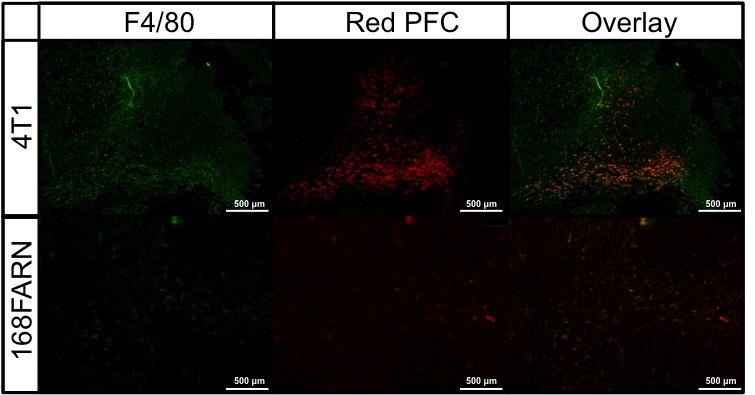
19F signal was routinely observed in the liver and spleen due to uptake of the PFC agent by resident macrophages. Figure 1 shows a mouse body bSSFP 1H image with 19F signal overlayed on the liver and tumour. 19F signal was observed in all tumours, with the greatest amount of signal in 4T1 tumours. Figure 2 shows representative images of the 19F signal for each tumour type. The average number of 19F spins for the 4T1, 168FARN and 67NR tumours was 4.7E18, 1.1E18 and 1.9E17. Tumour volumes were also measured. The average tumour volumes were 576.5, 104.9 and 70 mm3, respectively. Since the 4T1 tumours were significantly larger compared to the other tumour types, the 19F spins were normalized to tumour volume. The 19F spins/mm3 for all tumours in each group is presented in Figure 3 and clearly shows that the highly aggressive and metastatic 4T1 tumours contain significantly higher numbers of 19F spins. Fluorescence microscopy was used to validate that tumours contained PFC-labeled macrophages. Figure 4 confirms colocalization of the PFC agent (red) and TAMs (green) by fluorescent microscopy in all three tumour models. There are visually more cells that are PFC+/F4/80+ in 4T1 tumours when compared to both the 168FARN and 67NR tumours.Conclusion
19F-based MRI cell tracking allows us to differentiate between tumours that are heavily infiltrated with TAMs and those with fewer TAMs. Overall, high infiltration of TAMs in breast tumours predicts unfavourable outcomes. The ability to detect, quantify and track TAMs will allow for study of important, unanswered questions about TAMs and the tumour microenvironment. We predict that in the future this imaging approach will be used routinely to provide a measure of the TAM content in newly diagnosed tumours and for monitoring TAM content during treatment and recovery.Acknowledgements
No acknowledgement found.References
1. Yang J, Li X, Liu X, Liu Y. The role of tumor-associated macrophages in breast carcinoma invasion and metastasis. Int J Clin Exp Pathol. 2015;8(6):6656-6664.
2. Mantovani, A. & Sica, A. Macrophages, innate immunity and cancer: balance, tolerance, and diversity. Curr. Opin. Immunol. 2010;22, 231–7.
Figures