3598
Molecular Imaging of the effects of monocyte chemoattractant protein-1 (MCP-1) on extracellular matrix remodeling following myocardial infarction1Division of Imaging Sciences and Biomedical Engineering, King's College London, London, United Kingdom, 2Cardiovascular Division, The British Heart Foundation Centre of Excellence, King's College London, London, United Kingdom, 3Heinrich Heine University Düsseldorf, Düsseldorf, Germany, 4Cardiovascular Division, James Black Centre, King's College London, London, United Kingdom
Synopsis
After a myocardial infarction (MI) the degree of inflammation and its timely resolution, together with the degradation and deposition of extracellular matrix proteins are key processes in post-MI healing. Monocyte chemoattractant protein-1 (MCP1) plays an important role in the recruitment of monocytes/macrophages and its absence has revealed a significant reduction of inflammatory cell recruitment and subsequent ECM protein production in the infarcted area. Here, we explored the merits of multinuclear 1H/19F MRI for the simultaneous assessment of myocardial inflammation and remodelling in a murine model of MI. 19F containing nanoparticle that is avidly taken up by macrophages was used to investigate inflammatory cell recruitment into injured myocardium2, and a small molecular weight gadolinium-based elastin-specific MR contrast agent was used to evaluate changes of elastin content post-MI3.
Purpose
Dysfunctional ventricular remodeling and subsequent chronic heart failure is a major healthcare problem worldwide. After myocardial infarction (MI) a series of biological processes occur, starting from the recruitment of inflammatory cells, followed by the formation of granulation tissue and the deposition of extracellular matrix (ECM). The temporal resolution in which these processes occur have an important impact on the outcome of the healing of the myocardium. Previous studies suggested that monocyte chemoattractant protein-1 (MCP-1) that acts on the recruitment of inflammatory monocytes, might play an important role in the resolution of MI healing1. MCP-1 deficient mice have shown a delay in the recruitment of macrophages into the healing infarct and in the replacement of injured myocytes by granulation tissue, leading to an attenuation in post-infarcted left-ventricular (LV) remodeling. Different therapeutical approaches have been used in order to limit ventricular remodeling by promoting the expression of ECM proteins, including collagen, resulting in a fortification of the wall. Understanding the importance of MCP-1 protein in myocardial healing and scar formation could contribute to the development of new therapeutic approaches. In this study, 19F perfluorocarbons (PFCs) were used to assess inflammatory cell recruitment2 and a gadolinium-based elastin-specific MR contrast agent (Gd-ESMA) was used to analyse the deposition of elastin post-MI3.Methods
MI was induced in 32 female wild-type (WT) C57BL/6J and MCP-1 knockout (MCP1-/-) mice by permanent ligation of the left anterior descending coronary artery. In vivo MRI was performed at 3,7,14 and 21 days after surgery using a 3T-MR scanner (Achieva,Philips,NL). Animals were placed in prone position on a 19F/1H surface coil (diameter=33mm and 23mm). Anaesthesia was maintained with 1-2% isoflurane in oxygen, and body temperature was maintained using a water-based heating system and a rectal temperature feedback probe. ECG was monitored with two metallic needles placed subcutaneously into the front paws. 1H and 19F cardiac ECG-triggered images were acquired after intravenous injection of 0.5mmol/kg of Gd-ESMA and 400µL of 19F-PFCs, 1 and 48h before the scan, respectively. Following 3D-GRE scout scan, 2D-cine images were acquired in short-axis covering the whole LV. 80-100min after Gd-ESMA injection, a 2D-Look-Locker sequence was used to identify the optimal inversion time(TI) to null healthy myocardium. 3D late-gadolinium-enhancement(LGE) images were acquired in short-axis for visualization of contrast uptake with the following parameters: FOV=35x35x12mm,in-plane resolution=0.3x0.3x1mm,slices=12,TR/TE=6.4/2.6ms,5 heart beats between subsequent IR pulses, and flip angle=25°. A 3D-GRE sequence preceded by a non-selective inversion pulse was used for T1-mapping The inversion pulse was followed by eight segmented readouts, each spaced one RR-interval apart, for eight individual images resulting in TI’s ranging from 10ms-2000ms. To allow full magnetization recovery, 12 pause heart beats were performed before the next inversion pulse. Acquisition parameters included: FOV=35x35x1.5mm, in-plane resolution=0.3x0.3mm,slices=1,TR/TE=7.5/3.1ms, flip angle=25°. 3D turbo-spin echo 19F scans were acquired with a FOV=35x35x12mm, in plane resolution=1x1x2mm,slices=12,TR/TE=4 beats/8.9ms,TSE factor=5,offset frequency=10200Hz(BW=6103Hz). A saturation slice was used to suppress liver signal. To enable SNR calculation, a noise-scan was acquired with the same imaging parameters but without any RF pulses. Histology. Immunohistochemistry(IHC) was performed to quantify tropoelastin (non-crosslinked elastin) and macrophage content.Results and Discussion
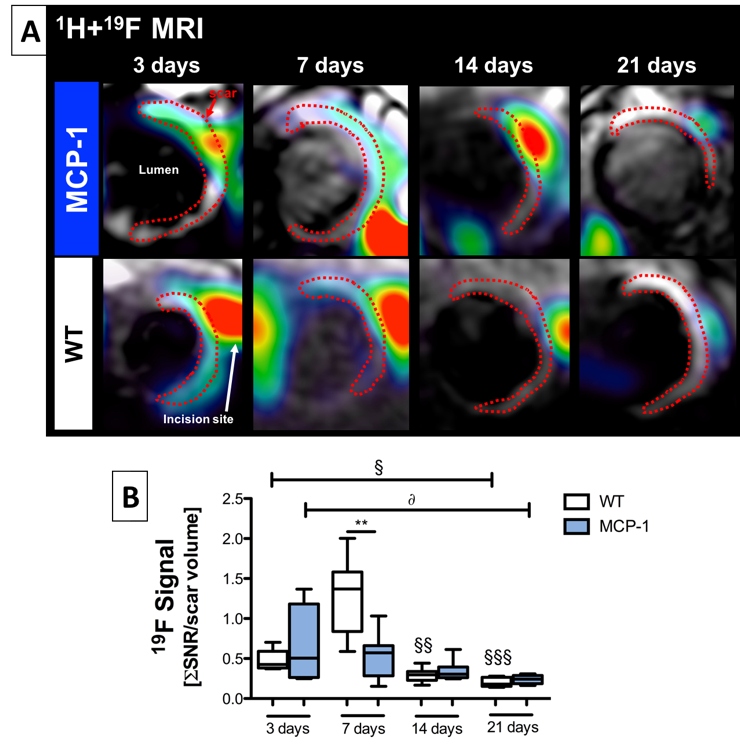
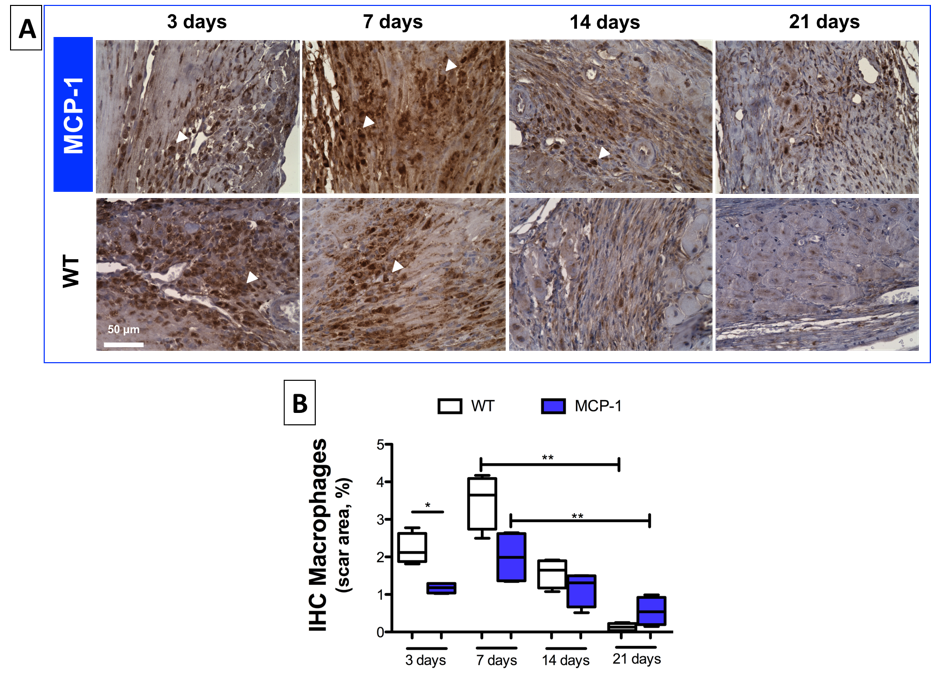
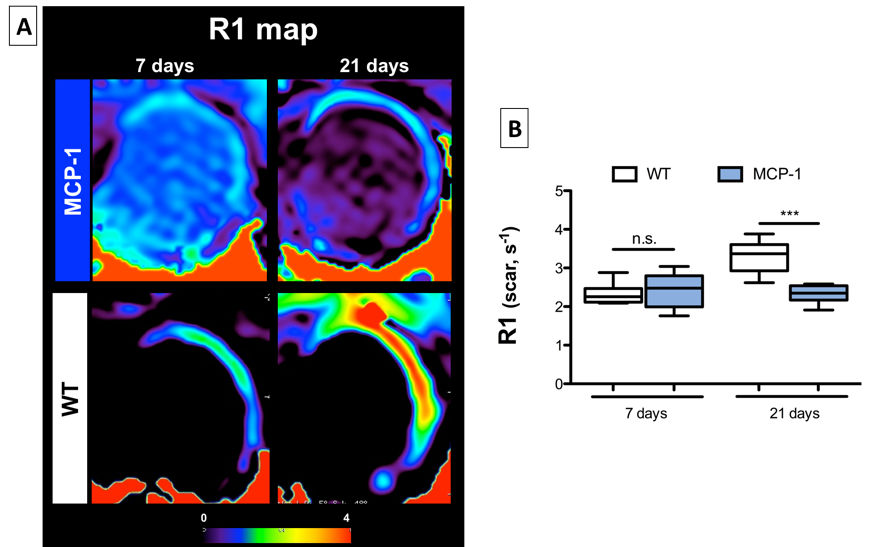
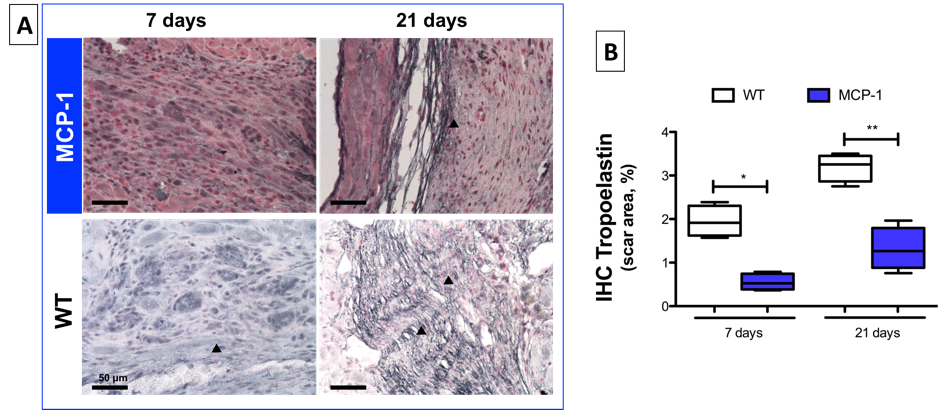
1H and 19F images are shown in Figure 1A. Simultaneous acquisition of morphologically matching 1H and 19F images enabled the anatomical localization of PFCs after intravenous injection. In WT animals inflammation peak is usually observed at 7 days post-MI. In comparison, a significantly lower 19F signal was detected within the infarcted area at 7 days post-MI in MCP-1 compared to WT animals suggesting a less recruitment of inflammatory cells (Fig.1B) at this time point. However, inflammation persisted longer in the MCP-1 animals compared to WT at 14 and 21 days post-MI. This observation was confirmed histologically using macrophage-specific staining (Fig.2). R1 maps acquired after the administration of Gd-ESMA post-MI are shown in Figure 3. WT animals showed a significant increase in R1 between 7 and 21 days post MI (P<0.001) compared to MCP-1 animals. At day 21 post-MI, we observed significantly lower R1 values in MCP-1 compared to WT mice suggesting reduced elastin remodeling in this strain (Fig.2B). Similarly, tropoelastin IHC showed a significantly lower tropoelastin deposition in the infarcted myocardium of MCP-1 compared to WT mice (Fig.4).Conclusions
We demonstrate the feasibility of simultaneous assessment of inflammation and remodeling in a mouse model of MI using 19F-PFCs and Gd-ESMA and a 1H/19F dual coil at 3T. Our results show that MCP1-/- mice have a prolonged but weaker inflammatory phase and lower tropoelastin production within the healing myocardium compared to WT mice. Future studies are now warranted to investigate the effects of these differences on cardiac function.Acknowledgements
This work was supported by a (1) British Heart Foundation PhD fellowship at King’s College London, and (2) a British Heart Foundation Program grant (RG/12/1/29262).References
1. Dewald, O., et al., CCL2/Monocyte Chemoattractant Protein-1 regulates inflammatory responses critical to healing myocardial infarcts. Circ Res, 2005. 96(8): p. 881-9.
2. Flogel U, et al. In Vivo Monitoring of Inflammation After Cardiac and Cerebral Ischemia by Fluorine Magnetic Resonance Imaging. Circulation, 2008;118(2):140-148.
3. Wildgruber M, et al. Assessment of Myocardial Infarction and Postinfarction Scar Remodeling With an Elastin-Specific Magnetic Resonance Agent. Circ Cardiovasc Imaging, 2014;7:321-329.
Figures