3596
Aortic endothelial injury modifies plaque composition at a distally located site through increased monocyte extravasation1Imaging Sciences and Biomedical Engineering, King's College London, London, United Kingdom, 2Radiology Department, Universidad Catolica de Chile, Santiago de Chile, Chile
Synopsis
The deleterious impact of atherosclerosis on other cardiovascular diseases has recently been shown, but the
effect of vascular alterations on plaque formation at a distal site, including
the underlying mechanisms of this
systemic response, has not been elucidated. In this study, we used an albumin-binding contrast agent
to assess whether (1) endothelial injury in the abdominal aorta accelerates
plaque progression in the brachiocephalic artery located distally to the site
of injury and (2) whether monocytes can be the link between acute and systemic
response.
Introduction
The effect of atherosclerosis on other cardiovascular diseases has been extensively studied. However, the impact of other diseases on plaque progression, such as focal endothelial injury, has not yet been clarified. Vascular permeability regulates monocyte infiltration within the vessel wall, and monocytes were found to have important effects on plaque progression, composition and stability1,2. We and others have shown that contrast enhanced MRI using gadofosveset can provide information on vascular permeability in different animal models3-6. Here, we use gadofosveset to assess whether (1) aortic injury induces compositional changes in plaques located distally to the site of injury and (2) whether monocytes could be the link between focal injury and distal plaque progression.Methods
Three groups of male ApoE-/- mice were imaged at 12 weeks after commencement of the experimental protocol. (1) Mice were fed a high fat diet (HFD) to induce atherosclerosis (n=6); (2) Mice underwent endothelial denudation surgery3 followed by HFD (n=9); (3) Mice underwent vascular injury followed by HFD and pravastatin treatment (40mg/kg/day) (n=6). Control mice were imaged before HFD±injury (n=6). In-vivo MRI: A 3T Philips Achieva MR scanner equipped with a 47mm (Aorta) and a 23mm (BCA) single-loop microscopy surface coil were used. Images were acquired after intravenous administration of Gadofosveset (0.03mmol/kg). Following a 3D-GRE scout scan, time-of-flight (TOF) images were acquired for visualization of the arterial tree with a FOV=35x35x16mm, matrix=233x233, in-plane resolution=0.15x0.15x0.5mm, TR/TE=28/6ms and flip angle=40°. Maximum intensity projection images were used to plan the subsequent delayed enhancement and T1 mapping scans. An inversion-recovery 3D fast-gradient echo sequence (DE-MRI) was acquired and used for visualization of contrast uptake. Imaging parameters were: FOV=35x35x12mm, matrix=348x348, in-plane resolution=0.1x0.1x1mm, TR/TE=27/8ms, TR between subsequent IR pulses=1000ms, and flip angle=30°. T1 mapping was performed using 3D Look-Locker sequence that employs two non-selective inversion pulses with inversion times ranging from 20ms to 2000ms, followed by eight segmented readouts for eight individual images. The two imaging trains result in a set of 16 images per slice with increasing inversion times. The acquisition parameters were: FOV=36x22x10mm, matrix=180x102, in-plane resolution=0.2x0.2x0.5mm, TR/TE=9/4.6ms, flip angle=10°. T1 values were computed on a pixel-by-pixel basis using an in-house software (Matlab, Natick, MA).Results
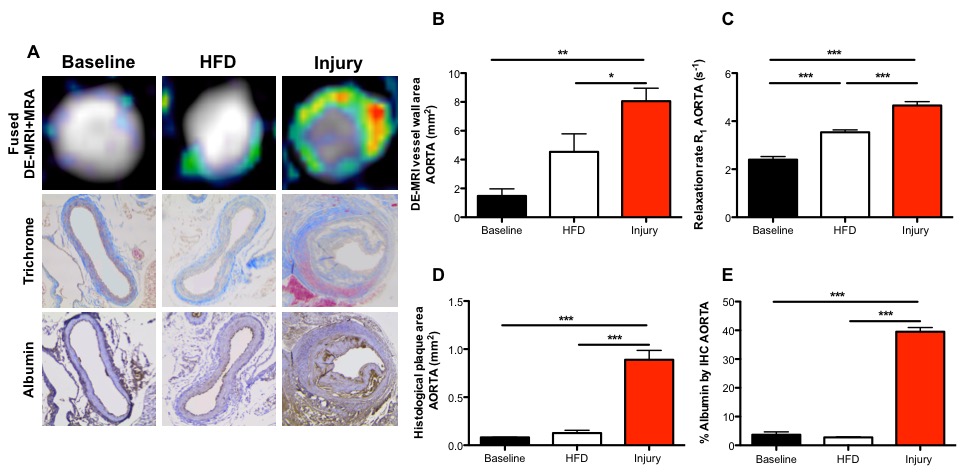
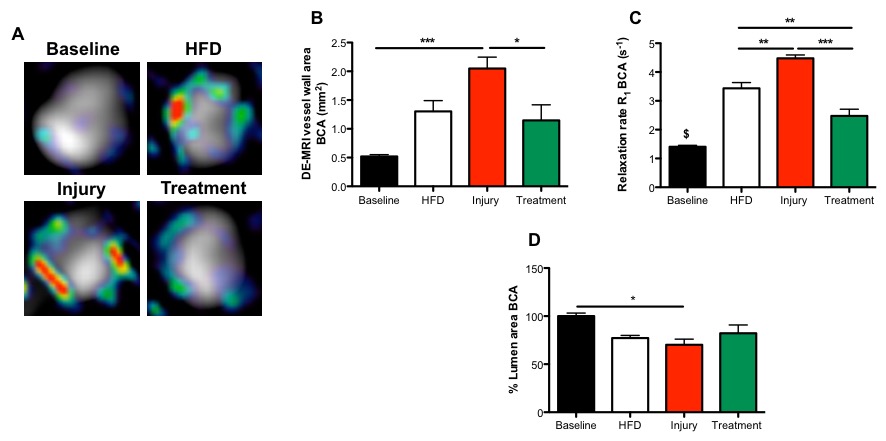
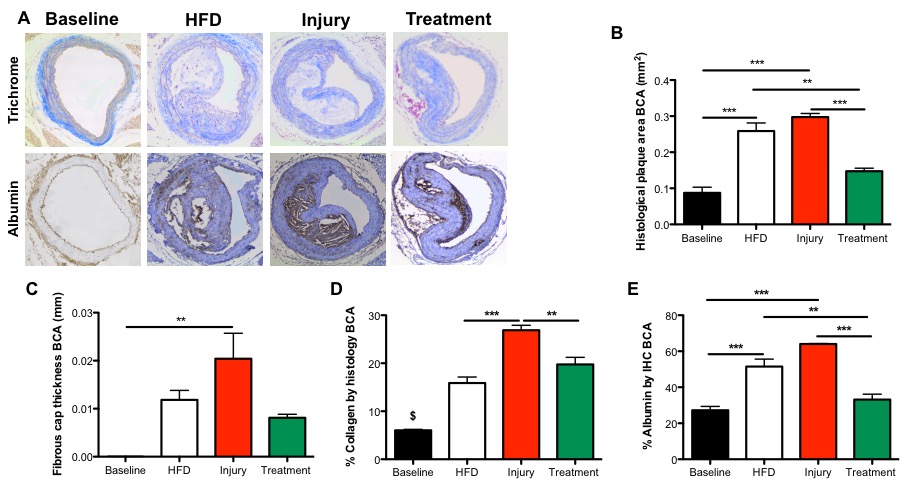
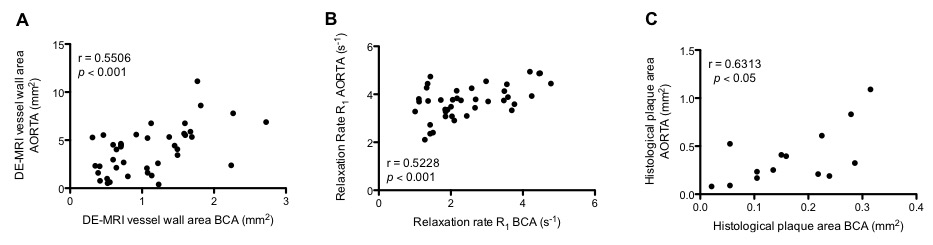
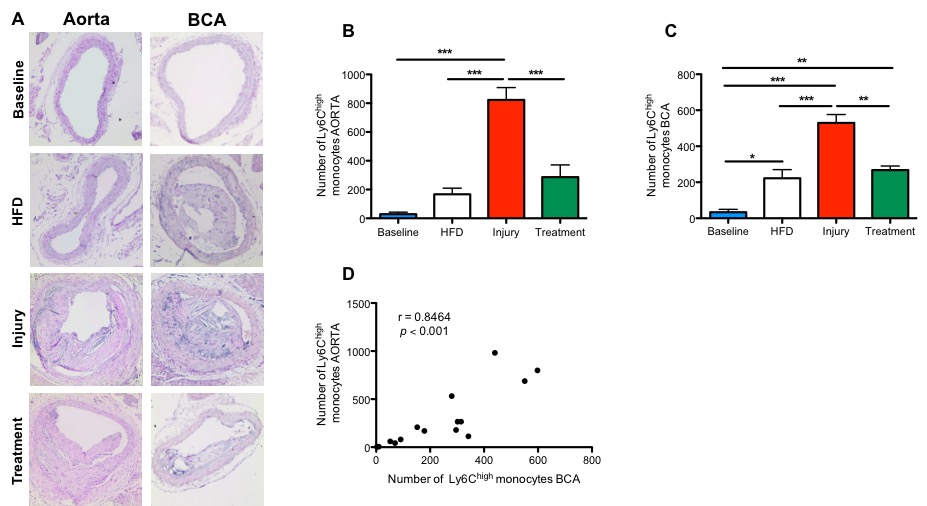
Gadofosveset uptake and corresponding histological images of the aorta are represented in figure 1A. Increased contrast uptake area (Fig 1B) and aortic vessel wall relaxation rate (R1) (Fig 1C) were detected in the injury group compared to other groups, which was in agreement with plaque formation (Fig 1D) and increased albumin leakage (Fig 1E) in the injury group, as shown by histology (Fig. 1A). To investigate the systemic effect of vascular injury on atherosclerosis in a distal location, we evaluated plaque formation in the brachiocephalic artery (BCA). Gadofosveset uptake images are shown in figure 2A. Higher enhancement of Gadofosveset was detected in the BCA 12wks after injury (Fig 2B). Increased relaxation rate was detected in the injury group compared to other groups (Fig 2C). Significant decrease of the luminal area was detected in the injury group (Fig 2D). Importantly, injured mice treated with statins showed decrease Gadofosveset uptake, demonstrating their beneficial effect on plaque progression (Fig 2B-2C). Histological images are shown in figure 3A. Histological analysis revealed similar plaque area between injury and HFD groups, which corroborate the DE-MRI measurements (Fig 3B). However, plaque composition revealed a surprisingly thick fibrous cap and increased collagen deposition in the BCA of injured mice compared with the HFD group (Fig 3C-3D). Increased albumin leakage was detected in the injury group compared to other groups (Fig 3E). Importantly, smaller and less complex plaques were detected in the treatment group, corroborating the MRI findings (Fig 3A-3E). In addition, positive correlations were detected between DE-MRI (Fig 4A), R1 (Fig 4B) and plaque area (Fig 4C) between the aorta and the BCA, suggesting a systemic link between the injury in the aorta and plaque formation in the BCA. To better understand this possible systemic link, monocyte/macrophage staining (Fig 5A) and flow cytometry analysis (Fig 5B-5C) were performed, revealing a higher extravasation of Ly6Chigh (inflammatory) monocytes in the injured mice, in both vascular segments, compared to other groups. Finally, positive correlation between Ly6Chigh monocytes was revealed between the aorta and the BCA, suggesting monocytes as the possible systemic link between focal injury and distal plaque progression.Conclusions
We demonstrate the deleterious systemic effect of vascular injury on plaque progression distally and whether imaging with Gadofosveset can be used to quantify these changes in vivo. We also demonstrate that monocytes may be the possible link between focal and distal disease progression.Acknowledgements
No acknowledgement found.References
1. Tabas I, Bornfeldt KE. Macrophage Phenotype and Function in Different Stages of Atherosclerosis. 2016. Circulation Research. 2016;118:653-667.
2. Phinikaridou A, Andia ME, Protti A, Indermuehle A, Shah A, Smith A, Warley A, Botnar RM. Noninvasive magnetic resonance imaging evaluation of endothelial permeability in murine atherosclerosis using an albumin-binding contrast agent. 2012. Circulation. 126(6):707-19.
3. Lavin B, Phinikaridou A, Lorrio S, Zaragoza C, Botnar RM. Monitoring vascular permeability and remodeling after endothelial injury in a murine model using a magnetic resonance albumin-binding contrast agent. 2015. Circ Cardiovasc Imaging. 8(4). pii: e002417.
4. Lobbes MB1, Miserus RJ, Heeneman S, Passos VL, Mutsaers PH, Debernardi N, Misselwitz B, Post M, Daemen MJ, van Engelshoven JM, Leiner T, Kooi ME. Atherosclerosis: contrast-enhanced MR imaging of vessel wall in rabbit model--comparison of gadofosveset and gadopentetate dimeglumine. 2000. Radiology. 250(3):682-91.
5. Pedersen SF1, Thrysøe SA, Paaske WP, Thim T, Falk E, Ringgaard S, Kim WY. CMR assessment of endothelial damage and angiogenesis in porcine coronary arteries using gadofosveset. 2011. J Cardiovasc Magn Reson. 13:10.
Figures