3593
Chicken Embryo: An Excellent Platform for Monitoring Zika Virus Induced Microcephaly and Tracking Stem Cells1Bioimaging research Center, University of Georgia, Athens, GA, United States, 2Regenerative Bioscience Center, University of Georgia, Athens, GA, United States, 3Department of Infectious Diseases, University of Georgia, Athens, GA, United States
Synopsis
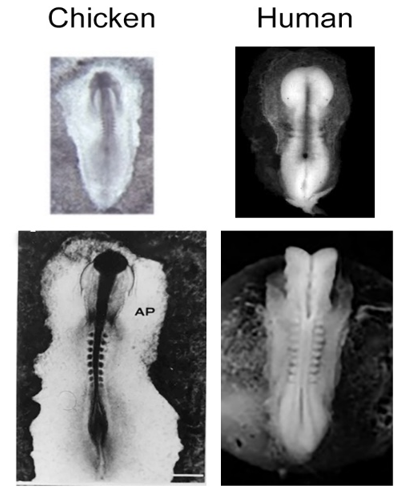
A chicken embryo is the developmental biology’s oldest model organism. In ovo development of the chicken embryo closely mirrors human embryo development. The relatively large size, ease of access, and lack of maternal motion generated in pregnant mammals are distinct advantages the chicken embryo model provides. The chicken embryo provides an excellent platform for monitoring morphology and metabolism of central neural system (CNS) by using MRI or NMR spectroscopy over the course of development. In this presentation our recent work on monitoring Zika virus induced microcephaly and tracking stem cells are presented.
Purpose
To demonstrate that a chicken embryo provides an inexpensive and easy of access platform for in vivo monitoring of Zika virus (ZIKV) induced microcephaly and longitudinal tracking of stem cells labeled with superparamagnetic iron oxide (SPIO) nanoparticles.Outline of Content
A chicken embryo is the developmental biology’s oldest model organism. The accessibility of the chick embryo has made it a characterized model with development divided into 35 distinct stages based upon structural and histological difference.[ref1] In ovo development of the chicken embryo closely mirrors human embryo development. Both are characteristically linear and two-dimensional in shape (Fig.1). In addition, the relatively large size, ease of access, and lack of maternal motion generated in pregnant mammals are distinct advantages this model provides. The chicken embryo provides an excellent platform for monitoring morphology and metabolism of central neural system (CNS) by using MRI or NMR spectroscopy over the course of development. ref[2-7]
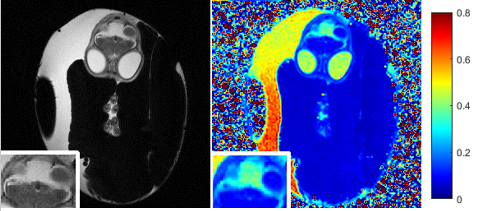
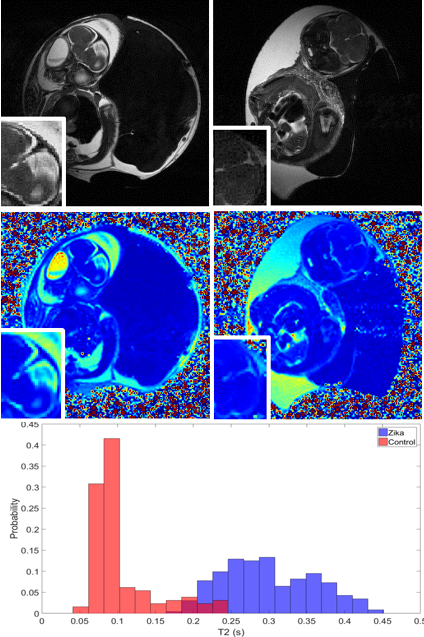
This presentation consists of two parts. The first part presents our recent work on monitoring ZIKV induced microcephaley. Embryonated broiler eggs were set in a standard egg incubator and inoculated on either embryonic day E2.5 or embryonic day E5. Virus was injected through the amniotic membrane using a glass capillary tube drawn into a needle. Two microliters of Dulbecco's Modified Eagle Medium containing viral particles were administered within the inner membrane space with the Picospritzer III. Chicken embryos were scanned with 7 T MRI at E15 and E20 of chick embryo development. ZIKV-infected embryos did not show obvious brain damage at D15 (Fig.2) but displayed gross defects on anatomical T2-weighted MR images at E20 (Fig.3). Hyperintensity or bright contrast shown in the inset box of ZIKV-infected chick embryos indicates higher content of fluid in the malformed brain area. MR relaxation time T1 and T2 maps had been used to longitudinally monitor developmental study of chick embryos, and the T2 maps specifically provided insights into developing pathology changes.ref.[8] The T2 values of comparable brain regions of ZIKV-infected embryos increased. A distribution of T2 values of ZIKV-infected brain area reveals a shift towards the higher end (Fig.3).
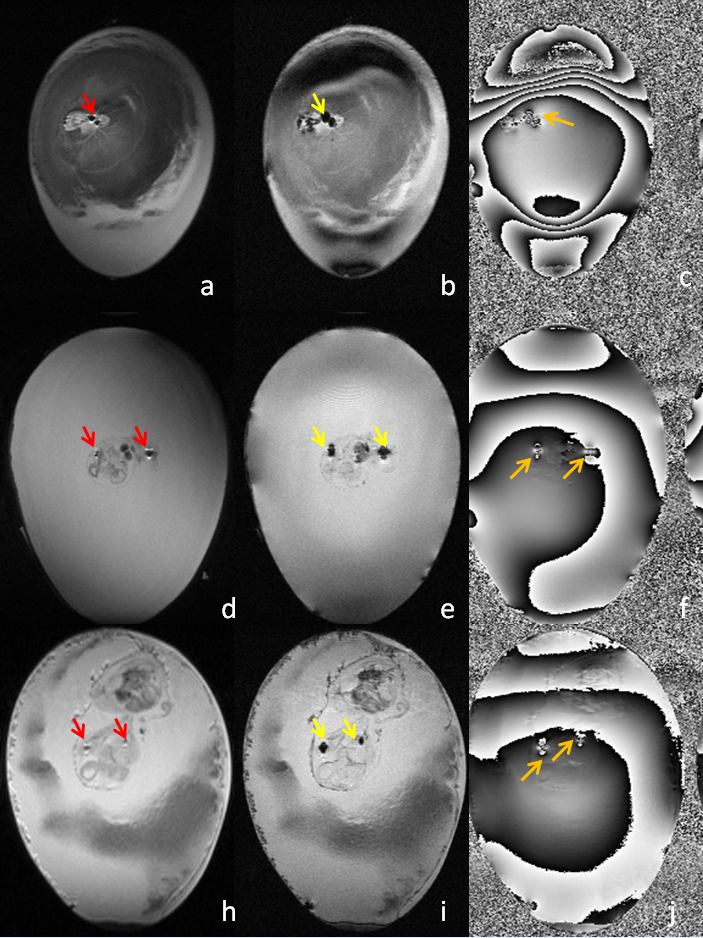
The second part presents longitudinal tracking
of human
neural progenitor (hNP). GFP
expressing (GFP+) hNP cells were labeled with 20 mg/mL Molday-Ion-Rhodamine-B
(MIRB) SPIO nanoparticles for 48 hours. To investigate sensitivity of MIRB+ GFP+
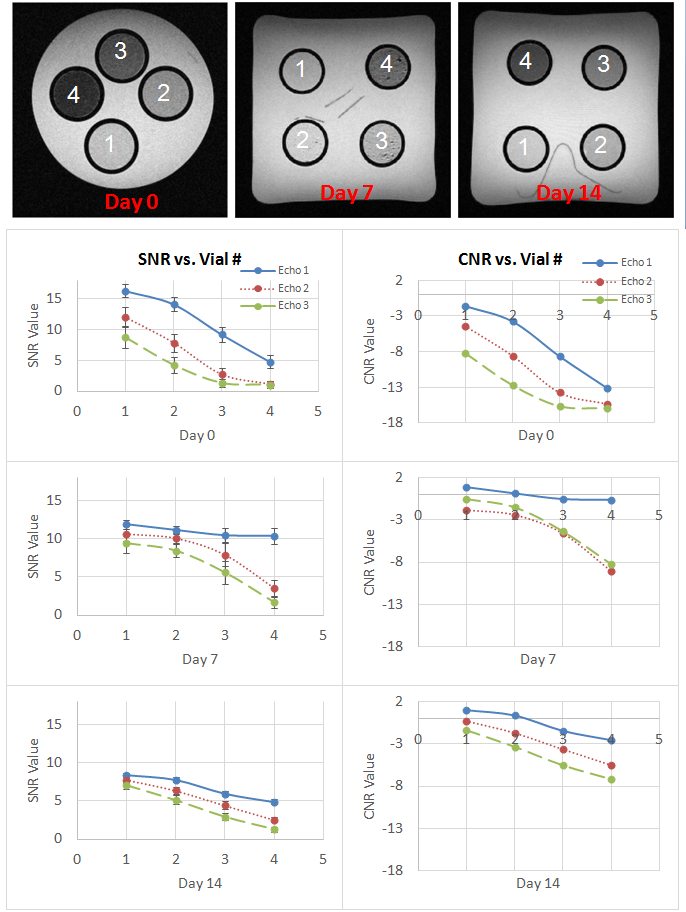
hNP cell tracking in vitro, an MR study was carried out on three phantoms
embedded with 4 vials of different concentrations of labeled cells. The cells
were collected on day 0, day 7, and day 14. Following cell phantom experiments,
approximate 2 x 10^5 MIRB+ GFP+ hNP cells were
transplanted into the Hmburger-Hamilton stage 15 chicken embryos. Cell tracking
was conducted at E3, E6, and E10 of chicken development. All MRI experiments were carried out on a 7 T
Varian Magnex scanner.
For
the phantom experiment, signal-to-noise ratio (SNR) and contrast-to-noise ratio
(CNR) were calculated as a function of # of cells labeled, MR echo times, and
tracking days (Fig.4). The labeled
hNP cells were tracked up to 14 days post labeling. We determined that the contrast
generated by the MIRB+ GFP+ hNP cells follows the expected
signal intensities across multiple echoes and different concentrations of the
cells. For the in vivo cell tracking, Fig.5 shows that T2- and
T2*-weighted anatomy image acquired on Day 3 clearly showed
hypointense regions indicating presence of SPIO nanoparticles. T2-weighted
and T2*-weighted anatomical images acquired on Day 3, 6
and 10 are presented, together with T2*-weighted phase
images. SPIO nanoparticles carried by labeled cells exhibited strong magnetic
dipole effects (like flowering artifact), shown in both anatomical and phase
images.
Summary
We demonstrated for the first time that the chick embryo offers an alternative and complimentary animal model for studying ZIKV pathogenesis.ref.[9] The chick embryo model facilitated longitudinal MRI observations. MRI observation could provide insight into the timing and anatomy of brain malformations. The chicken embryo demonstrated progressive changes in ZIKV-induced brain region volume across all cortical regions except the cerebellum. T2-weighted MR images demonstrate brain damage in the developing chick CNS. Higher T2 values suggest more fluid in the ZIKV infected brain area, which was consistent to the hyperintensity contrast in the same area of anatomical images. Regarding the cell tracking, successful tracking of transplanted MIRB+ GFP+ hNP cells demonstrates that stem cells can be tracked with clear anatomical resolution. Accurate quantification of SPIO labeled cells remains a challenge and deserves further investigation.Acknowledgements
This work was supported in part by US Environmental Protection Agency STAR grant (83555101) and grant S10RR023706 from the National Center for Research Resources.References
1. Hamburger, V.; Hamilton, H. L., A series of normal stages in the development of the chick embryo. 1951. Developmental dynamics : an official publication of the American Association of Anatomists 1992, 195, 231-72.
2. Bain, M. M., Fagan, A. J.; Mullin, J. M.; McNaught, I.; McLean, J.; Condon, B., Noninvasive monitoring of chick development in ovo using a 7T MRI system from day 12 of incubation through to hatching. J Magn Reson Imaging 2007, 26, 198-201.
3. Goodfellow, F. T.; Simchick, G. A.; Mortensen, L. J.; Stice, S. L.; Zhao, Q., Tracking and Quantification of Magnetically Labeled Stem Cells Using Magnetic Resonance Imaging. Advanced Functional Materials 2016, 3899-3915.
4. Bain, M. M.; Fagan, A. J.; Mullin, J. M.; McNaught, I.; McLean, J.; Condon, B., Noninvasive monitoring of chick development in ovo using a 7 T MRI system from day 12 of incubation through to hatching. J Magn Reson Imaging 2007, 26.
5. Zhou, Z.; Chen, Z.; Shan, J.; Ma, W.; Li, L.; Zu, J.; Xu, J., Monitoring brain development of chick embryos in vivo using 3.0 T MRI: subdivision volume change and preliminary structural quantification using DTI. BMC Developmental Biology 2015, 15, 1-10.
6. Feng, Y.; Zhu, H.; Zhang, X.; Wang, X.; Xu, F.; Tang, H.; Ye, C.; Liu, M., NMR Based Cerebrum Metabonomic Analysis Reveals Simultaneous Interconnected Changes during Chick Embryo Incubation. PLoS One 2015, 10, e0139948.
7. Coen, M.; Wevers, R. A.; Lindon, J. C.; Blom, H. J., High-resolution 1H NMR spectroscopic investigation of a chick embryo model of neural tube development. Magnetic Resonance in Chemistry 2009, 47, S62-S67.
8. Boss, A.; Oppitz, M.; Wehrl, H. F.; Rossi, C.; Feuerstein, M.; Claussen, C. D.; Drews, U.; Pichler, B. J.; Schick, F., Measurement of T1, T2, and magnetization transfer properties during embryonic development at 7 Tesla using the chicken model. Journal of magnetic resonance imaging : JMRI 2008, 28, 1510-4.
9. Goodfellow, F., Tesla, B., Simchick, G., Zhao, Q., Hodge, T., Brindley, M., Stice, S., Zika Virus Induced Mortality and Microcephaly in Chicken Embryos. Stem Cells and Development 2016, 25, 1691-1697.
Figures