3592
The verification of the T2 distributed relaxation model (DRM) for a polydisperse nanoparticle system1Physics, UAE University, Al-Ain, United Arab Emirates
Synopsis
Theories describing T2 enhancement due to the presence of superparamagnetic particles agree well with experimental and Monte Carlo simulation data under the condition that the particles are monodisperse both in size and magnetization. We present a T2 distributed model that takes into account the particle size and magnetization distributions. The results shown confirm the ability of the distributed relaxation model to correctly predict T2 values for a mixed MAR and SDR sample of MNP under a wide range of values of size, magnetization, volume fraction, etc. The new model will reduce the error in calculating T2 values using the mean size and mean magnetization values when a distribution of MNP exists.
Introduction
The briefly presented distributed relaxation model (DRM)1 describing T2 relaxation under the presence of a polydisperse magnetic nanoparticle (MNP) system is verified in this study under a wide range of MRI experimental conditions and nanoparticle physical characteristics. The analysis covers the important situation of mixed MAR and SDR regimes, never covered before in any study. We detail conditions under which the DRM produces accurate predictions of T2 values obtained from Monte Carlo (MC) simulations.Methods
The assumption upon which the DRM is based is the averaging of T2 values associated with individual MNP components or groups according to the size and magnetization of nanoparticles within each component. In this work, we use MC Simulation to calculate T2 values of systems of nanoparticles either fully in the MAR, or fully in SDR, or a mixture of both regimes simultaneously. We analyse the effect of many parameters such as the echo time TE, the diffusion coefficient D, the volume fraction f, the Larmor frequency at the surface of the MNP, $$$\omega_{r}$$$ (or equivalently magnetization M), etc. We compare the DRM predictions with MC simulations.Results
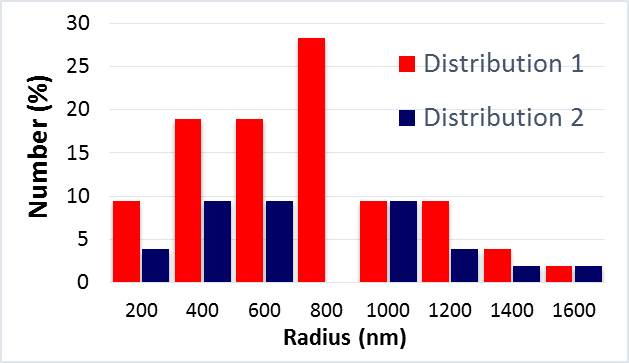
Among many combinations of particles’ size and magnetization values investigated, we show results for two size distributions that simultaneously encompass both regions of MAR and SDR on either side of R ≈ 800 nm (achieving the condition $$$\tau_{D} \omega_{r} ≈ 1$$$ - see Figure 1).
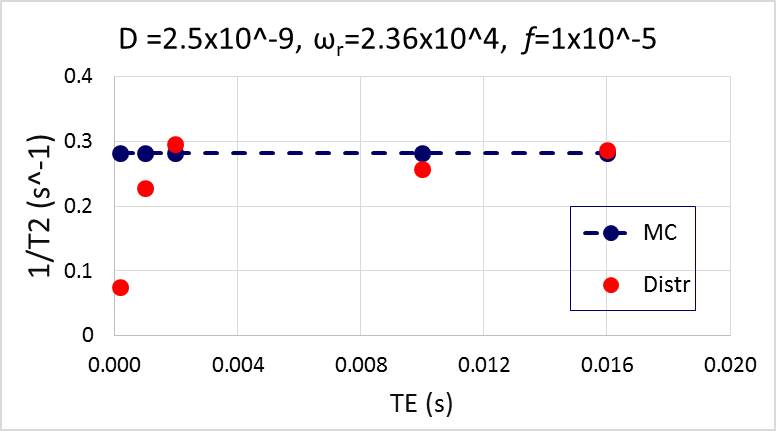
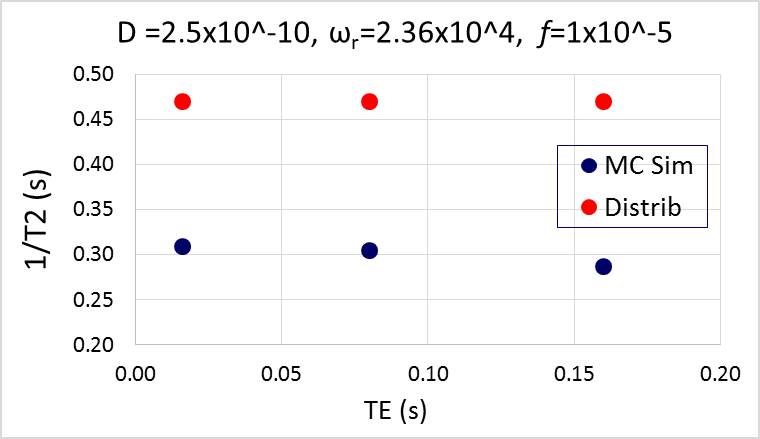
The effect of TE on the ability of the distributed model to correctly predict T2 values is shown in Figure 2 for particle distribution No. 2. The model approaches MC Simulation for larger TE when the spins have sufficient time to average the magnetic field gradients created by the MNPs. For this figure, D = 2.5 × 10⁻⁹ m2/s, the Larmor frequency is intermediate ωr=2.36 × 10⁴ rad/s, and the volume fraction is low f = 1.0 × 10⁻⁵. When D is reduced by a factor of 10, the DRM model fails to predict the T2 values even when TE is increased as shown in Figure 3. This is presumably because the spins' spatial averaging efficiency is reduced due to the smaller amplitudes of random walk steps Δh = (2DΔt)1/2.
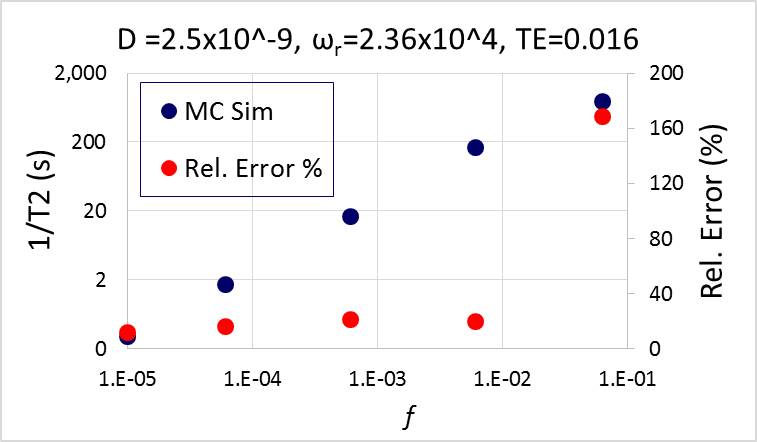
The effect of f is shown in Figure 4 where the percentage relative error remains < 20% for for particle distribution No. 1. Obviously, the model works well at very small f because the original T2 relaxation models2 were based on this assumption. However, the error increases to 170% at f = 0.063. The overlap of the magnetic field gradients is now too strong.
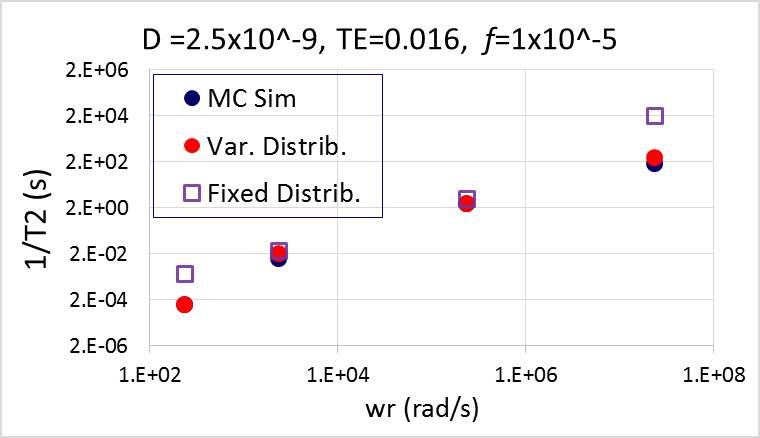
Figure 5 shows the excellent agreement of the DRM model with MC Simulation for very large range of the frequency (or equivalently magnetization M) for particle distribution No. 2. These results are for long TE values of 16 ms, D = 2.5 × 10⁻⁹ m2/s, and a low volume fraction f = 1.0 × 10⁻⁵. Two model-based calculations were made. The first assumed a fixed boundary between the two regimes at R ≈ 800 nm (Fixed Distribution in the Figure); and a second one which took the effect of the variation in ωr and therefore shifting the boundary between the two regimes accordingly (Variable Distribution). Therefore, for the largest two values of ωr all radii where within the SDR regime, while all radii where within the MAR regime for the smallest value of ωr. For ωr = 2.36 x 10^3 rad/s, four particles’ bins were within MAR and three were within SDR. Only the second method produced accurate predictions even at this very large range of magnetization.
Discussion and Conclusions
This work confirms the ability of the distributed relaxation model1 to correctly predict T2 values for a polydispersed sample of MNP. The limitation of the model is also investigated in terms of the range of values of TE, f, and D where the model breaks down. A large variety of combinations of both the size and magnetization of MNP has been tested (not all shown in this abstract) and excellent agreement between the model and MC simulation is obtained. In particular, relating to the issue of the efficiency of relaxation enhancement under different relative fractions within a bi-modal distribution of particles. The new model will reduce the error in predicting T2 values when using the mean size and mean magnetization values of the distribution of MNP as usually adopted. The results shown confirm validity of the model under a wide range of parameters.Acknowledgements
Emirates National Research Foundation (NRF-31S087) and UAE (UPAR-31S157).References
1. B. Issa. Distributed T2 relaxation model for polydisperse nanoparticle systems. Proceedings of the 24th ISMRM. 2015;2322.
2. A. Roch, R.N. Muller, P. Gillis, J. Chem. Phys. 10 (1999) 5403-5411.
Figures