3591
A novel application of quantitative sodium MRI for distinguishing lipedema from obesity1Radiology and Radiological Sciences, Vanderbilt University Medical Center, Nashville, TN, United States, 2Pharmacology and Physiology, Vanderbilt University, Nashville, TN, United States, 3Physical Medicine and Rehabilitation, Vanderbilt University Medical Center, Nashville, TN, United States, 4Vanderbilt Dayani Center for Health and Wellness, Nashville, TN, United States, 5Cardiovascular Medicine, Vanderbilt University Medical Center, Nashville, TN, United States, 6Neurology, Vanderbilt University Medical Center, Nashville, TN, United States, 7Psychiatry, Vanderbilt University Medical Center, Nashville, TN, United States, 8Physics and Astronomy, Vanderbilt University, Nashville, TN, United States
Synopsis
Sodium MRI is a molecular imaging tool that may be sensitive to the impact of lymphatic impairment on tissue homeostasis, yet has not been evaluated in a clinical population with a lymphatic disorder. Lipedema is a lymphatic fat-disorder that is under-recognized due to a need for further advanced MR imaging to diagnosis and assess treatment efficacy of the condition. Here, we apply quantitative 3T sodium imaging for the first time in a lipedema cohort to quantify tissue sodium levels and found elevated sodium concentration in the skin and muscle of patients with lipedema compared to BMI- and age-matched controls.
Purpose
The overall goal of this work is to develop and apply quantitative sodium MRI in extremity regions to interrogate different mechanisms of tissue sodium accumulation and clearance in patients with obesity versus adipose disorders such as lipedema1. Lipedema is a chronic condition involving excessive and disproportionate adipose tissue deposition in the lower extremities of females that does not regress in response to diet or exercise, and can be associated with pain and dilated lymphatic vessels2. Lipedema has been reported to affect 11% of post-pubertal females1 and the diagnosis is complicated because externally legs with lipedema can mimic obesity or lymphedema3. The etiology remains unknown.
The lack of imaging tools available with specificity for adipose metabolism and lymphatic function represents a significant unmet need for MRI development. Quantitative sodium imaging provides a measure of tissue sodium concentration, which may accumulate when the lymphatic system’s clearance function is impaired. This mechanism was suggested in an animal model of reduced lymphatic capillary density that led to marked skin sodium deposition4. Sodium represents a molecular biomarker that may provide specificity for the pathophysiology of lipedema when combined with conventional MR measures of tissue composition. We are evaluating a comprehensive MRI exam in subjects with lipedema and body-mass-index (BMI)-matched controls using novel sodium and proton MRI methodologies. The overreaching hypothesis is that tissue sodium concentration is uniquely elevated in patients with lipedema compared to BMI-matched controls, and therefore sodium MRI serves as a potential diagnostic tool.
Methods
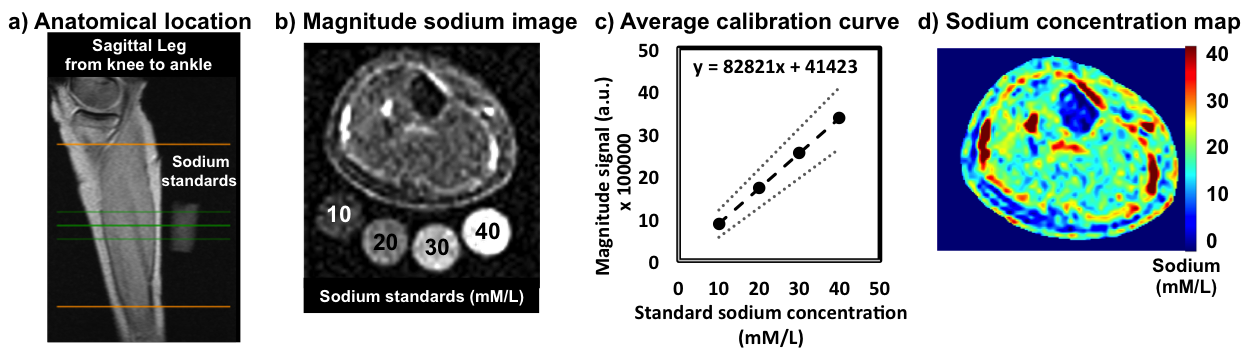
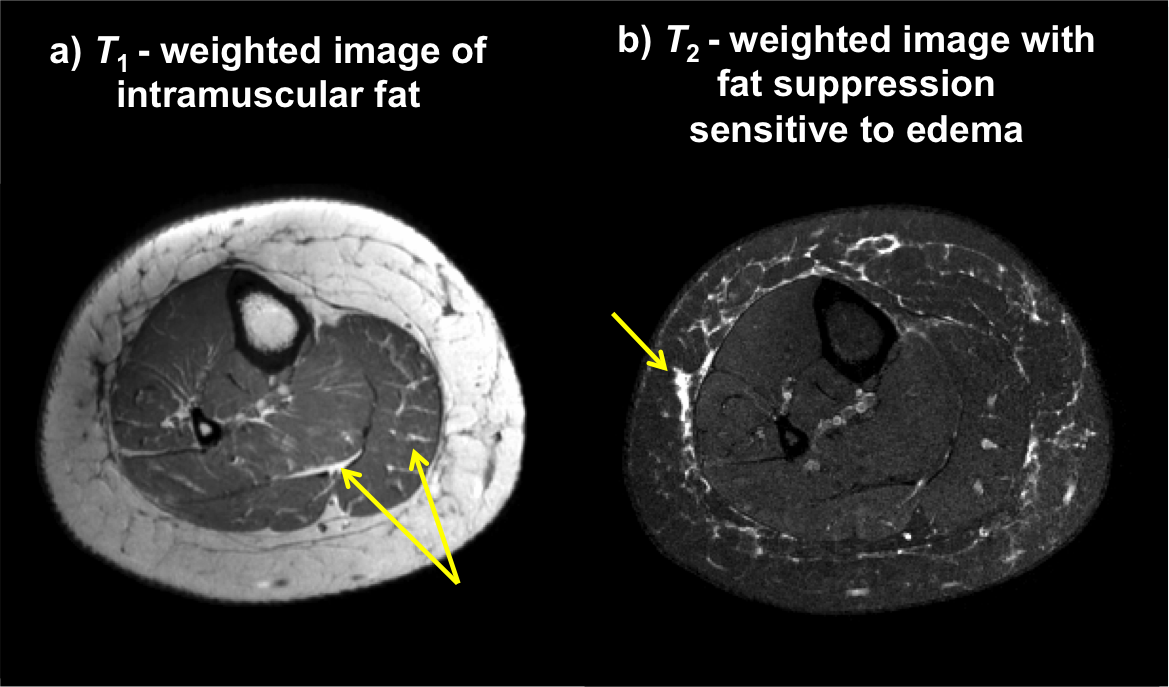
BMI and age-matched female controls (n=22; mean age=49.1 years, range=30–65 years; mean BMI=32.6 kg/m2, range=28.5–43.3 kg/m2) and lipedema (n=5; mean age=48.6 years, range=38–61 years; mean BMI=32.8 kg/m2, range=27.5–37.2 kg/m2) volunteers provided informed consent and were scanned at 3T (Philips Achieva) using the following multi-modal imaging protocol. Sodium imaging of the calf was implemented using a quadrature knee coil (Rapid Biomedical GmbH) based on a previously published clinical imaging protocol5 (3D gradient-echo, TR/TE = 130/0.99ms, FOV=192x192mm2, slice thickness=30mm). The protocol entails placement of four standard sodium solutions (aqueous NaCl in the physiologic range of tissue sodium concentration 10-40 mM/L) under the widest part of the calf (Figure 1a-b) to calibrate signal intensity to known sodium concentrations (Figure 1c). A quantitative sodium map is produced (Figure 1d). The skin layer and the total muscle were segmented from an anatomical reference image with identical geometry (mDixon, TR=200ms, TE1=1.15ms, TE2=2.30ms, identical FOV). The sodium map was interpolated to match the matrix size of the anatomical reference image. Structural proton imaging was acquired in succession using a 16-channel receive coil with acquisition parameters chosen for T1-weighted (TR/TE=1328/15ms) and T2-weighted (SPAIR fat suppression, TR/TE=4048/60ms) imaging at spatial resolution=0.5x0.5x5.5mm3 for evaluation of tissue composition of the lower leg from ankle to knee. Effect sizes (Cohen’s d) and two-sided Wilcoxon rank-sum (WRS) p-values were applied to compare study variables between groups.Results
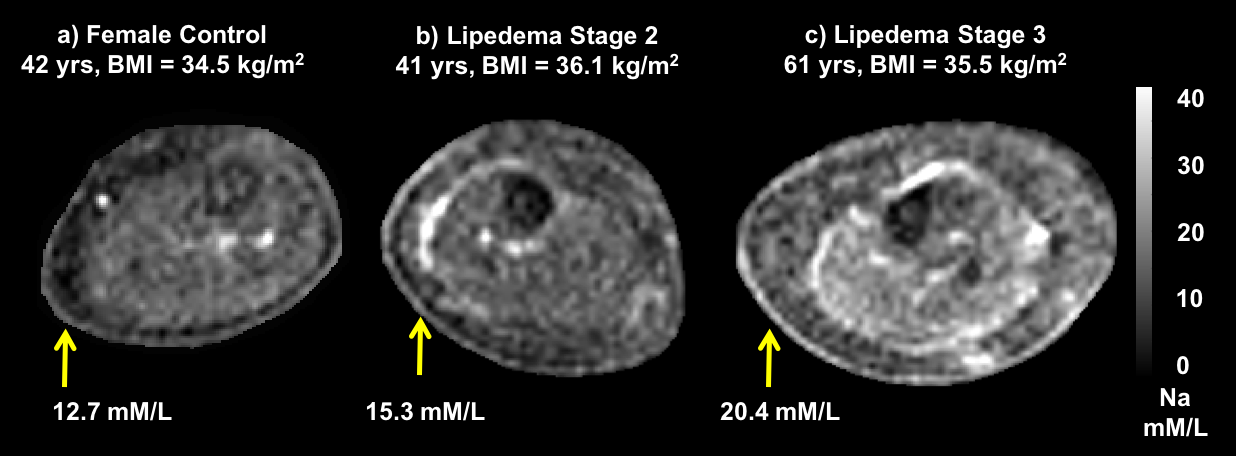
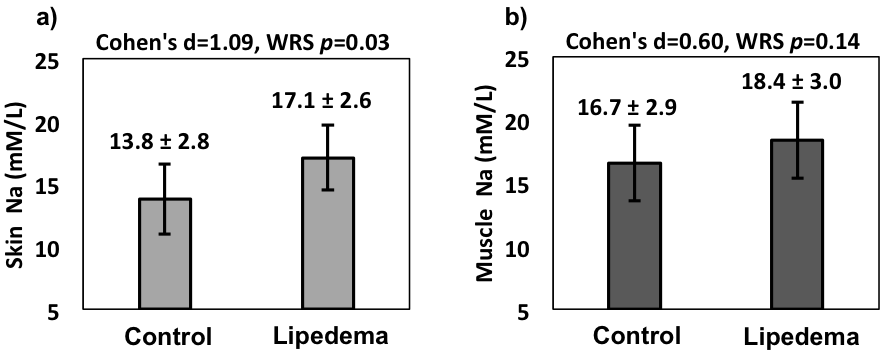
Image signal intensity in the sodium standards scaled linearly with the known sodium concentrations in all acquisitions (Figure 1c). Structural features in the legs of patients with lipedema include visible intramuscular fat and perimuscular edema, which are also common to obesity (Figure 2). However, sodium imaging revealed elevated tissue sodium levels in patients with lipedema compared to obese females (Figure 3). Elevated tissue sodium concentration between the two cohorts yielded a large effect size in the skin (Cohen’s d=1.09, percent difference = 24%, WRS p=0.03) and moderate effect size in muscle (Cohen’s d = 0.60, percent difference = 11%, WRS p=0.14, Figure 4).Discussion
There is currently no imaging method capable of distinguishing lipedema from obesity. We observed for the first time elevated skin sodium concentration in women with lipedema compared to BMI-matched control volunteers, consistent with impaired clearance of sodium through the lymphatics in these subjects. Additionally, elevated muscle sodium concentration suggests that lipedema is a metabolic disorder associated with myopathy. This novel clinical feature has not been characterized previously due to a lack of advanced imaging applications available to study diseases of lymphatic impairment.Conclusion
The findings of this study are consistent with the hypothesis that an underlying lymphatic impairment leads to reduced sodium clearance from tissue in patients with lipedema. This preliminary study provides evidence that tissue sodium concentration is a relevant marker of the pathophysiology of lipedema, and can be assessed using clinically applicable sodium MRI methodologies that may be useful for evaluating treatment responses and guiding palliative therapies.Acknowledgements
No acknowledgement found.References
1. Herbst KL. Rare adipose disorders (RADs) masquerading as obesity. Act Pharmacol. Sin. 2012;33:155-172.
2. Lohrmann C, Foeldi E, Langer M. MR imaging of the lymphatic system in patients with lipedema and lipo-lymphedema. Microvascular Research. 2009;77(3):335-339.
3. Forner-Cordero I, Szolnoky G, Forner-Cordero A, Kemény L. Lipedema: an overview of its clinical manifestations, diagnosis and treatment of the disproportional fatty deposition syndrome. Clinical Obesity. 2012;2(3-4):86-95.
4. Jeltsch M. et al. Hyperplasia of lymphatic vessels in VEGF-C transgenic mice. Science. 1997;276:1423–1425.
5. Kopp C, Linz P, Wachsmuth L, et al. (23)Na magnetic resonance imaging of tissue sodium. Hypertension. 2012;59(1):167-172.
Figures