3590
A Feedback System for Molecular Imaging of 19F FDG1Mirtech, Inc., Boston, MA, United States, 2Millikelvin Technologies, LLC, Braintree, MA, United States, 3Bruker BioSpin Corp., Billerica, MA, United States
Synopsis
A feedback system used in conjunction with a high concentration spin reservoir demonstrates an enhanced MRI signal from a molecular imaging target at low concentration. Enhanced images of a 10mM 19F FDG target obtained by a modified 3D Flash sequence are shown. Detectability curves reveal that for a 100ul voxel size, an imaging time of ~30 min is required to image 1mM 19F FDG with an SNR of 4.
Introduction
Superradiance an effect by which the transverse spin magnetization generates a signal-induced current in a coil which can then act back onto the spin system [1]. This can be viewed as a self-regulating flip-back pulse which may be used to return the spin system back to equilibrium more rapidly than that produced by T1 relaxation. Normally, this is only observed at high fields with high Q coils. A feedback system, which captures the transverse magnetization which is amplified and phase shifted, can generate a similar flip-back [2-4]. This technique has been demonstrated to enhance SNR for relatively high concentrations [2-4], but for a molecular target such as 19F FDG (Fluoro-Deoxy-Glucose), the concentration is too low for successful feedback. If an additional spin reservoir of a much higher concentration is placed inside the volume coil, referred to as the Superradiant Spin Resevoir (SSR), then the feedback system is enabled to generate the flip-back pulse for the molecular target.Methods
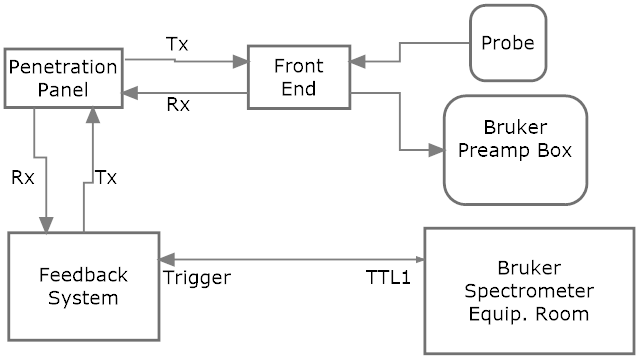
A broadband feedback system was constructed for use over a frequency range of 10-500MHz. The NMR signal is quadrature detected. A sample & hold and several rf switches are used to time multiplex the transmit and receiver signals. Phase shifting of the transmit signal was accomplished through vector modulation of one of the 120MHz IF signals. Figure 1 shows the layout of the hardware as employed with a Bruker 7T Biospec pre-clinical scanner. The coil assembly consists of a Bruker 72mm dual linear 1H/19F volume coil while the image was acquired with a figure-eight (2 1cm dia loops) receive-only 19F surface coil. A TTL signal from the scanner triggers the feedback window. The Front End contains a swappable TR switch and preamp, dependent upon the nucleus, and is responsible for switching between the Bruker and feedback system. A 20 watt amplifier (MiniCircuits ZHL-20W-13SW) allows the feedback time to be as short as 1 msec. The time multiplexing, digital control, and phase shifting is controlled by a National Instruments 6259 DAQ card. A computer with LabVIEW software is used to control the DAQ and PTS synthesizer.
A modified 3D Flash sequence was employed. The imaging signal is collected as a gradient echo with the surface coil. The feedback signal is generated by a spin echo with a 180° pulse applied shortly after the gradient echo. A second 180° was then immediately applied after feedback. The feedback process uses the volume coil. All gradients were balanced by the feedback time.
The target consisted of a sphere containing 1ml of 10mM FDG embedded in a block of an Agar gel. As the target concentration is too small for a real time detectable signal, another phantom (SSR) of 50ml of 1.5M 19F FDG was placed near the target. It is a significant challenge to acquire an image of a low concentration target (10mM) in the presences of the 1.5M SSR. A greater than 150x suppression was achieved by a combination of a variety of methods: 1.) use of a surface coil for spatial localization, 2.) utilizing a figure-eight configuration for the surface coil to minimize coupling between the volume coil and surface coil, 3.) rotation of the figure-eight surface coil wrt volume coil, to further minimize coupling, 4.) placing the SSR and target aligned along the read direction (z) so that the receiver bandwidth attenuates the SSR. The Bruker field mapping sequence was used to shim the sample based upon the 1H signal. Typically, this still leaves the target at a different frequency than the SSR as measured by a PRESS sequence. To align both samples to the same frequency, the linear z-shim is then adjusted to get both peaks to overlap as measured by PRESS. The increase in linewidth incurred by this adjustment was usually small.
Results and Discussion
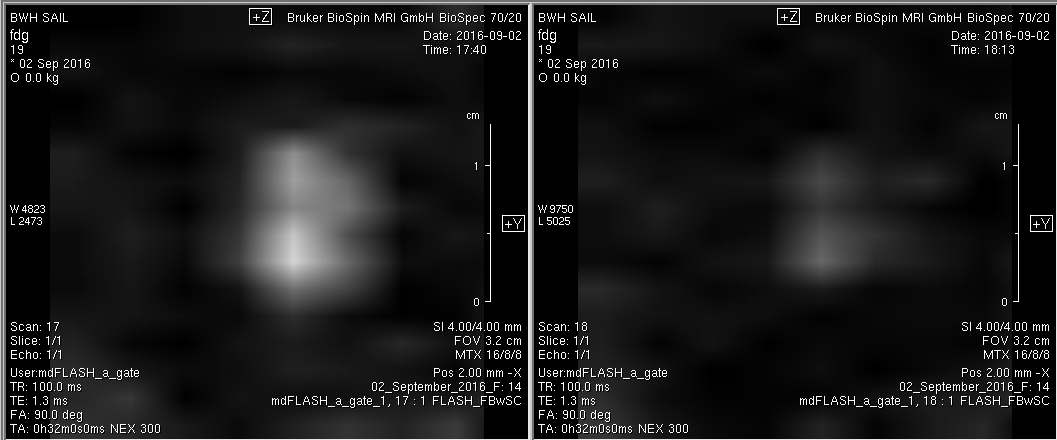
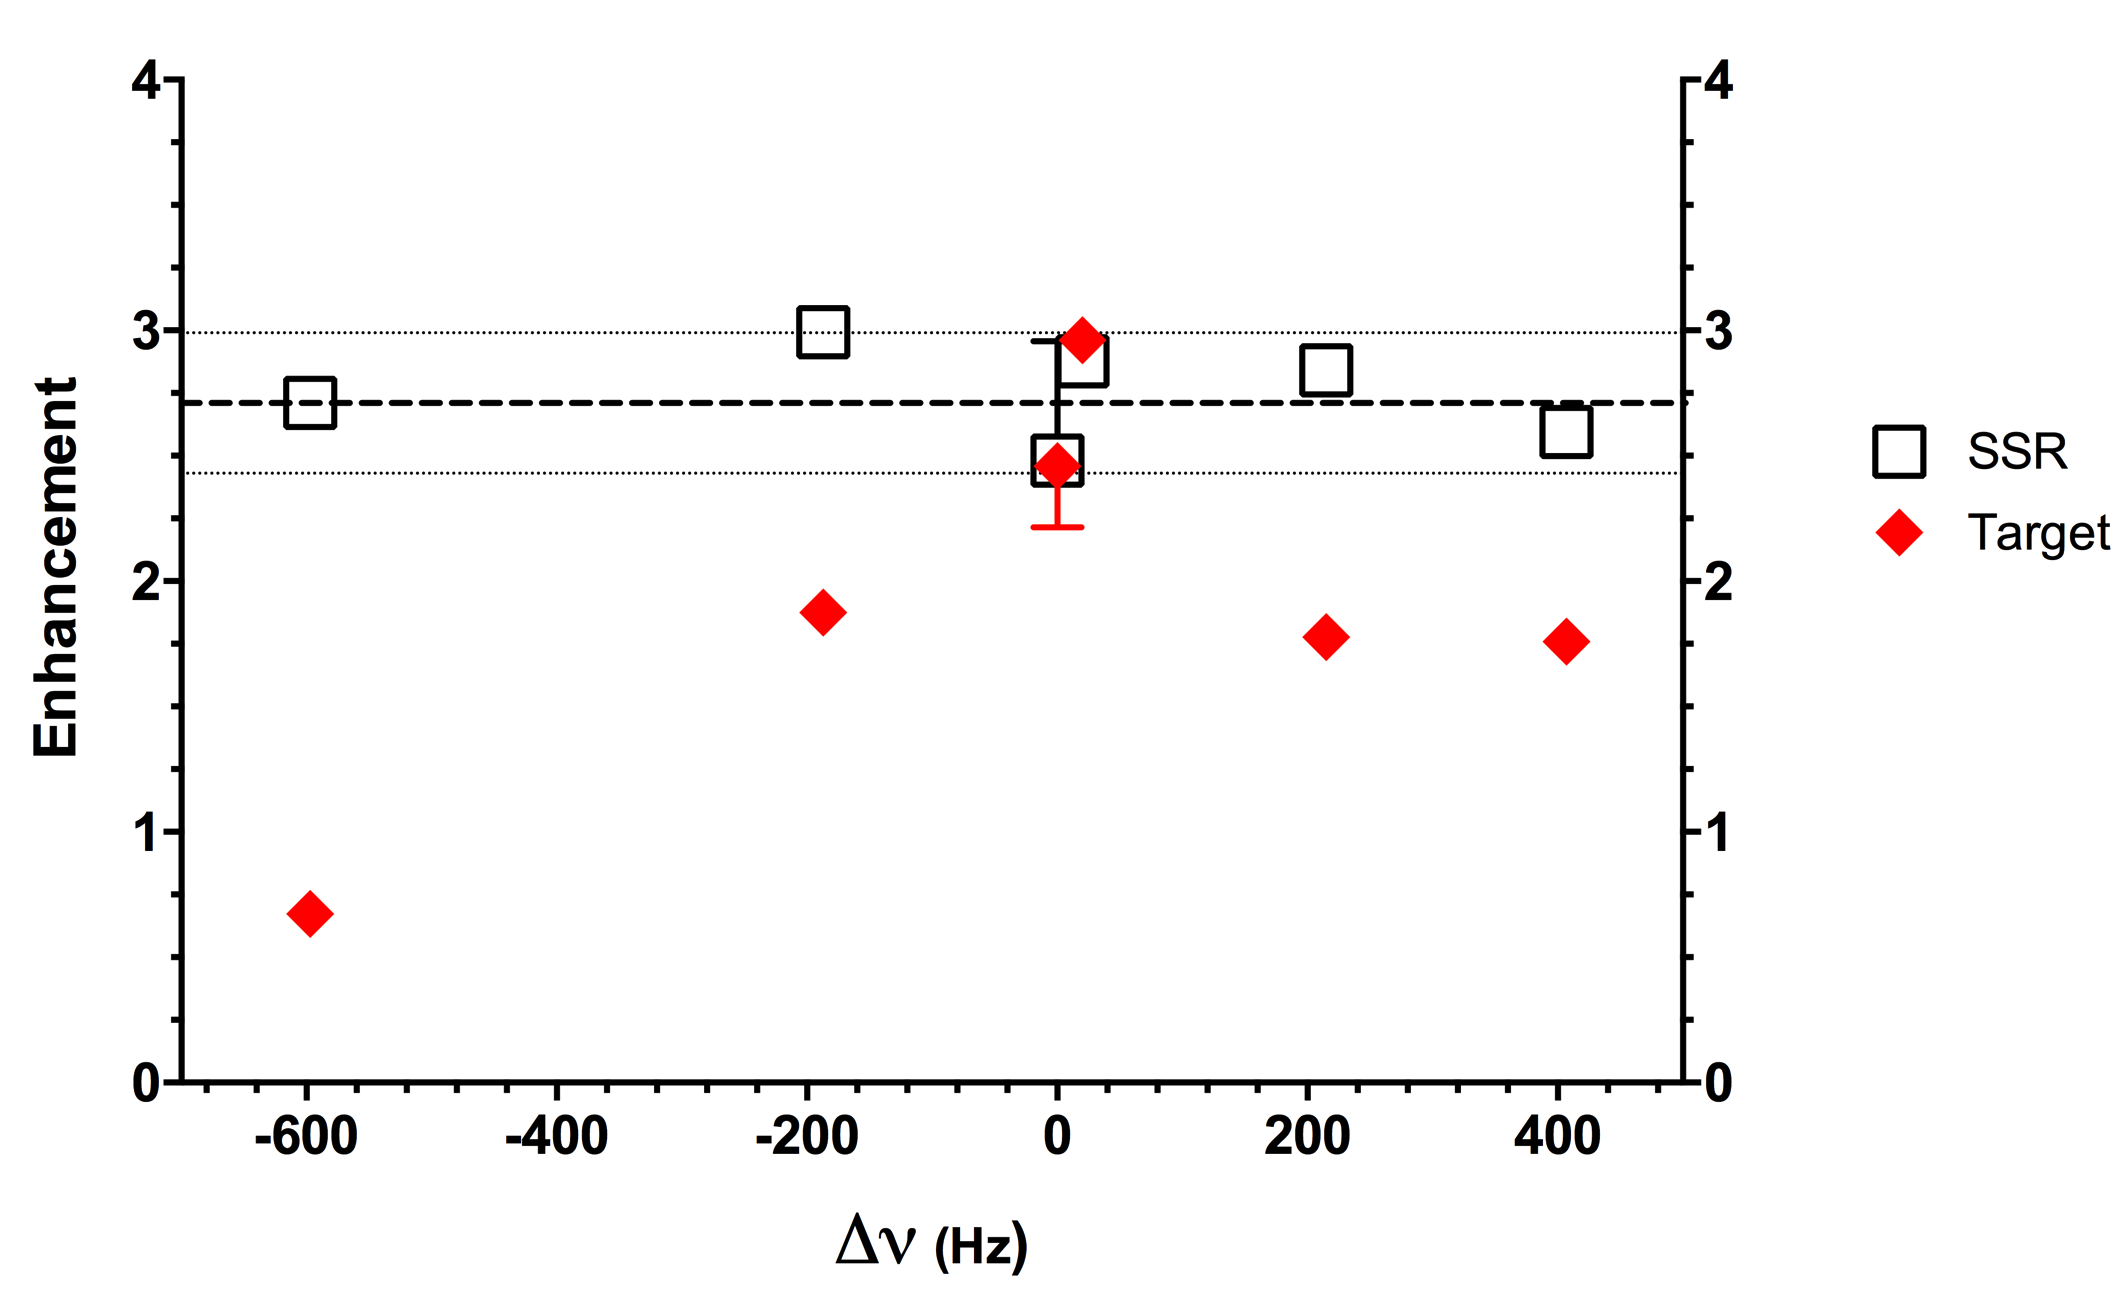
Figure 2 shows two images collected for 32 min. with and without feedback. Typically, enhancement factors of 2 to 3 are commonly obtained. Figure 3 shows the sensitivity of target enhancement to frequency offsets between the target and SSR.
Detectability curves (SNR vs concentration) were also measured at different imaging times and for comparison a FISP sequence. SNR's from the feedback Flash sequence at a TR of 50ms were slightly higher/similar to SNR's obtained from the FISP sequence at a TR of 5ms. Some banding effects are visible in the FISP images while the feedback Flash sequence did not show any banding. From the detectability curves we estimate that it is possible to image 1mM 19F FDG with a 100ul voxel size with an SNR~4 in ~30min.
Acknowledgements
No acknowledgement found.References
[1] N Bloembergen et al, Physical Review 95: 8-12 (1954). [2] SY Huang et al, MRM 60: 1112-1121 (2008). [3] F Wiesinger et al, ISMRM,Honolulu, p.2655 (2010). [4] SY Huang et al, Concepts MR: 30A: 378-393 (2007).Figures