3585
MRI assessment of spatial distribution of hypoxia in pre-clinical xenograft models of non-small cell lung cancer via GdDO3NI: A Novel Hypoxia-Binding T1 Contrast Agent1Arizona State University, Tempe, AZ, United States, 2Biodesign Institute, Arizona State University, Tempe, AZ, United States, 3Department of Materials Science and Engineering, South University of Science and Technology of China, Shenzhen, People's Republic of China, 4Norton Thoracic Institute, St. Joseph's Hospital and Medical Center, Phoenix, AZ, United States
Synopsis
Degree of tumor hypoxia and its spatial distribution could impact the therapeutic choices and lead to development of improved treatment plans. This study uses a hypoxia binding T1 contrast agent GdDO3NI, to evaluate the dependence of hypoxia activated pro-drug TPZ (Tirapazamine) on baseline tumor oxygenation and its effect on the oxygenation of two non-small cell lung cancer lines ( NCI-H1975 and patient derived xenograft M112004). GdDO3NI was able to report the changes in hypoxia distribution in the tumor models in response to Tirapazamine therapy and correlation with therapeutic effect.
Purpose
Given the clinical relevance of hypoxia in management of cancer1,2, it has been selected as a tumor-specific condition for the rational design of hypoxia-activated pro-drugs (HAPs)3 as well as of targeted imaging techniques that can aid in tumor categorization and therapy planning4. Hypoxia in tumors is a dynamic variable and MRI provides a powerful platform for generating 3-D spatial maps of hypoxia, non-invasively and longitudinally, with the use of a hypoxia binding contrast agent GdDO3NI5,6. The goal of this study was to investigate the potential of GdDO3NI to aid in prognostic identification of tumors with hypoxia, treatment planning and studying therapy response. We evaluated the tumor hypoxia using GdDO3NI and investigated tumor response to a hypoxia activated pro-drug in established as well as patient derived xenograft models of non-small cell lung cancer.Materials and Methods
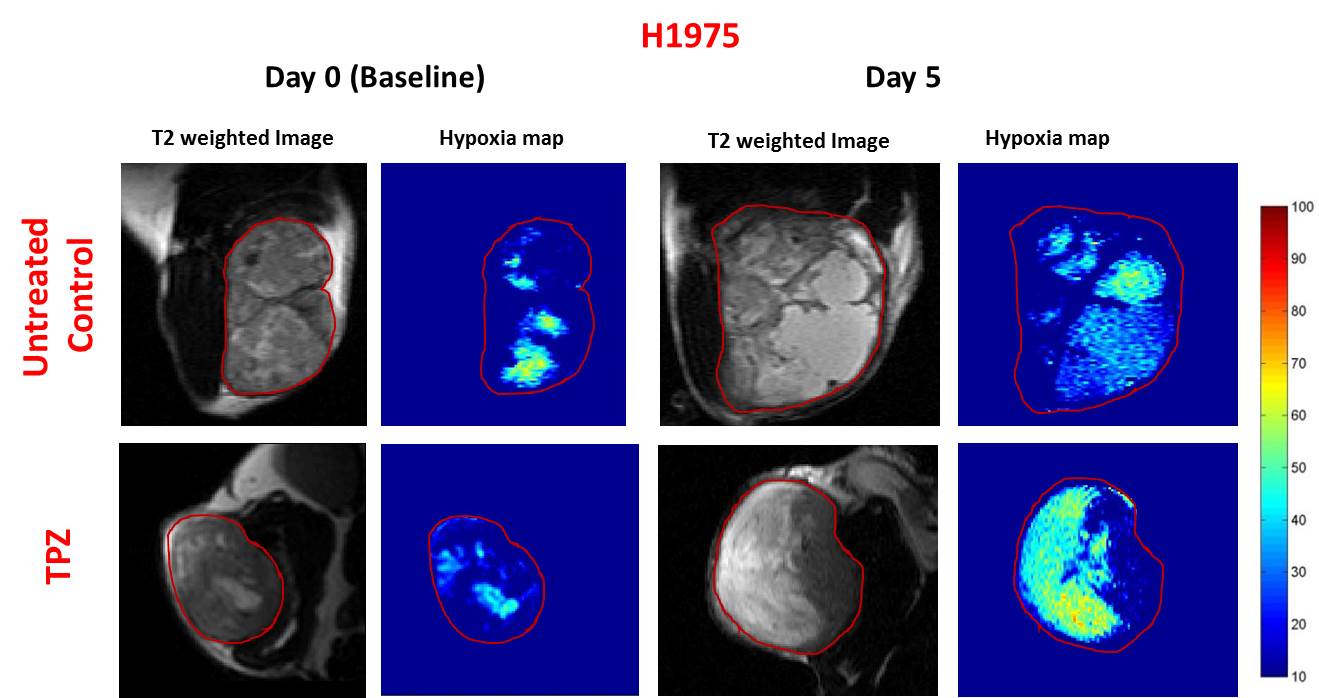
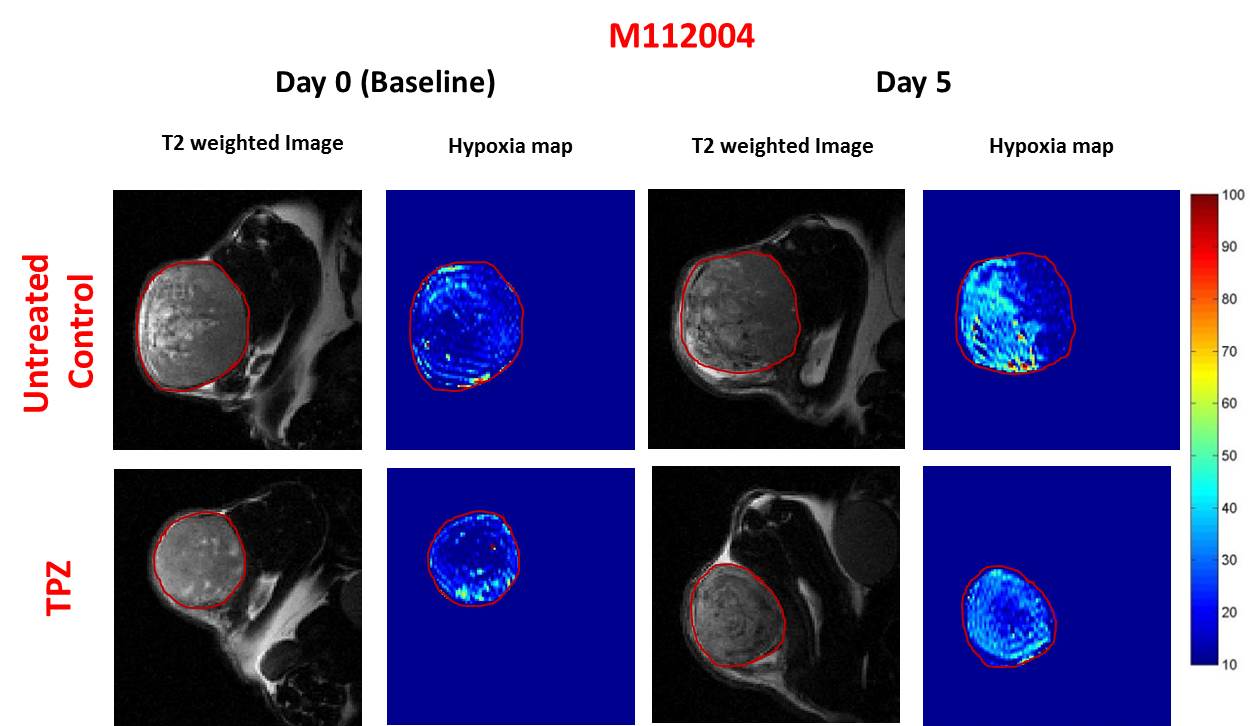
GdDO3NI was prepared as previously described5,6. Nu\nu mice were implanted subcutaneously with NCI-H1975 (NSCLC) or M112005 PDX tumor slurry. For baseline hypoxia distribution maps (day 0), 1 mm thick T1-weighted images were acquired pre and post injection of 0.1 mmole\kg body weight contrast agent (intravenously) for every 5 minutes up to 120 minutes post injection to a total time of 150 minutes. Tirapazamine (TPZ7, 60 µmole/kg) was immediately administered after baseline imaging on day 0. T1 maps were also acquired pre and post GdDO3NI injection. Pimonidazole was used as an ex-vivo marker for hypoxia and was administered simultaneously with GdDO3NI during post-treatment imaging (day 5). The tumors were then harvested for IHC staining. The T1 weighted images, pre and 2h post GdDO3NI injection were used to compute percentage enhancement maps in order to assess the degree of hypoxia. Percentage enhancement maps were thresholded at 10% for determination of hypoxic fractions (defined as fraction of tumor area displaying > 10% enhancement at 2h post injection).Results
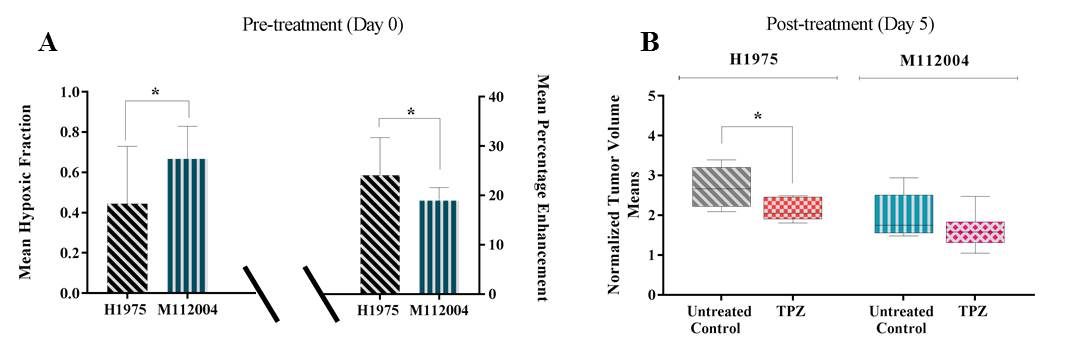
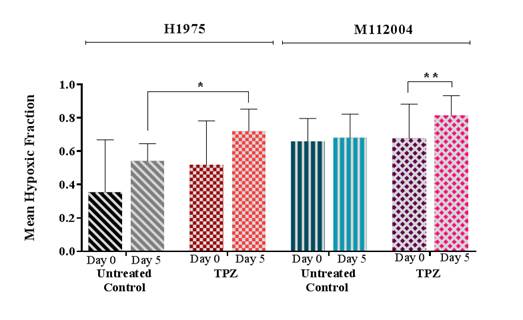
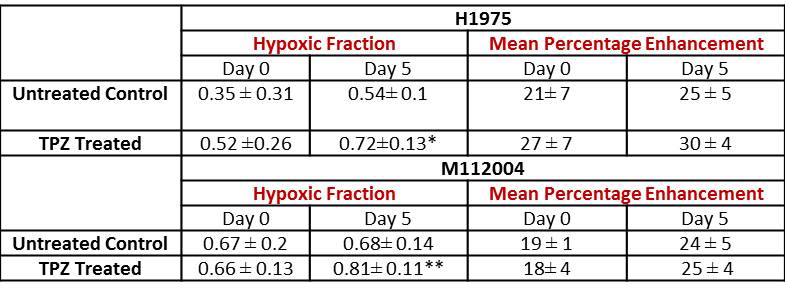
The mean baseline hypoxic fraction of H1975 tumors (0.45 ± 0.09) was significantly lower as compared to the M112004 tumors (0.67 ± 0.05) (fig 3 A). However, the mean percent enhancement of H1975 tumors (24 ± 8%) was significantly higher as compared to the M112004 tumors (19 ± 3%) (fig 3 A). The mean normalized tumor volume for TPZ treated H1975 tumors were significantly lower than the untreated control at day 5 while TPZ treated M112004 tumors were not significantly lower than untreated control (fig.3 B). The post-treatment mean hypoxic fraction of TPZ treated H1975 tumors was significantly higher than untreated control tumors (fig 4). M112004 tumors treated with TPZ had a significant increase in the mean hypoxic fraction from baseline (fig 4).Discussion
GdDO3NI was able to report the changes in the degree and distribution of hypoxia in both tumor models as a response to therapy. Percentage enhancement maps represent the voxels with varied binding and concentration of GdDO3NI, which in turn represents the variations in degree and distribution of hypoxia. M112004 tumors had higher baseline distribution of hypoxia and lower percent enhancement as compared to H1975 tumors. TPZ was effective in slowing down the tumor growth of H1975 tumors with significantly higher degree of hypoxia as compared to M112004 tumors, even though the mean baseline hypoxic fraction for M112004 was higher. TPZ also resulted in increased distribution of hypoxia in H1975 tumors as compared to untreated control cohort at day 5. M112004 tumors treated with TPZ had a significant increase in hypoxic fraction at day 5 from baseline. Prior studies have shown that TPZ causes vascular shutdown in the center of HCT-116 colon carcinoma tumor xenografts8,9 which may explain our finding of increased hypoxia on TPZ treatment.Conclusion
The recent failure of promising HAPs in the clinical trials has also brought to attention the need for not only prospective identification of tumors with hypoxia but also the spatial distribution of hypoxia and the inter-regional variations in the severity of hypoxia10,11. The tumor models of established cell lines often lack the diversity of clinically relevant mutations that are found in the patient tumors or patient derived xenografts and it is important to screen the HAPs over different tumor models to evaluate their efficacy12. GdDO3NI has the potential to provide longitudinal, volumetric, non-invasive assessment of hypoxia at a high resolution and excellent sensitivity, which could aid in therapy planning. Future work will involve further analysis of the time course intensity changes in post GdDO3NI contrast images for quantification of hypoxia via a pharmacokinetic model.Acknowledgements
No acknowledgement found.References
1. Hanahan, D. & Weinberg, R. A. Hallmarks of cancer: the next generation. Cell 144, 646-674, doi:10.1016/j.cell.2011.02.013 (2011).
2. Hockel, M. & Vaupel, P. Tumor hypoxia: definitions and current clinical, biologic, and molecular aspects. Journal of the National Cancer Institute 93, 266-276 (2001).
3. Wilson, W. R. & Hay, M. P. Targeting hypoxia in cancer therapy. Nature reviews. Cancer 11, 393-410, doi:10.1038/nrc3064 (2011).
4. Fleming I.N. et al. Imaging tumour hypoxia with positron emission tomography. British Journal of Cancer 112, 238–250 (2015)
5. Gulaka, P. K. et al. GdDO3NI, a nitroimidazole-based T1 MRI contrast agent for imaging tumor hypoxia in vivo. Journal of biological inorganic chemistry : JBIC : a publication of the Society of Biological Inorganic Chemistry 19, 271-279, doi:10.1007/s00775-013-1058-5 (2014).
6. Rojas-Quijano, F. A. et al. Synthesis and characterization of a hypoxia-sensitive MRI probe. Chemistry 18, 9669-9676, doi:10.1002/chem.201200266 (2012).
7. Brown, J.M., SR 4233 (tirapazamine): a new anticancer drug exploiting hypoxia in solid tumours. Br J Cancer 67(6), 1163-70 (1993).
8. Huxham L.A. et al. Tirapazamine causes vascular dysfunction in HCT-116 tumour xenografts. Radiotherapy & Oncology 78 (2), 138-45 (2006).
9. Huxham L.A. et al. Exploring vascular dysfunction caused by tirapazamine. Microvascular Research 75 (2), 247-55 (2008).
10. Phillips, R.M. Targeting the hypoxic fraction of tumours using hypoxia-activated prodrugs. Cancer Chemotherapy and Pharmacology 77(3), 441-457 (2016.)
11. Francis Wh et al. Hypoxia-activated prodrugs: paths forward in the era of personalised medicine British Journal of Cancer 114, 1071–1077 (2016).
12. Hidalgo, M. et al. Patient-derived xenograft models: an emerging platform for translational cancer research. Cancer Discov 4, 998-1013, doi:10.1158/2159-8290.CD-14-0001 (2014).
Figures