3580
β‑alanine Loaded Hollow Mesoporous Silica Nanospheres: A Potential Contrast Agent for Magnetic Resonance Spectroscopy Imaging of Brain Glioma1Radiology, Huashan Hospital of Fudan University, Shanghai, People's Republic of China, 2GE Healthcare, Shanghai, People's Republic of China
Synopsis
The β‑alanine loaded hollow mesoporous silica nanospheres (AMSNs) with a characteristic MRS spectrum are successfully synthesized and used for contrast enhanced magnetic resonance spectroscopy (MRS) imaging of brain glioma. Material characterizations, in vitro and in vivo cytotoxicity studies and contrast enhanced MRS imaging of both subcutaneously transplanted glioma and in situ glioma are conducted with the synthesized AMSNs.
Purpose
To explore distinctive exogenous MRS contrast agents (CAs) to reliably distinguish brain glioma from other diseases.Methods
1. Synthesis of AMSNs
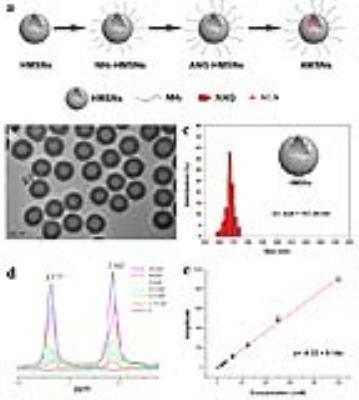
The schematic diagram in Figure 1a summarizes the synthetic process of β‑alanine loaded hollow mesoporous silica nanospheres (AMSNs). Firstly, monodispersed hollow mesoporous silica nanospheres (HMSNs) were synthesized via a typical three-step process according to a typical “structural difference-based selective etching” strategy.1, 2 To modify HMSNs with angiopep-2 (ANG) for easily crossing the blood-brain-barrier (BBB) and targeting glioma, HMSNs were firstly aminated by 3-Aminopropyltriethoxysilane (APTES). Then, β‑alanine (ALA) was loaded into the cavity and mesoporous pore of the as-synthesized HMSN via simple mechanical stirring.
2. Cytotoxicity and cytophagy in vitro
BCECs, a major integrated component of blood vessel endothelium, and C6 glioma cells, were chosen to assess the cytotoxicity of ANG-HMSNs and AMSNs via the typical CCK-8 assay. Then C6 glioma cells were co-incubated ANG-HMSNs and AMSNs respectively, and collected for MRS imaging. To verify the fact that C6 cells can phagocytize HMSNs, FITC was conjugated to the surface of ANG-HMSNs for fluorescence imaging.
3. MR Spectra in vivo
Rats with subcutaneously transplanted glioma were used and 1 mL AMSNs physiological saline solution (10 mg/mL, 40 mg/kg) was intratumorally injected. Furthermore, we intravenously injected the same dosage of AMSNs into the rats with brain glioma in situ through the tail vein. In vivo MR imaging was performed on 7.0 T small animal MR imaging system equipped with a surface coil before and after the intratumor/intravenous injection of AMSNs solution.
Results and discussion
Our investigations have demonstrated that AMSNs have been successfully synthesized with high biosafety and could serve as specific MRS CAs for brain glioma’s detection both ex-situ and in-situ, which helps to greatly enhance the diagnostic accuracy in comparison with the conventional MRS.
1. Synthesis and Characterizations of AMSNs
Herein, AMSNs have been synthesized and used as exogenous CAs for contrast enhanced MRS based on the following two major merits: (1) ALA is a kind of safe nutrition that is absent in the central nervous system. In the characteristic MRS spectrum, the peak of ALA at 2.562 ppm should not be interfered by other metabolites in brain;3,4 (2) HMSNs can serve as nanocarriers to encapsulate large amounts of ALA with remarkable bio-safety and flexible facile modification.5, 6, 7 The synthesized HMSNs exhibit uniform hollow spherical morphology and narrow diameter distribution centered at 168 nm (Figure 1b-c). To calculate the loading dosage of ALA, standard curve of free ALA was established by quantifying the resonance peak areas at 2.562 ppm or 3.177 ppm of the MRS spectra, which are the two characteristic peaks of ALA (Figure 1d-e). In this study, the ALA loading capacity is 68 mg/g.
2. Cytotoxicity and cytophagy in vitro
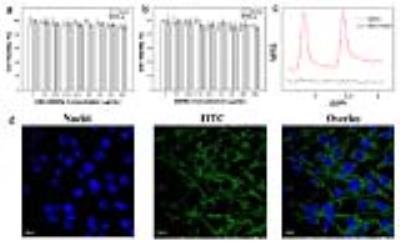
As shown in Figure 2a-b, the cellular viabilities were found to retain around 90% after 24 h of incubation even with a relatively high concentration (1000 µg/mL) of ANG-HMSNs or AMSNs, which indicates their low cellular toxicity and remarkable biocompatibility. Figure 2c demonstrates that cells only cultured with AMSNs displays the characteristic spectrum of ALA. As shown in Figure 2d, the green fluorescence of FITC-HMSNs could be observed in the cytoplasm of C6 cells after 2 h of co-incubation.
3. MR Spectra in vivo
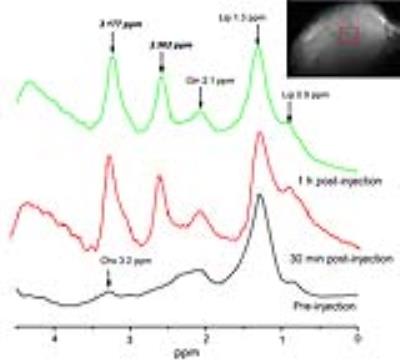
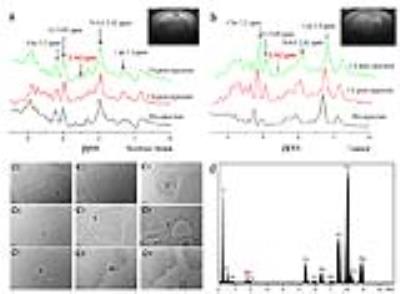
For subcutaneously transplanted glioma, as shown in Figure 3, there is no peak at 2.562 ppm in the MRS spectra obtained before the injection of AMSNs. After intratumoral injection of AMSNs, two remarkable peaks are shown compared to the pre-injection spectra, which were attributed to the injected AMSNs. For in situ glioma, as shown in Figure 4, there is a small peak at 2.562 ppm at 1 h post-injection and even persisted till 2 h, while the spectra of pre-injection did not show any peak at 2.562 pm (Figure 4b). For another, the spectra of normal brain do not show any difference between those of pre-injection and post-injection, which demonstrates that the MRS CAs of AMSNs are specific to glioma (Figure 4a). To verify that the emerging peak at 2.562 ppm in the glioma region is originated from the AMSNs targeted, brain tissue was harvested after MR scanning and glioma was isolated. The biological TEM images of the ultrathin sections of in situ glioma (Figure 4c1-9) and the corresponding EDX (Figure 4d) confirm that the AMSNs do target to the glioma in brain.
Conclusion
In summary, the constructed AMSNs with a characteristic MRS spectrum have been synthesized and used as remarkably efficient MRS CAs for brain glioma diagnosis. Our investigations show that the outstanding contrast enhanced MRS using the biocompatible AMSNs can substantially promote the diagnostic efficiency and improve the diagnostic confidence of glioma. To our best knowledge, this is the first time to study on the exogenous specific MRS CAs. Similarly, specific MRS CAs may find a universal application in the accurate diagnosis of other diseases, which is hopeful to further accelerate the progress and break the shackle of current MRS technology.Acknowledgements
This work has been financially supported by the National Natural Science Foundation of China (Grant No. 81271633, 51372260), the Science and Technology Commission of Shanghai (Grant No. 12ZR1404600), the Shanghai Excellent Academic Leaders Program (Grant No.16XD1404000). We thank Dr. Bingrong Zhuang from the electronic microscope center of Shantou Medical College, Shantou University for preparing the ultrathin sections of rats’ brain and glioma. We thank Dr. Zunguo Du from the pathology department of Huashan Hospital, Fudan University for assessing the histological changes of mice’s tissues. We thank Dr. Chen Zhang, Yu Chen, Jianan Liu, Meng Zhang, Ping Hu, Zhongmin Tang and Zhaowen Cui from Shanghai Institute of Ceramics, Chinese Academy of Sciences for useful discussions.References
1. Chen F, Hong H, Shi S, et al. Engineering of Hollow Mesoporous Silica Nanoparticles for Remarkably Enhanced Tumor Active Targeting Efficacy. Sci Rep. 2014; 4: 5080
2. Fang X, Chen C, Liu Z, et al. A cationic surfactant assisted selective etching strategy to hollow mesoporous silica spheres. Nanoscale. 2011; 3(4): 1632-1639.
3. Sale C, Artioli GG, Gualano B, et al. Carnosine: from exercise performance to health. Amino Acids. 2013; 44(6): 1477-1491.
4. McMurray RG, Hackney AC. Interactions of metabolic hormones, adipose tissue and exercise. Sports Med. 2005; 35(5): 393-412.
5. FDA; http://www.fda.gov/Food/IngredientsPackagingLabeling/GRAS/SCOGS/ucm084104.htm
6. Halas NJ. Nanoscience under glass: The versatile chemistry of silica nanostructures. Acs Nano. 2008; 2(2): 179-183.
7. Garcia-Bennett AE. Synthesis, toxicology and potential of ordered mesoporous materials in nanomedicine. Nanomedicine. 2011; 6(5): 867-877.
Figures


