3578
Lipo2-DG-CEST: a new theranostic agent for simultaneous tumour imaging and chemotherapy1Brain Repair and Rehabilitation, Institute of Neurology, London, United Kingdom, 2Department of Chemistry, University College of London, London, United Kingdom, 3Department of Medical Physics & Bioengineering, University College of London, London, United Kingdom
Synopsis
2-DG has been shown to inhibit tumor growth in vivo; however, it cannot be used as a therapeutic agent in humans due to its toxicity. Here we show the potential for 2-DG-loaded liposomes to provide detectable Chemical Exchange Saturation Transfer (CEST) contrast, and thereby achieve simultaneous tumour imaging and chemotherapy by targeting areas of greater tumour metabolism. The CEST signal arising from 2-DG was compared to liposome-encapsulated 2-DG and to natural D-glucose, respectively. The results demonstrated an increase in signal for2-DG loaded liposomes when compared to both free 2-DG and glucose possibly due to a decrease in the global exchange rate.
Introduction
2-Deoxy-D-glucose (2-DG) is a well-characterized glycolytic inhibitor and has been shown to inhibit tumor growth in vivo 1. However its use has not been promoted any further due to its inherent toxicity. Here we investigated whether we could use the sensitivity of GlucoCEST 2 to detect liposome-encapsulated 2-DG. Such a method would allow for high-concentration targeting of the drug to cancer cells via both active and passive targeting, thereby making it less toxic and potentially applicable for chemotherapy. Prior to translating Lipo-2-DG for use in vivo, we have carried out a basic analysis of the CEST signal generated by liposome-encapsulated 2-DG to ensure that it can be detected through chemical exchange of the hydroxyl protons.Methods
1,2-Dipalmitoyl-sn-glycero-3-phosphocholine (DPPC) liposomes containing 0.5 M glucose or 0.5 M 2-DG were formulated in 20% phosphate buffer saline (PBS) at pH 5.8 via sonication, extruded to achieve an average diameter of ~200 nm and dialysed into 0.25 M NaCl solution. The overall sugar concentrations for both liposome samples were enzymatically measured and adjusted to 23 mM. Free sugar controls were made up at 23 mM in 20% PBS at pH 5.8. To further examine the effect of the buffer concentration on the measured CEST signal, 2-DG-liposomes with an overall 2-DG concentration of 40 mM and at pH varying between 6 and 7 were prepared at different PBS concentrations of 0%, 5%, 10% and 20 %. To investigate the effect of lipid bilayer composition 2-DG liposomes were formulated using two different types of lipid (i.e. DPPC, DSPC) at pH 6 and 7. Finally, to examine the effect of liposome size on the CEST signal, liposomes were prepared with three different diameters: 200 nm, 150 nm and 120 nm, with overall 2-DG concentrations of 39 mM and 14 mM at pH=7.
All samples were imaged at 20 °C and 37 °C on a 9.4T Agilent scanner using a transmit/receive RF coil with 33mm inner diameter (Rapid Biomedical). CEST measurements were acquired using a single-shot single-slice spin-echo (SE) echo planar imaging (EPI) sequence (TR=65.3ms, TE=4.07ms, FOV=20x20mm², slice thickness=5mm, matrix size=64x64) with a saturation train prior to the readout consisting of 150 Gaussian pulses (pulse length = 50 ms, 99% duty cycle) at two different power levels, 1.5μT (FA=982°) and 5.0 μT (FA=3000°).
Results
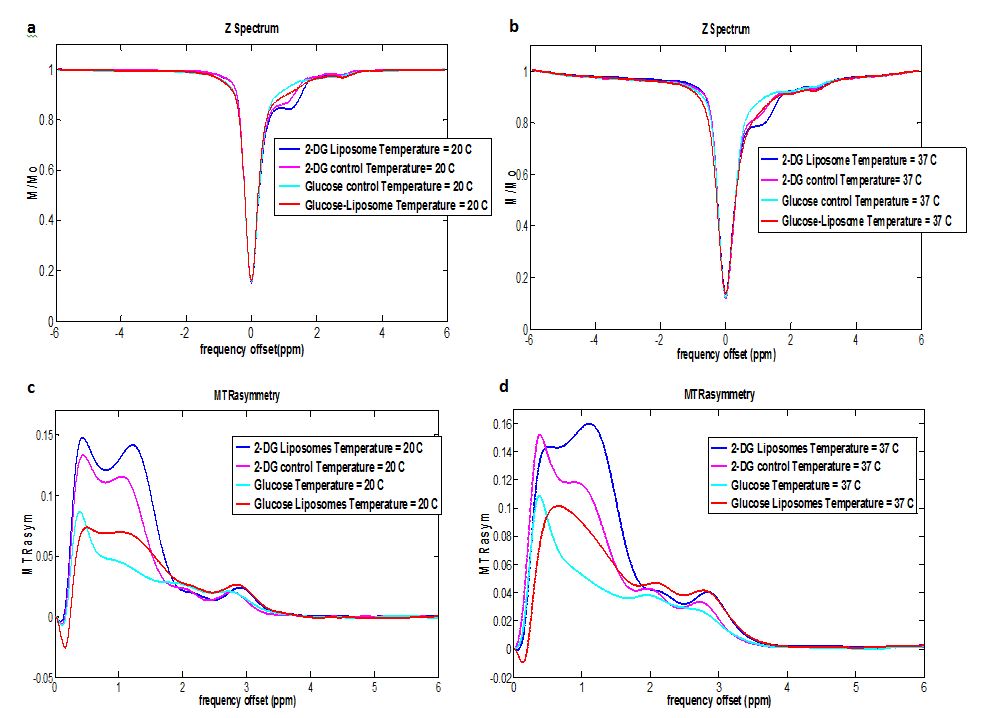
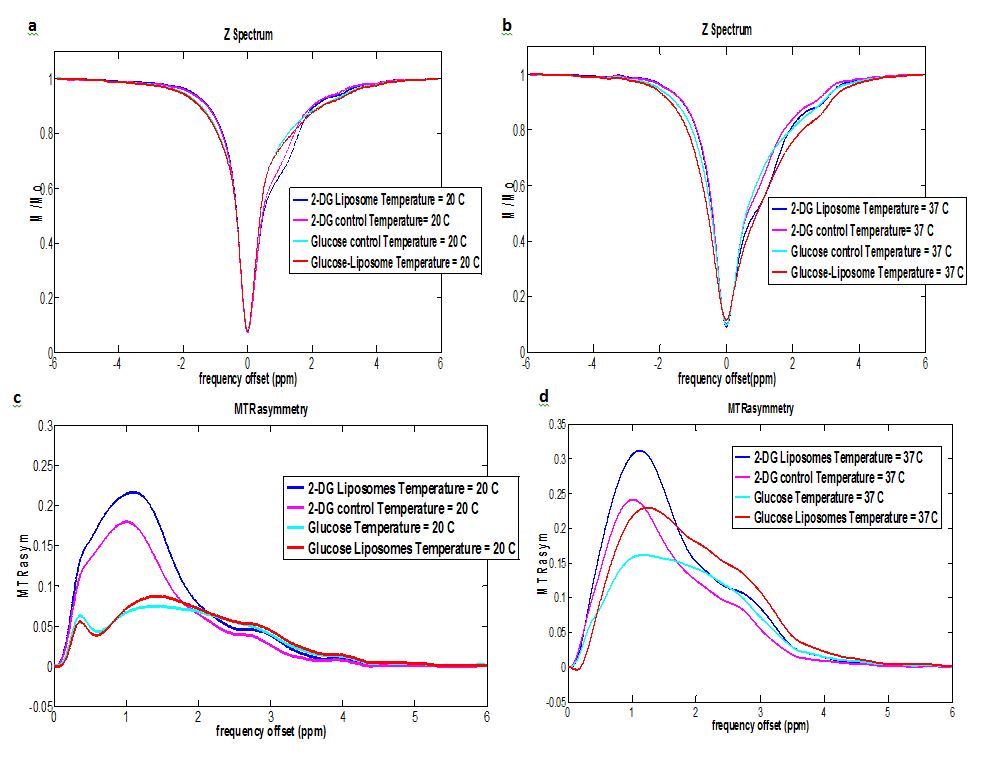
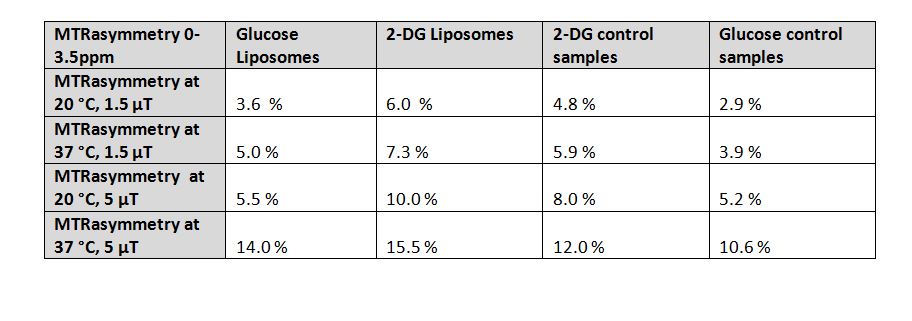
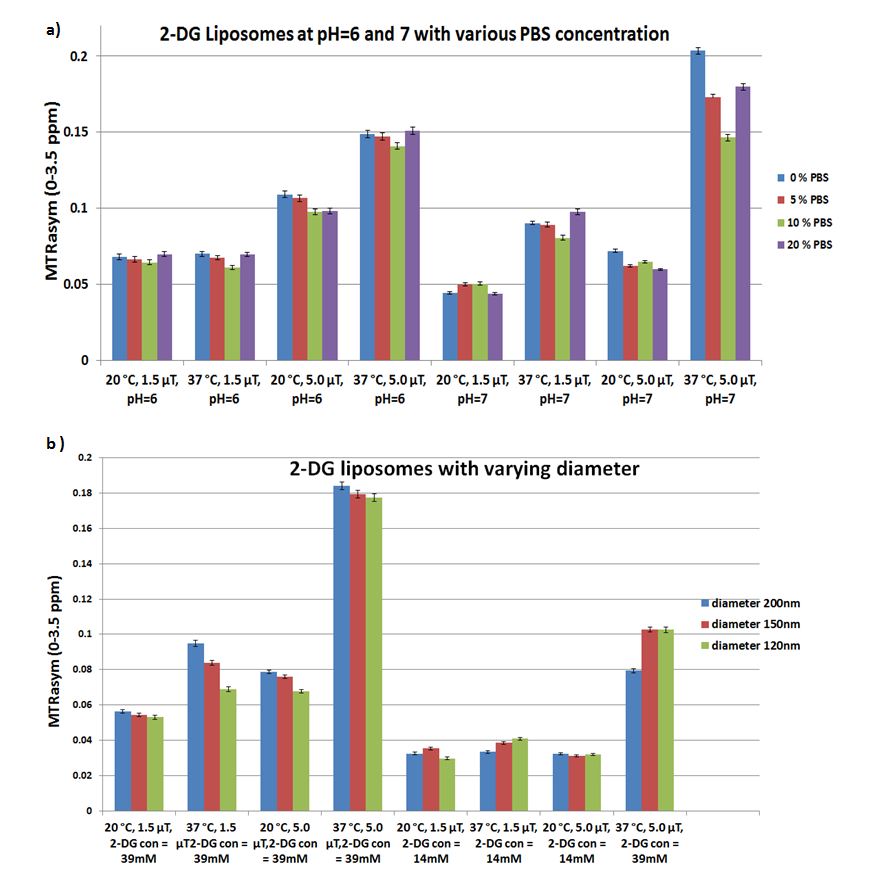
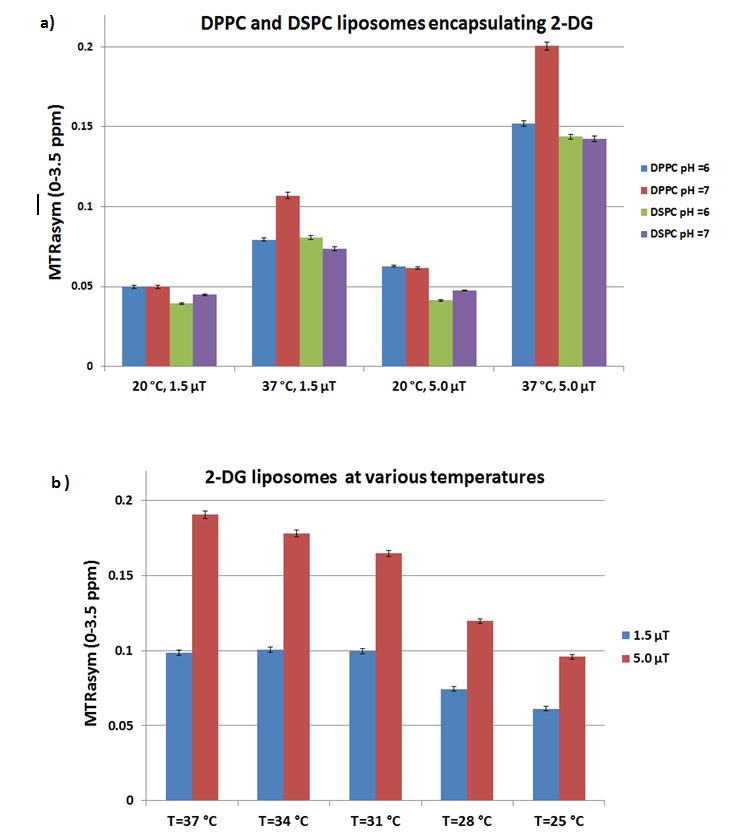
Figures 1 and 2 show the Z- and MTRasymmetry spectra for the glucose and 2-DG liposomes and their free sugar controls at power levels of 1.5 μT and 5.0 μT, respectively. The MTRasymmetry was greater for the liposomal sugar formulations than the respective controls. Additionally, 2-DG gave a greater CEST contrast than glucose in both liposomal and control samples. These results were consistent across both temperatures and powers (Figures 1,2c-d). Table 1 summarizes the average percentage signal enhancement between 0 and 3.5 ppm for all sample measurements. Figure 4 displays bar charts of 2-DG liposomes prepared at different PBS concentrations (Fig 4a) and with different diameters (Fig 4b). The CEST signal was found to be larger for a power level of 5 μT at 37 °C when compared to the signal at both 1.5 μT at 20 °C and 5 μT at 20 °C in both experiments. Subtle variations were detected in the MTRasymmetry with varying PBS concentration and liposome diameter especially for in-vivo conditions (i.e. pH=7, 37 °C). We concluded that 20% PBS and liposomes having an average diameter of 200nm gave the best compromise in terms of CEST signal. Figure 5 shows that 2-DG encapsulated by DSPC bilayers produced a less prominent CEST signal than DPPC bilayers. The greatest signal was acquired at 37 oC, 5 μT, pH 7 and with a bilayer comprised of DPPC. The composition of the phospholipid bilayer and the temperature affect the CEST signal because they alter the permeability of the lipid membrane and hence affect chemical exchange through intramembrane exchange.
Discussion and Conclusion
This work demonstrates for the first time that liposomes loaded with 2-DG or glucose can be used to obtain CEST contrast. The enhanced CEST detectability of the 2-DG liposomes may be i) due to a difference in the exchange rate of the hydroxyl protons on 2-DG compared to glucose at pH 5.8 and ii) through modification of the global exchange rate, by a combination of exchange through the lipid layer and the chemical exchange itself.Acknowledgements
No acknowledgement found.References
[1] Nasrallah F et al, J Cereb Blood Flow Metab, 2013 April, 33:1270-1278.
[2] Walker-Samuel, Nat Med. 2013 Jul;
Figures