3575
Detection of dynamic substrate binding using MRI1Russell H. Morgan Department of Radiology and Radiological Science, The Johns Hopkins University School of Medicine, Baltimore, MD, United States, 2FM Kirby Research Center, The Kennedy Krieger Institute, Baltimore, MD, United States
Synopsis
Magnetic Resonance Imaging (MRI) is rarely used for molecular binding studies and never without synthetic metallic labels. We designed an MRI approach that can selectively detect substrate-target interaction by exploiting the narrow resonance of protons in free substrate for selective radio-frequency (RF) labeling and, subsequently, the process of immobilisation upon binding to a solid-like target for fast dipolar transfer of this label over the protons in its backbone. This cascade of events is ultimately detected via the water MRI signal with enhanced sensitivity. We demonstrate the principle for caffeine binding in vitro and in vivo.
Introduction
Due to its inherent poor sensitivity, MRI (water-detection) methods for studying substrate binding have been limited to indirect observations (e.g., observing hemodynamic responses1) or animal studies where receptor substrates are labeled with metallic compounds.2,3 To our best knowledge, there currently are no molecular MRI approaches that can study the target binding of non-chemically labeled substrates. Early MT studies4-8 have shown the existence of a coupling between small metabolites and water that is mediated through nearby semi-solid components.
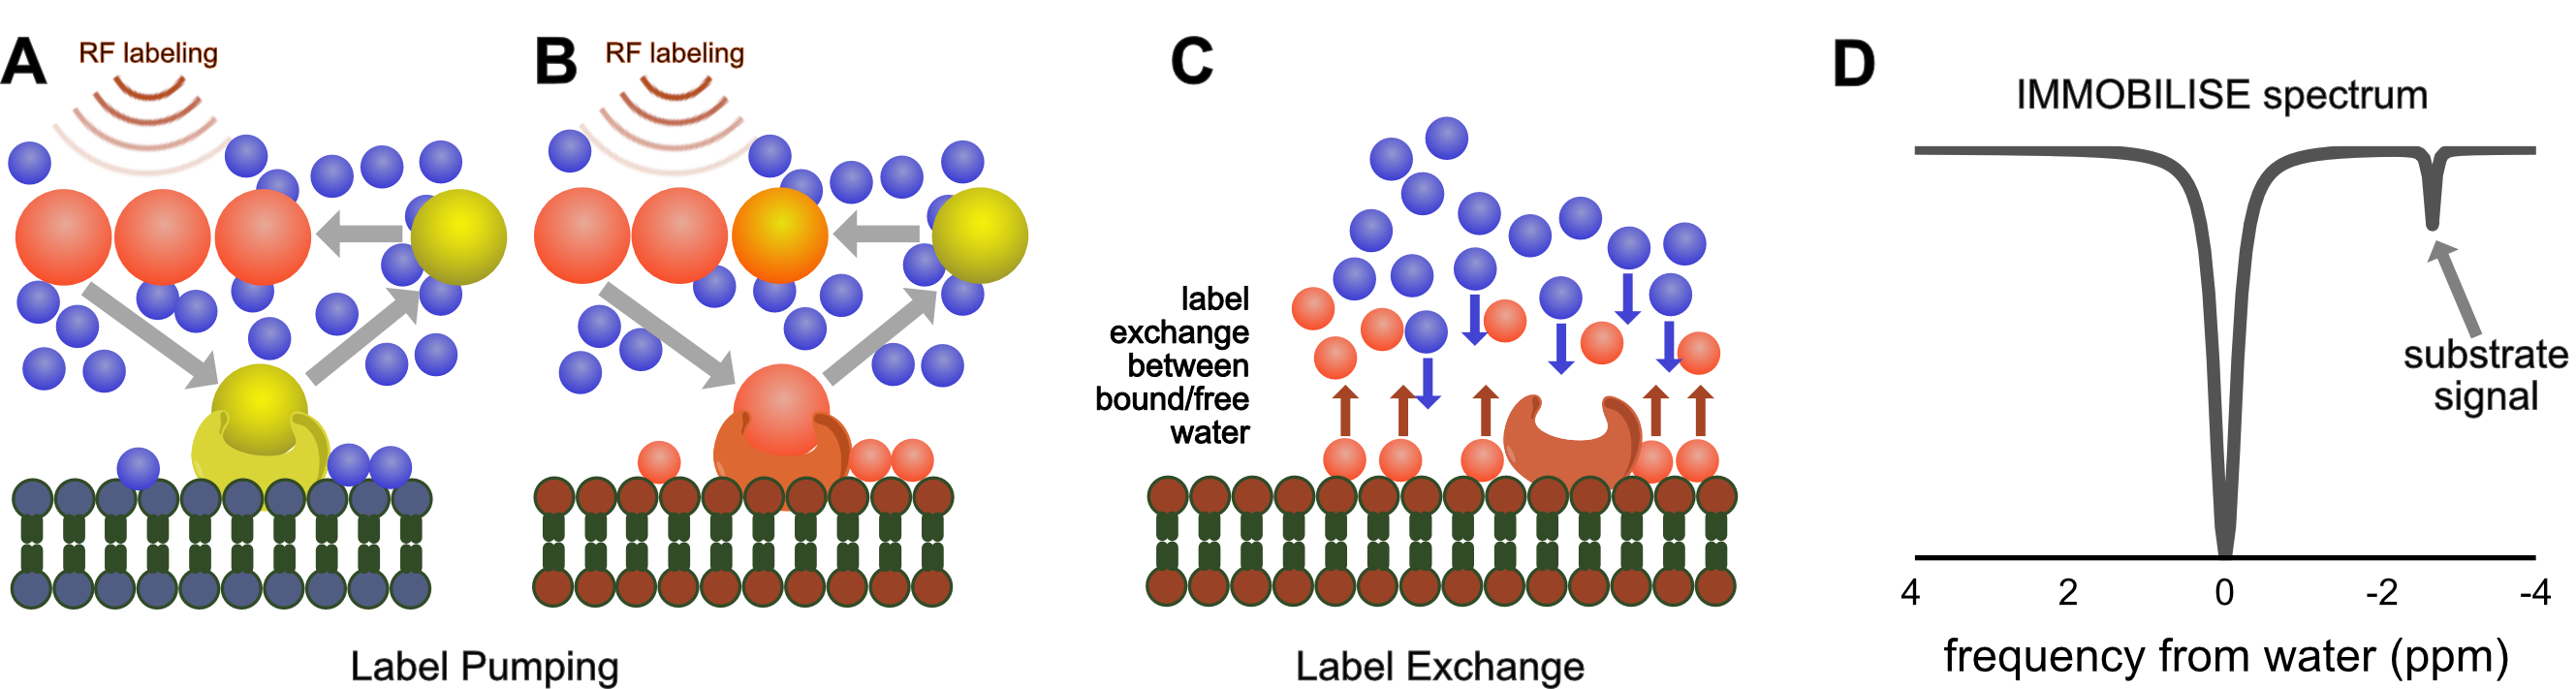
Here we exploit this coupling to design a molecular pump based sensitivity enhancement method that allows the water-based imaging of dynamic binding of actual biological substrates (no chemical modifications) to a macro-molecular target. The principle of the approach, outlined in Fig. 1, is based on the continuous pumping of a magnetic label from substrate to the water signal detected by MRI (Fig. 1). Based on this mechanism, we call this the “IMMOBILISE” approach, for “IMaging of MOlecular BInding using Ligand Immobilization and Saturation Exchange”.
Methods
In vitro experiments were performed on phantoms prepared using a combination of a caffeine solution (100 mM), 20% (w/w) bovine serum albumin (BSA), and 25% glutaraldehyde separately and for cross-linking the BSA.5 MRI scans were done on a 17.6 T at 37°C using a 3 s, 0.5 mT CW saturation pulse followed by a single shot MRI readout. The saturation frequency was stepped over the proton spectral range (±6 ppm in steps of 0.15 ppm). In vivo MR studies were carried out on a 11.7T horizontal MRI scanner as described previously.9 IMMOBILISE MRI images were acquired before and after the i.v. administration of a caffeine solution (50 mL of 100 mM caffeine in PBS with pH 7.4, n=5) or PBS (n=3) in BALB/c mice. The labeling preparation consisted of a 3 s, 0.5 mT CW saturation pulse followed by a two-shot FSE readout with TR/TE = 6000/4 ms, a 64x64 acquisition matrix across a field of view of 17x17 mm2 and 1mm slice thickness. Prior to a bolus infusion, a complete Z-spectrum was acquired with saturation frequencies between ±4 ppm and a partial spectrum with frequencies at -0.50, -0.75, -1.00, -1.25, -1.50, -2.00. Acquisition of each partial Z-spectra took 105s and was continued for 1-hour post bolus. In vivo data was analyzed by subtracting the signal after caffeine infusion from the reference scans acquired prior to infusion. Maps were generated by mapping the signal difference (pre minus post infusion) between the partial spectra (-1.0 to -2.0 ppm). B0 field correction was done using the WASSR method.10Results
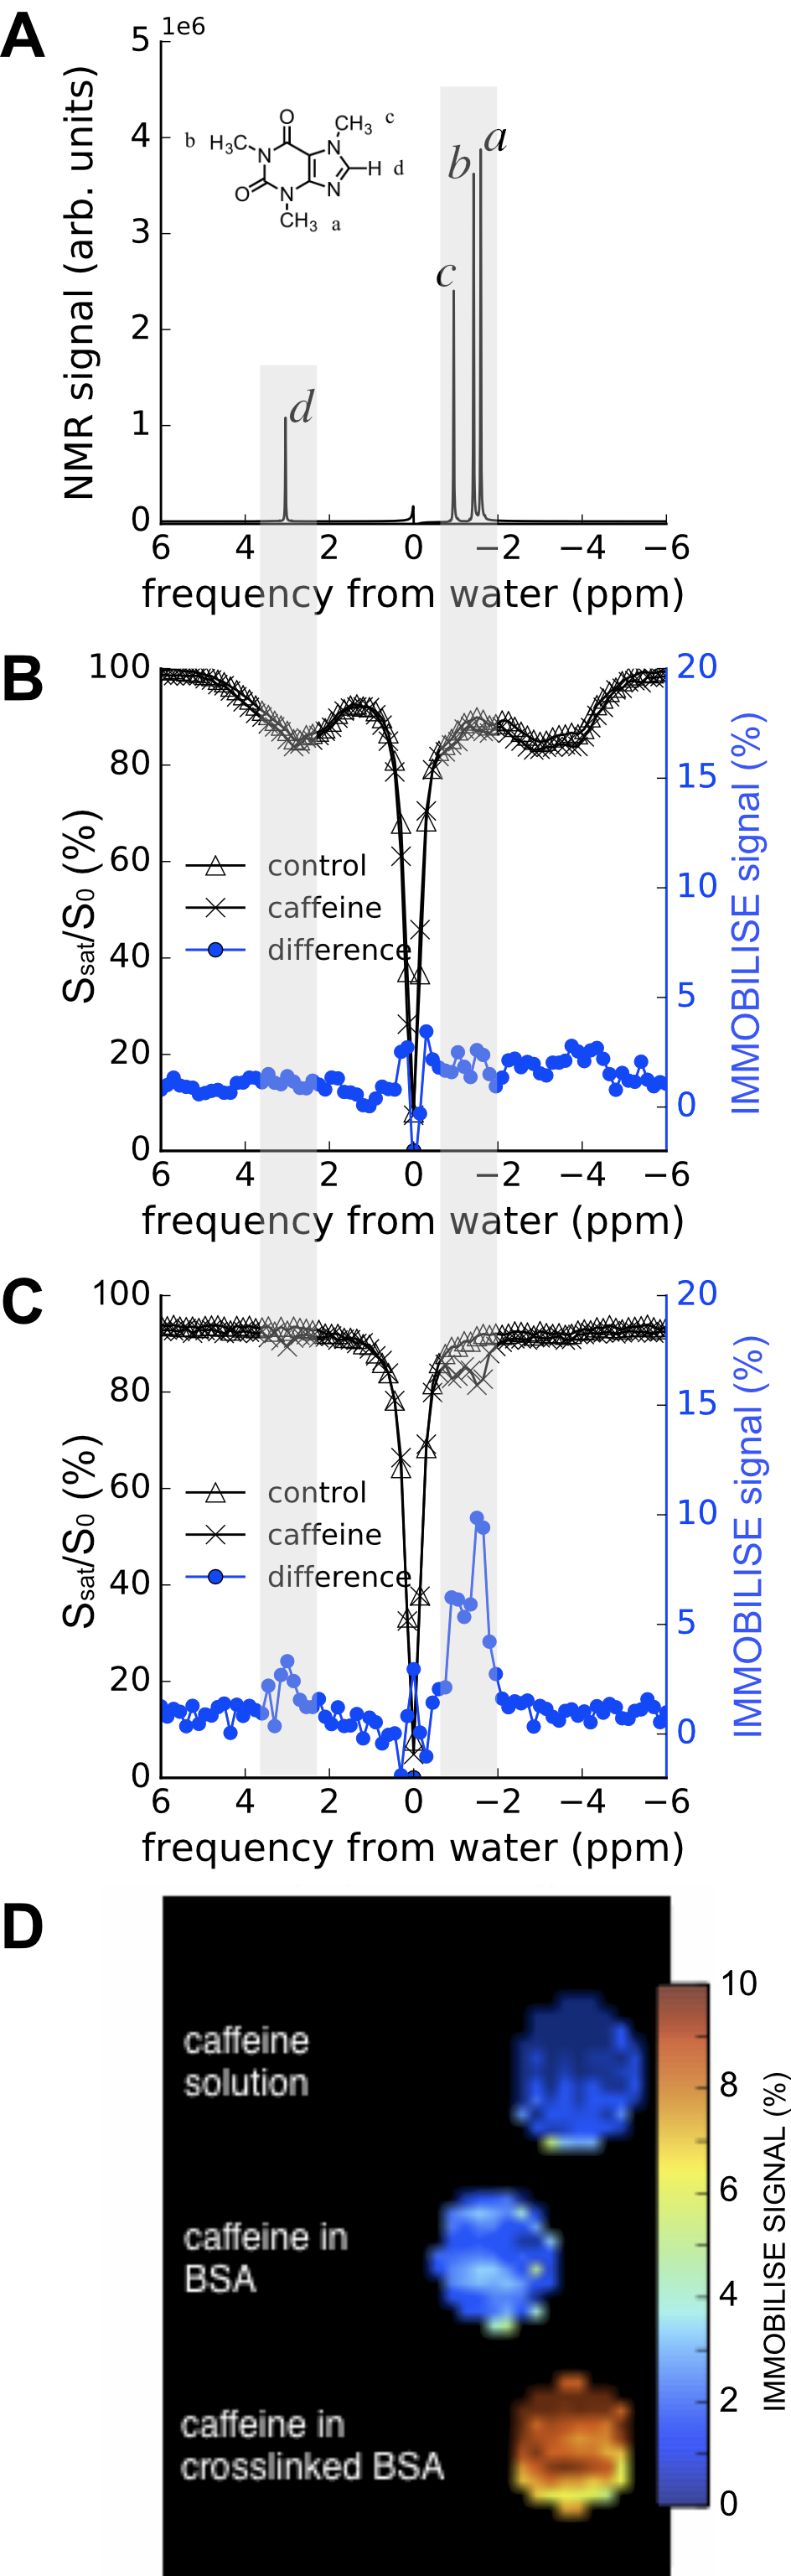
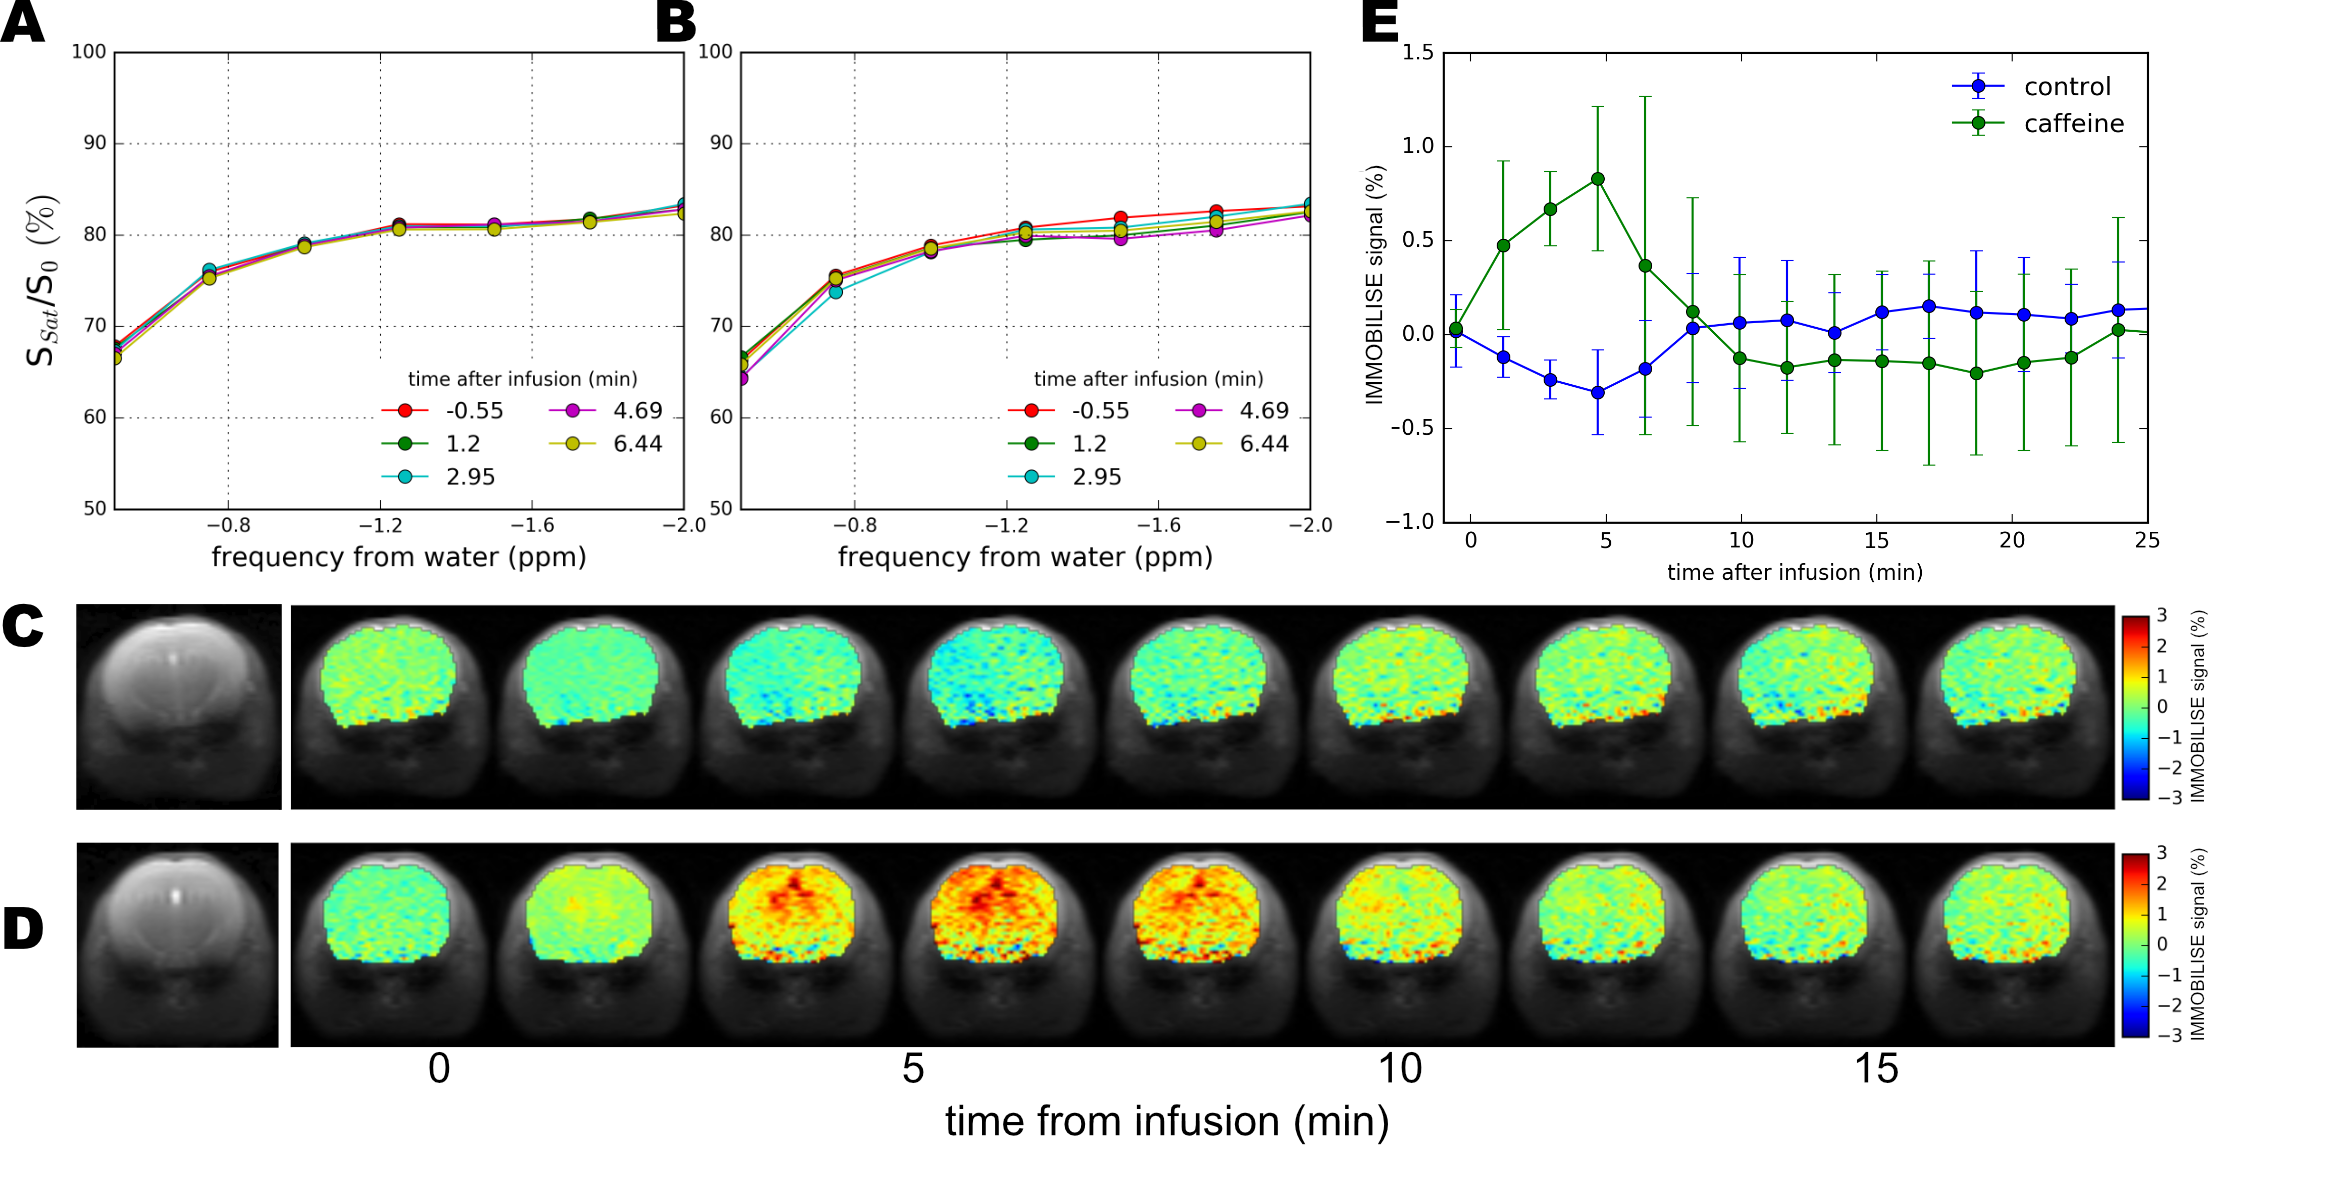
In Fig. 2 the IMMOBILISE method is applied to caffeine in protein solution, showing that MRI contrast is generated only when there is dynamic binding of RF-labeled caffeine to a rigid target. Fig. 2B shows Z-spectra for a solution of BSA without and with caffeine. The difference spectrum shows negligible signal at the caffeine frequencies. Strikingly, when the protein is cross-linked, signals corresponding to the caffeine resonances become visible in the water saturation difference spectrum (Fig 2C), with a linewidth corresponding to mobility in free solution and signal equivalent to a detection sensitivity of 11M caffeine, about 100x the concentration (sufficient to generate MR images (Fig 2D)). We tested the IMMOBILISE approach in vivo in mice using a PBS-solution of caffeine and PBS controls. Little variation was found for mice injected with just PBS (Figs. 3A,C) but noticeable changes were visible in the thalamus over the caffeine spectral region (Figs. 3B,D). Looking at the average signal change for all mice, the dynamic signal change persisted for about 10 minutes after infusion (Fig 3C). This time course excludes the possibility of the effect being due to perfusion, which typically shows contrast over much shorter time frames (< 1min11).Discussion
The IMMOBILISE approach exploits some principles inherent in CEST imaging, namely pool replenishment through exchange,12,13 but is inherently different as the contrast enhancement occurs in two steps, one of which does not involve exchangeable protons but molecular binding. The IMMOBILISE method can isolate the signal from substrates with high specificity, since the resonance frequency is observed at the substrate-specific proton frequency in the Z-spectrum (Fig 1D). This seems to be contradicted by the result of an increased signal throughout the brain in the caffeine distribution maps. However, this finding is in line with expectation, because caffeine passes freely through most biological membranes, including the blood-brain barrier.14 There are however brain regions with slightly higher signal (thalamus and cortex) which have elevated levels of the adenosine receptor A1 that caffeine is known to bind to.15,16Acknowledgements
We thank Drs Jiadi Xu, Hanwei Chen, and Huanling Liu for their technical assistance. This project was supported by NIH grant EB015032.References
1. Jenkins, B.G., Pharmacologic magnetic resonance imaging (phMRI): Imaging drug action in the brain. NeuroImage, 2012. 62(2): p. 1072-1085.
2. Rudin, M. and R. Weissleder, Molecular imaging in drug discovery and development. Nat Rev Drug Discov, 2003. 2(2): p. 123-131.
3. James, M.L. and S.S. Gambhir, A Molecular Imaging Primer: Modalities, Imaging Agents, and Applications. Physiological Reviews, 2012. 92(2): p. 897-965.
4. Hinton, D.P. and R.G. Bryant, 1H magnetic cross-relaxation between multiple solvent components and rotationally immobilized protein. Magnetic Resonance in Medicine, 1996. 35(4): p. 497-505.
5. Swanson, S.D., Protein mediated magnetic coupling between lactate and water protons. J Magn Reson, 1998. 135(1): p. 248-55.
6. Meyerhoff, D.J., Proton magnetization transfer of metabolites in human brain. Magnetic Resonance in Medicine, 1999. 42(3): p. 417-420.
7. Kruiskamp, M.J., et al., Magnetic coupling of creatine/phosphocreatine protons in rat skeletal muscle, as studied by 1H-magnetization transfer MRS. Magnetic Resonance in Medicine, 1999. 42(4): p. 665-672.
8. Leibfritz, D. and W. Dreher, Magnetization transfer MRS. NMR in Biomedicine, 2001. 14(2): p. 65-76.
9. Xu, X., et al., Dynamic glucose enhanced (DGE) MRI for combined imaging of blood-brain barrier break down and increased blood volume in brain cancer. Magn Reson Med, 2015. 74(6): p. 1556-63.
10. Kim, M., et al., Water saturation shift referencing (WASSR) for chemical exchange saturation transfer (CEST) experiments. Magnetic Resonance in Medicine, 2009. 61(6): p. 1441-1450.
11. Cha, S., et al., Dynamic, contrast-enhanced perfusion MRI in mouse gliomas: Correlation with histopathology. Magnetic Resonance in Medicine, 2003. 49(5): p. 848-855.
12. van Zijl, P.C.M. and N.N. Yadav, Chemical exchange saturation transfer (CEST): what is in a name and what isn't? Magnetic Resonance in Medicine, 2011. 65(4): p. 927-948.
13. Ward, K.M., A.H. Aletras, and R.S. Balaban, A new class of contrast agents for MRI based on proton chemical exchange dependent saturation transfer (CEST). Journal of Magnetic Resonance, 2000. 143(1): p. 79-87.
14. McCall, A.L., W.R. Millington, and R.J. Wurtman, Blood-brain barrier transport of caffeine: Dose-related restriction of adenine transport. Life Sciences, 1982. 31(24): p. 2709-2715.
15. Goodman, R.R. and S.H. Snyder, Autoradiographic Localization of Adenosine Receptors in Rat-Brain Using [H-3]Cyclohexyladenosine. Journal of Neuroscience, 1982. 2(9): p. 1230-1241.
16. Fredholm, B.B., et al., Actions of caffeine in the brain with special reference to factors that contribute to its widespread use. Pharmacol Rev, 1999. 51(1): p. 83-133.
Figures