3567
Detection of Acetaminophen-Induced Liver Damage using Contrast-Enhanced Dynamic MRI and T1 Maps1Radiology, Michigan State University, East Lansing, MI, United States
Synopsis
We are developing an MRI method to measure acetaminophen toxicity in the liver. We obtained dynamic T1 weighted images of the liver and T1 maps using the clinically approved contrast agent gadoxetate disodium (Eovist). After acetaminophen overdose, the uptake of contrast was decreased in the liver and increased in the kidney. T1 and variation in T1 were higher after acetaminophen. T1 was correlated with ALT, a serum measure of liver damage. This is a promising method for quantifying drug induced liver damage in vivo.
Introduction
Acaetaminophen (APAP) overdose is the leading cause of acute drug-induced liver damage in Europe and North America1. Liver damage due to acetaminophen toxicity has been measured using blood tests for the release of liver enzymes such as alanine aminotransferase (ALT), ability to clear the dye indocyanide green2, and through anatomical MRI3 and T1 mapping4. MRI approaches have the advantage of evaluating liver function and damage on a regional basis, and T1 mapping offers the ability to quantify contrast agent uptake, and therefore, hepatocyte function. We are using gadoxetate disodium, which is a hepatocyte-specific contrast agent5. We previously reported a method to acquire T1 maps in mice while contrast was being infused into the mouse, to maintain a steady contrast agent concentration6. Here, we applied that method in a larger set of mice to measure T1 and variation in T1, measured dynamic uptake of the contrast agent to quantify liver damage from APAP overdose, and compared them to blood chemistry indicators of liver damage and histology.Methods
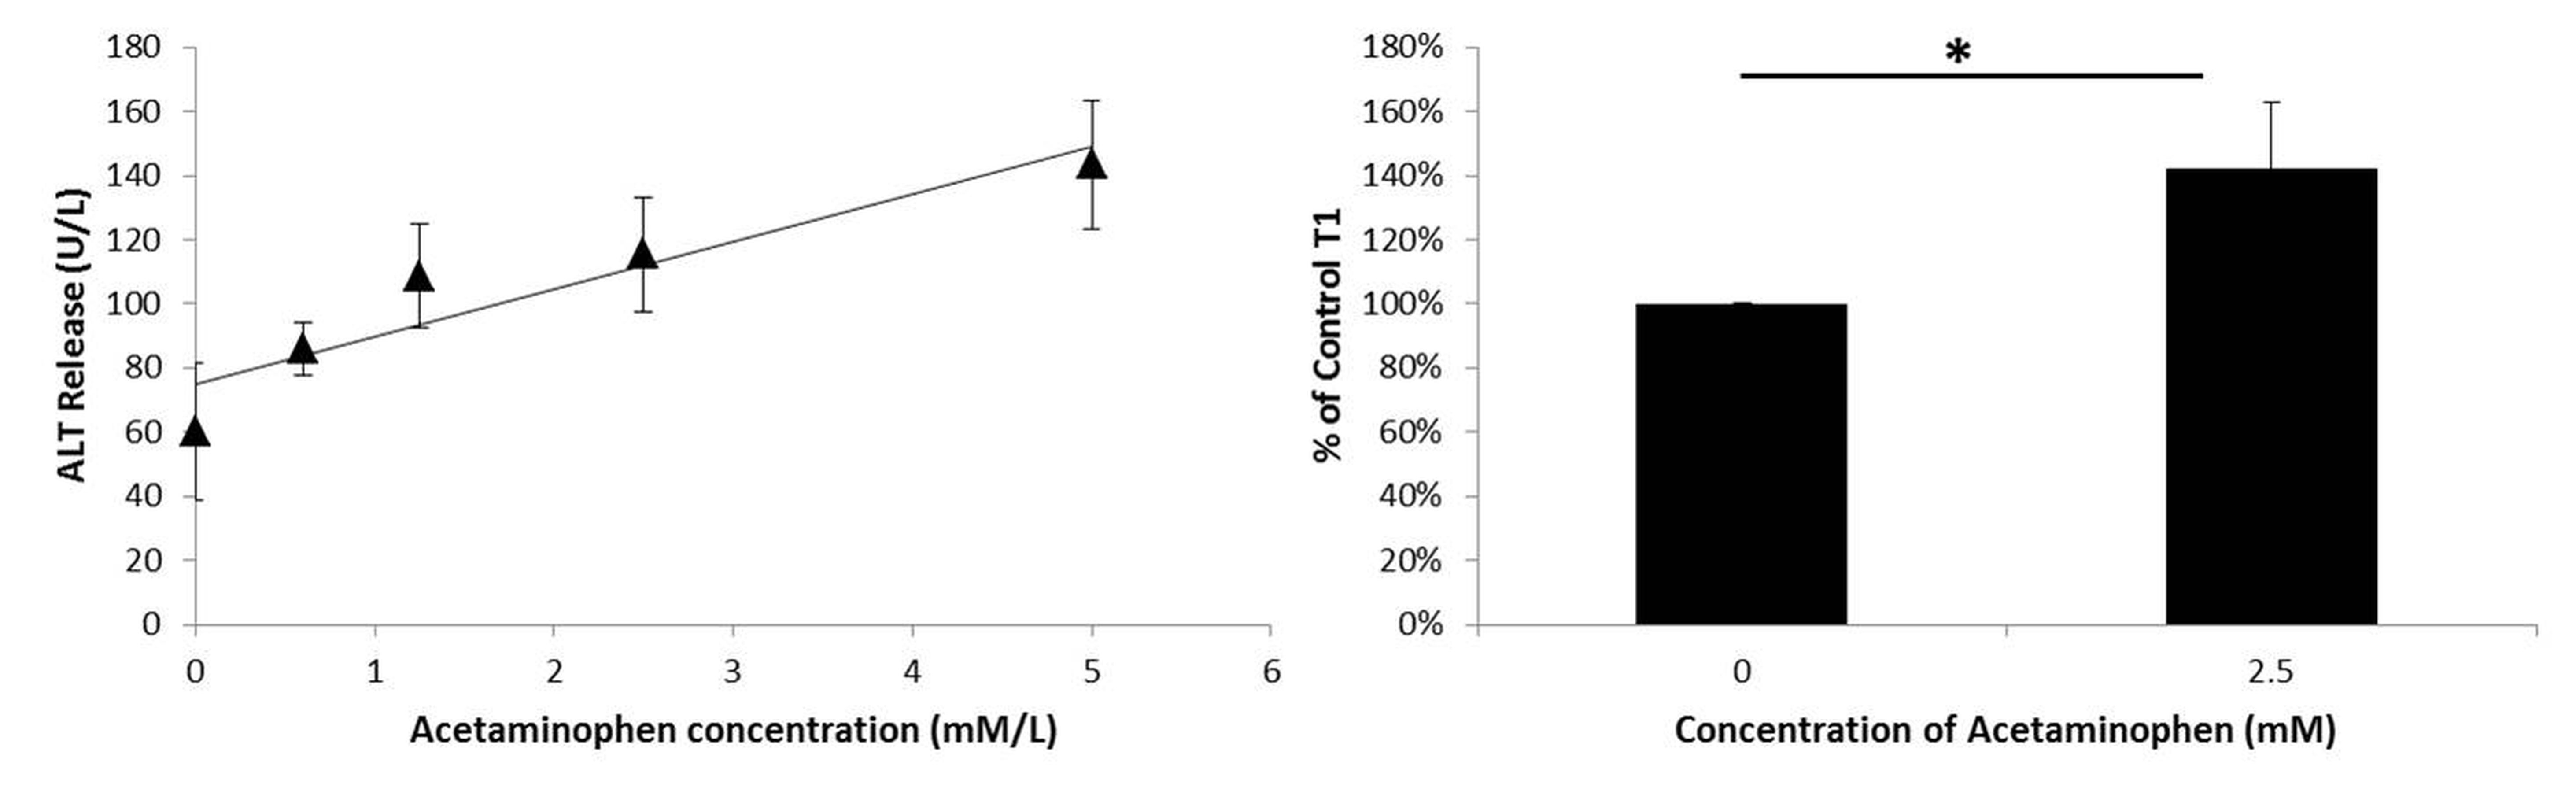
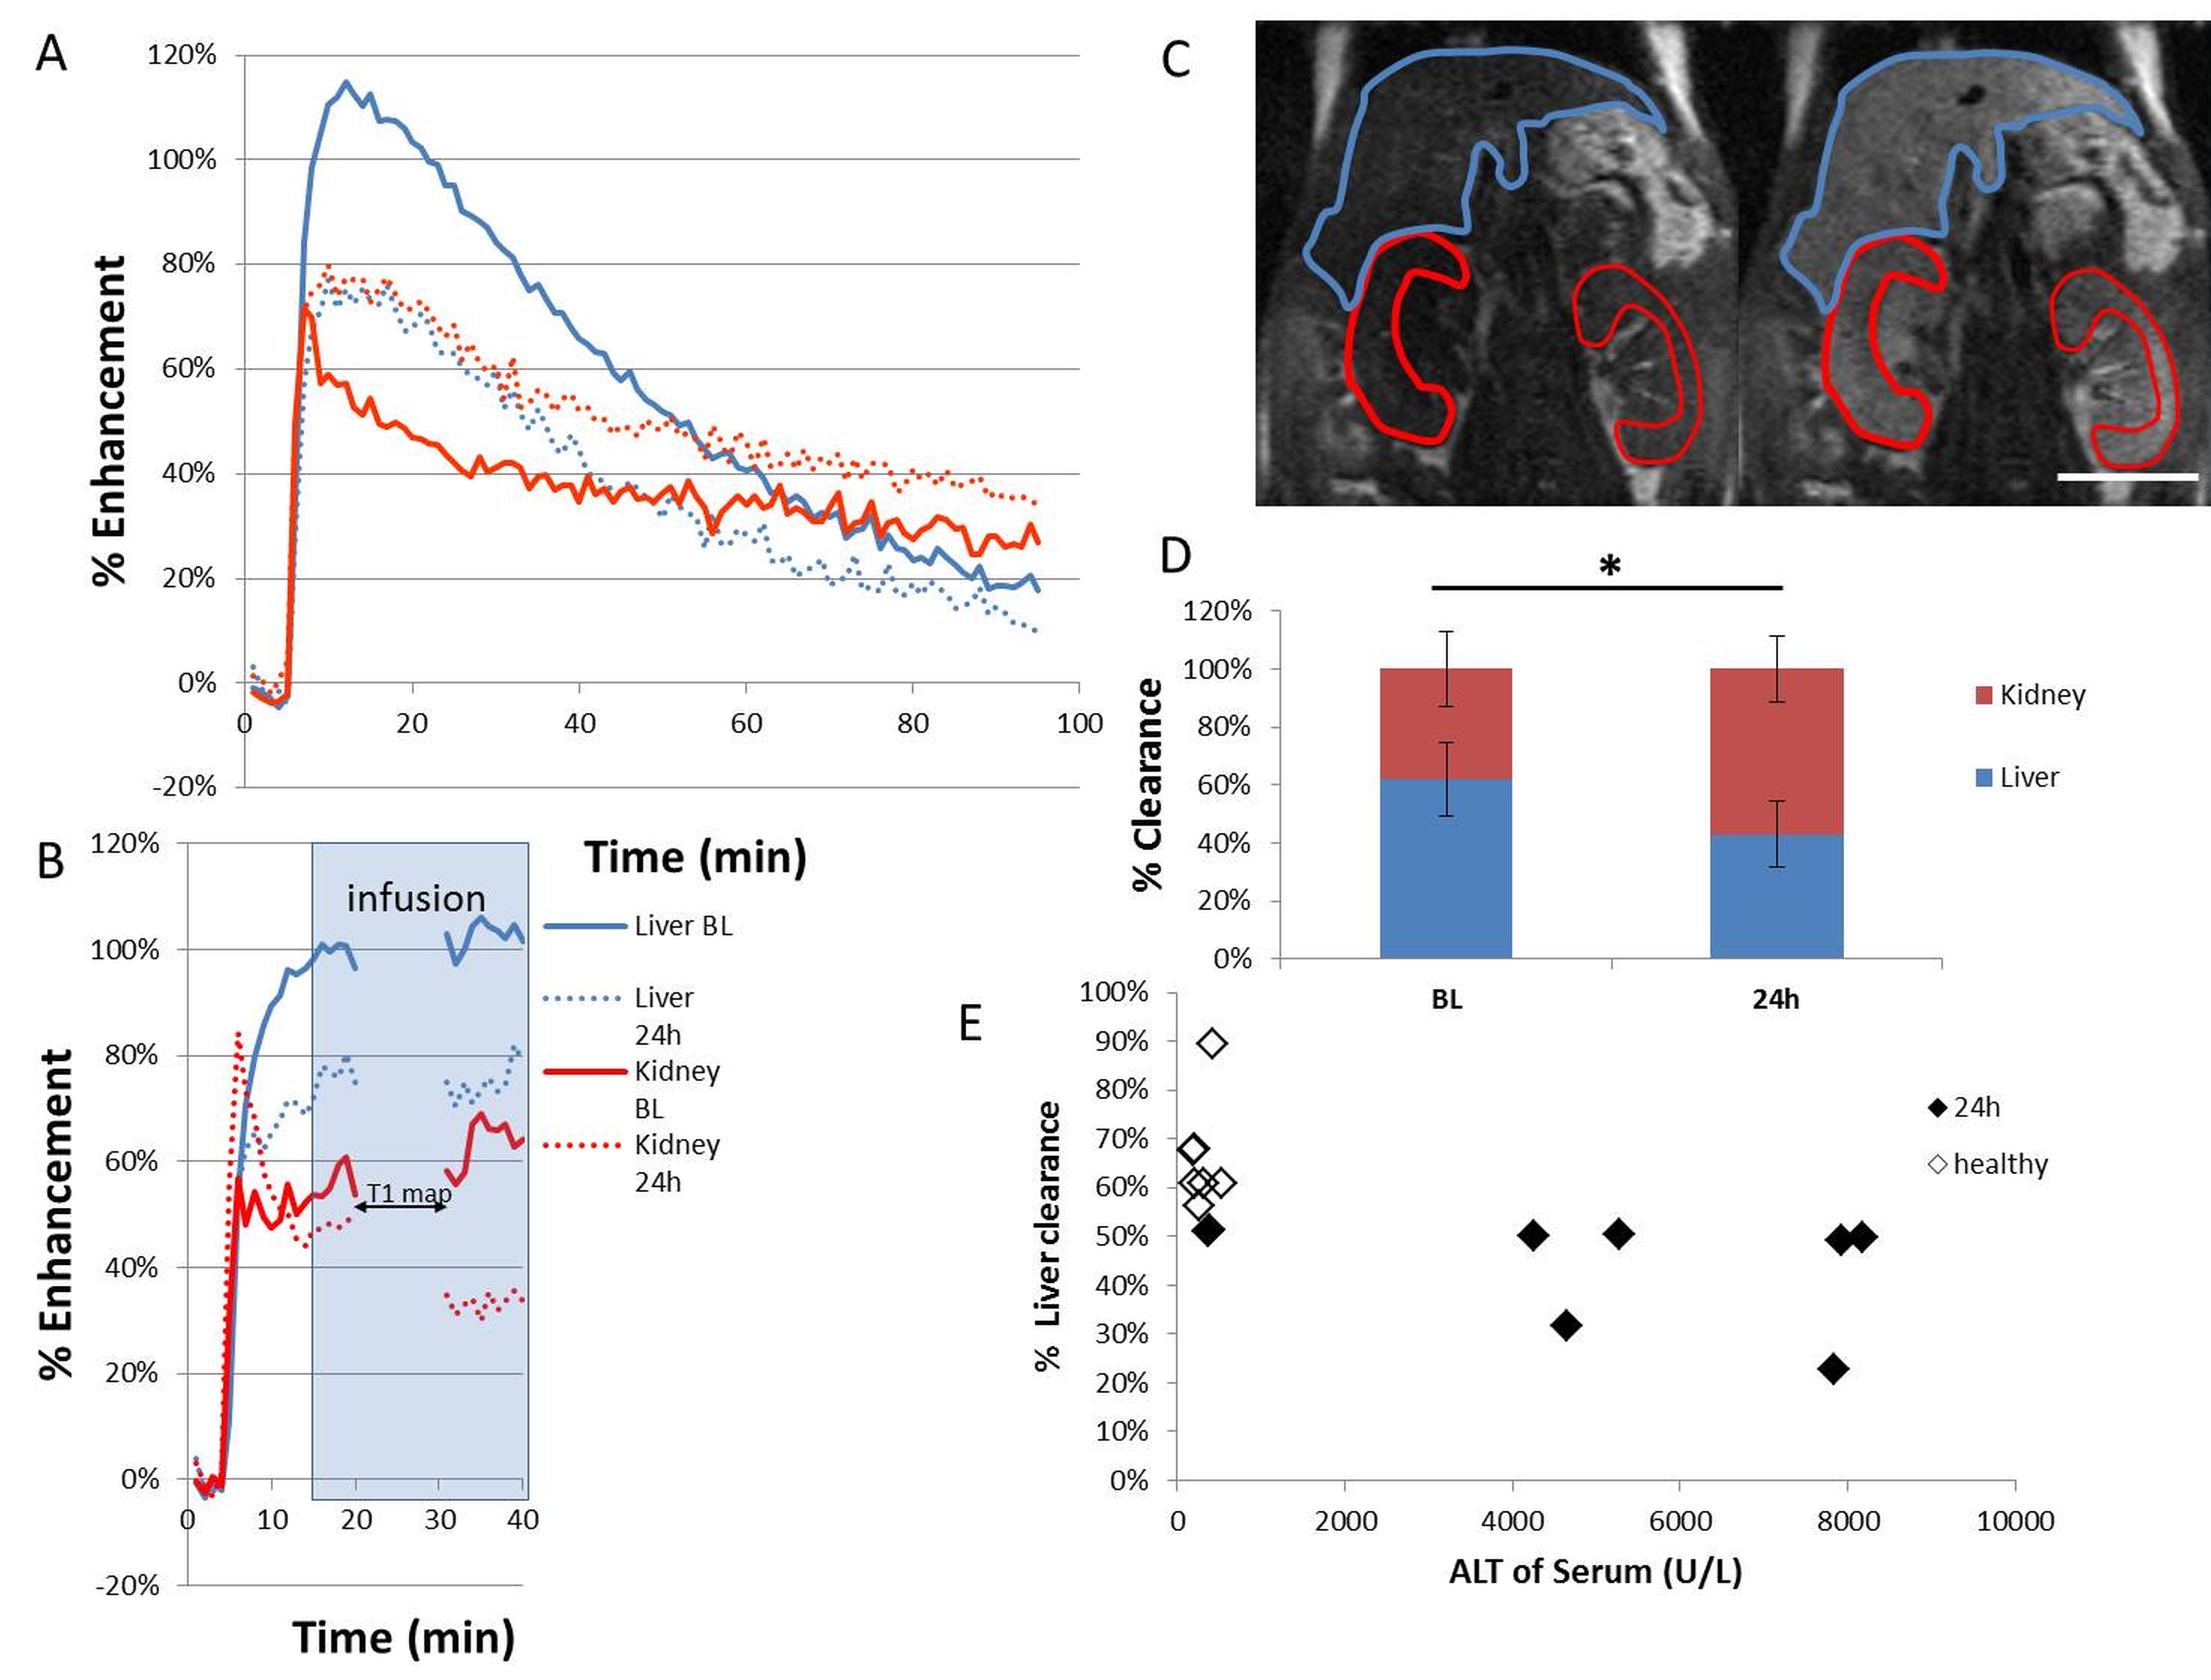
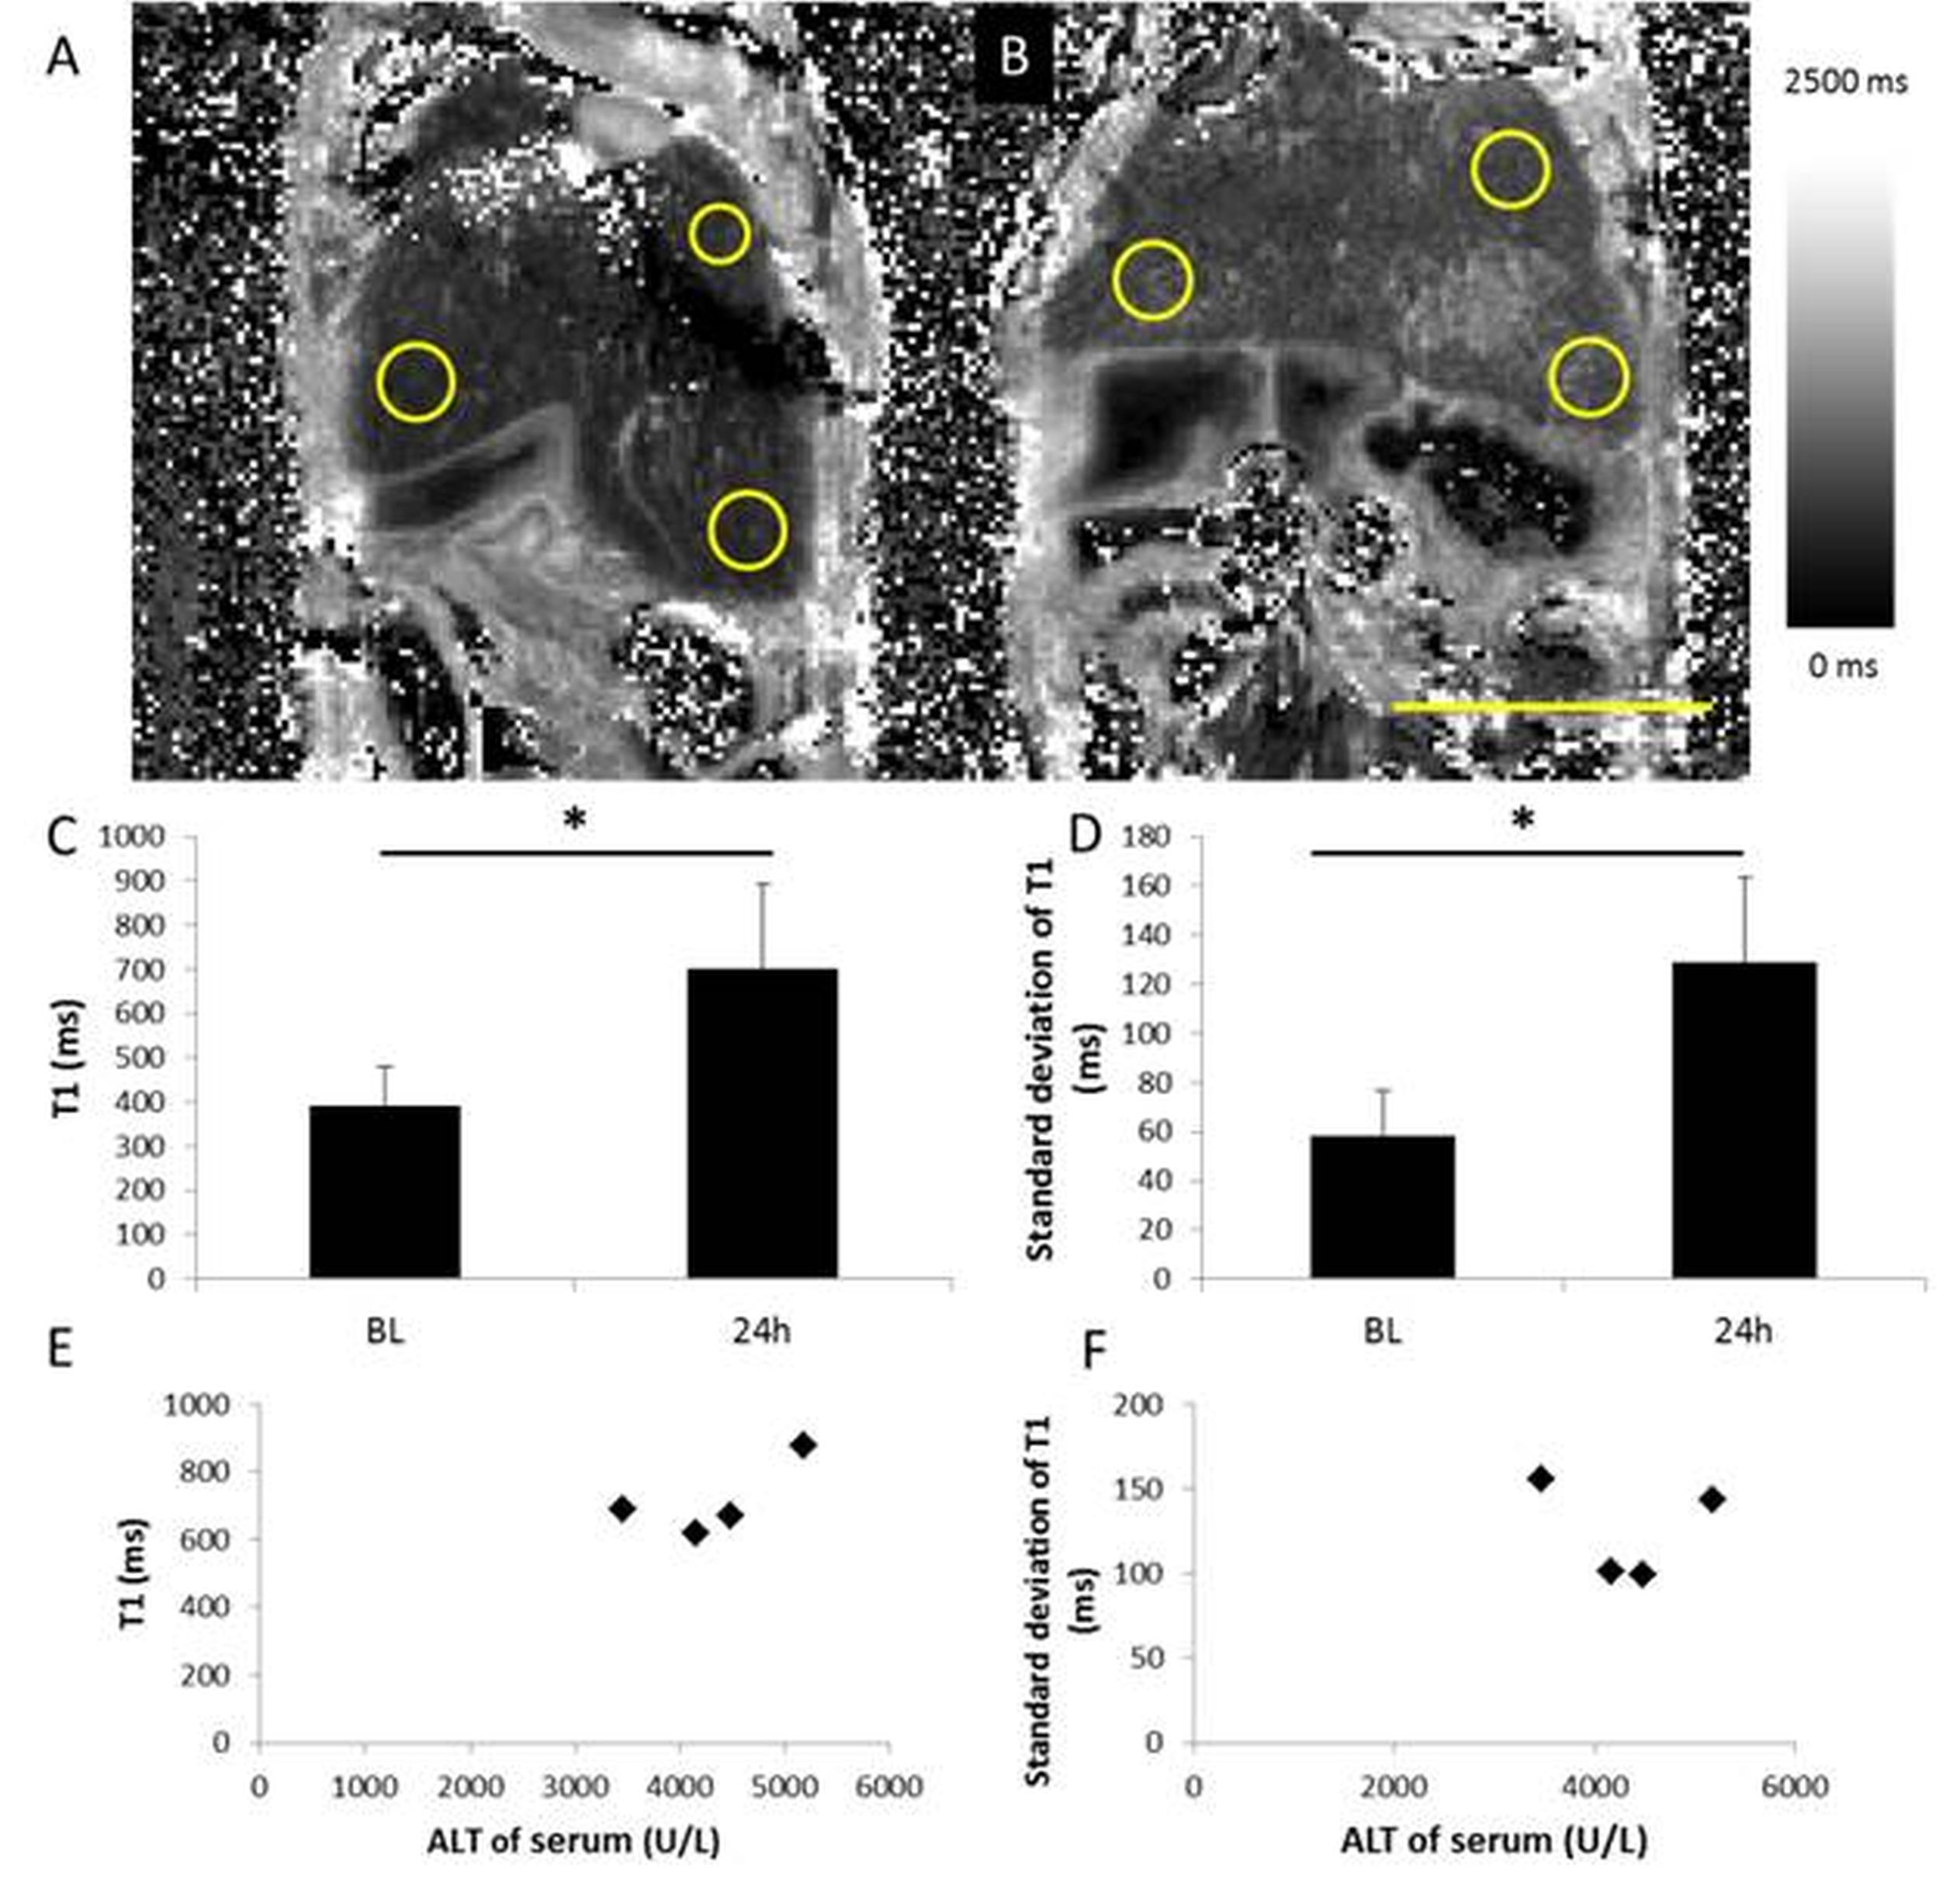
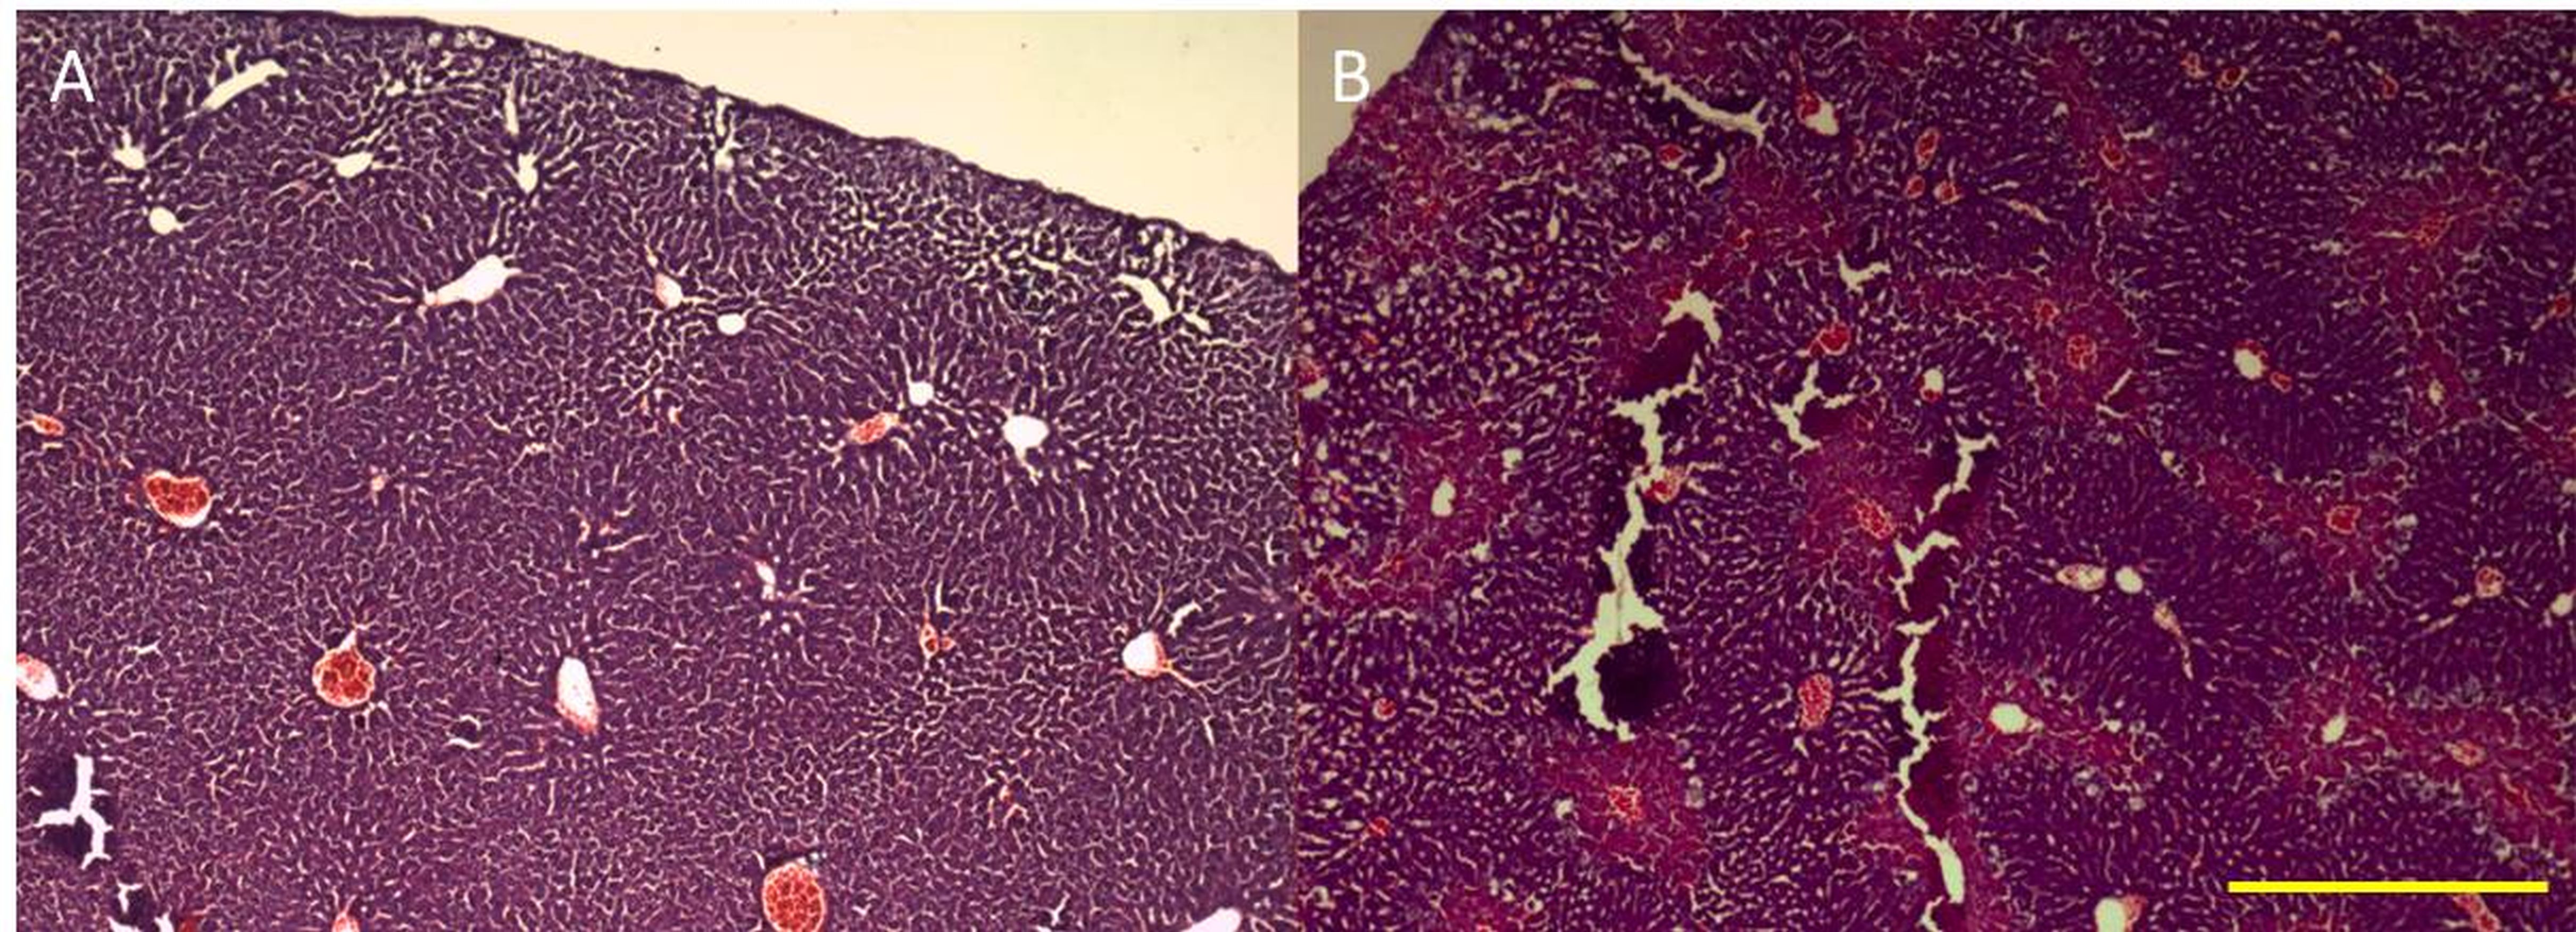
Hepatocytes were harvested from healthy mice and treated overnight with APAP, then ALT release was measured. Cells were incubated with contrast agent for 2 hours then the T1 of cell pellets was measured. Mice (8-12 week old C57Bl/6) were scanned at baseline and 24 h after being treated with 300 mg/kg APAP IP. Serum ALT was measured. RAREst images were acquired every minute after 0.025 mmol/kg gadoxetate disodium was administered IV (n=8). The area under the curve for liver and kidney were calculated. T1 maps (n=9) were acquired using a TrueFISP sequence following injection of a bolus of contrast followed by an infusion at 0.81 µmol/h (n=9). The T1 and standard deviation of T1 (T1SD) was calculated in 3 ROIs for each liver. Livers were cryosectioned and stained with H&E. All images were acquired on a Bruker 7T.Results
ALT release of primary hepatocytes increased with APAP dose. The T1 of control cells was lower than the T1 of cells treated with 2.5 mM APAP when cell pellets were imaged. In vivo, liver uptake of gadoxetate disodium decreased after treatment with APAP and kidney clearance increased. ALT was significantly higher after APAP administration (320 +/- 120 U/L vs 5500+/- 3000). Liver uptake of contrast decreased after acetaminophen administration, as seen by the relative height of the enhancement peaks and the % clearance through each organ. Fraction of liver clearance was not correlated with ALT. Liver enhancement was stable during T1 map acquisition (mean change over the map acquisition was 6% in healthy mice and 9% in acetaminophen treated mice). One mouse with 30% drop in enhancement was excluded from analysis. T1 was significantly lower in control livers than in APAP treated livers. T1SD was significantly higher in treated livers. In a subset of mice that had serum collected, T1 was correlated with serum ALT. T1SD was not. Mouse livers damaged with acetaminophen had a mottled appearance in H&E stains.Conclusions
We have demonstrated that the effects of hepatocyte toxicity from acetaminophen are detectable using ex vivo and in vivo MRI. Cell pellets treated with APAP had higher T1 than healthy cells. In vivo, liver damage from acetaminophen overdose was detected using dynamic MRI, T1 maps and the variability in T1 maps. The ratio of uptake between the liver and kidneys changed with liver damage. This reflects the lower uptake of gadoxetate disodium by damaged hepatocytes in vivo and in vitro. T1 was correlated with a serum measure of liver damage, ALT. T1SD was measured because the liver damage due to acetaminophen results in a mottled pattern of necrosis, but T1SD was not correlated with ALT in this small sample. More investigation in a larger sample size is needed. These MRI biomarkers of liver damage could be translated to other models of disease, with the aim of using contrast-enhanced MRI to detect regional liver disease severity and response to treatment.Acknowledgements
We thank Holly Cline-Fedewa, Kevin Baker and Jim Luyendyk,
MSU Department of Pathobiology and Diagnostic Investigation, for assistance
with harvesting hepatocytes and measuring ALT.
References
1 Jaeschke, H., Xie, Y., and McGill, M.R. (2014). Acetaminophen-induced Liver Injury: from Animal Models to Humans. Journal of Clinical and Translational Hepatology 2, 153–161.
2 Brown, A.T., Ou, X., James, L.P., Jambhekar, K., Pandey, T., McCullough, S., Chaudhuri, S., and Borrelli, M.J. (2012). Correlation of MRI findings to histology of acetaminophen toxicity in the mouse. Magnetic Resonance Imaging 30, 283–289.
3 Feng, H.-L., Li, Q., Wang, L., Yuan, G.-Y., and Cao, W.-K. (2014). Indocyanine green clearance test combined with MELD score in predicting the short-term prognosis of patients with acute liver failure. Hepatobiliary & Pancreatic Diseases International 13, 271–275.
4 Katsube, T., Okada, M., Kumano, S., Hori, M., Imaoka, I., Ishii, K., Kudo, M., Kitagaki, H., and Murakami, T. (2011). Estimation of liver function using T1 mapping on Gd-EOB-DTPA-enhanced magnetic resonance imaging. Invest Radiol 46, 277–283.
5 Van Beers, B.E., Pastor, C.M., and Hussain, H.K. (2012). Primovist, Eovist: what to expect? Journal of Hepatology 57, 421–429.
6 Mallett, C.L., Latourette, M.L., Kopec A., Luyendyk J. Shapiro, E.M. (2016) MRI Evaluation of Acetaminophen-Induced Liver Failure in Mice using T1 Mapping and Stable Gadoxetate Disodium Administration, eposter presented at ISMRM annual meeting, Singapore, May 7-13.
Figures