3564
Evaluation of Portal Vein System Hemodynamics with Magnetic Resonance Angiographic Inflow-Sensitive Inversion Recovery1Department of Radiology, Tongji Hospital, Tongji Medical College, Huazhong University of Science and Technology, Wuhan, People's Republic of China
Synopsis
To evaluate the ability of magnetic resonance angiographic inflow-sensitive inversion recovery (IFIR-MRA) to assess hemodynamics of portal vein system in patients with portal hypertension, we compared visualized portal vein branching grade scores at different blood suppression inversion time (BSP TI) settings and signal intensity contrast ratio of the vessles and the liver parenchyma with color Doppler ultrasonograghy (CDUS) measured hemodynamics. Statistically significantly correlation demonstrated that IFIR-MRA of portal vein system has the potential to suggest hemodynamic changes, especially for RPV.
Introduction
Non-enhanced magnetic resonance angiography (NCE-MRA) with a spatial labeling inflow inversion pulse has been demonstrated to enabled high-quality visualization of portal vein at appropriate blood suppression inversion time (BSP TI) settings without an exogenous contrast agent. But the sequece was performed on healthy subjects only for morphological diagnosis without hemodynamic information.[1] We have found that at patients with portal hypertension(PH) which may lead to slower blood velocity of portal vein system, lower branching grade of portal vein was depicted. The prognostic significance of portal pressure measurement has been highlighted for survival and bleeding in cirrohotic patients.[2] The purpose of our study is to evaluate the ability of magnetic resonance angiographic inflow-sensitive inversion recovery (IFIR-MRA) to assess hemodynamics of portal vein system in patients with portal hypertension by comparision with color Doppler ultrasonograghy (CDUS).Methods
IFIR-MRA was performed on 25 patients with PH using a selective inversion recovery pulse band placed perpendicular to portal vein at hepatic hilar region with four different BSP TI settings: 600ms, 900 ms, 1200 ms and 1500ms.[Figure1] All of the patients were then examed with CDUS within one day to measure the hemodynamics of main portal vein (MPV), left portal vein (LPV) as well as right portal vein (RPV). Hemodynamic parameters of CDUS include peak velocity (Vmax) and diameter (D) which were directly measured as well as blood flow area(A) calculated from diameter and blood flow volume (Q) calculated from the follwing equation : Q=0.57Vmax×1/4πD2=0.57Vmax×A. The ability to visualize branches of LPV and RPV was scored respectively depending on the largest visualized branching grade, ranging from 0 to 5(0, the trunk of LPV or RPV not visible; 1, only trunk of LPV or RPV visible; 2, both trunk and first-order branches of LPV or RPV visible; 3, trunk, first and second-order branches of LPV or RPV visible; 4, trunk, first, second and third-order branches of LPV or RPV visible; 5, trunk, first, second, third, and forth-order branches of LPV or RPV visible). The higher score within LPV and RPV branching grade was recorded as Smax for each subject. The sum score of LPV and RPV branching grade was recorded as Ssum, excluding 2 subjects with RPV embolization and 1 with LPV connected to the opened umbilical vein. The Sm and Ss were respectively analyzed with hemodynamic parameters of CDUS using the Spearman rank correlation coefficient (rs). On the original images of IFIR-MRA series, regions of interest (ROIs) were placed manually in the MPV, LPV, RPV, and a homogenous portion of the liver parenchyma drawn close to the portal vein as large as possible. The signal intensity contrast ratio (Cv/l) of the vessles and the liver parenchyma was calculated and respectively analyzed with hemodynamic parameters of CDUS using the Pearson correlation coefficient (rp). A p value less than 0.05 was considered statistically significant.Results
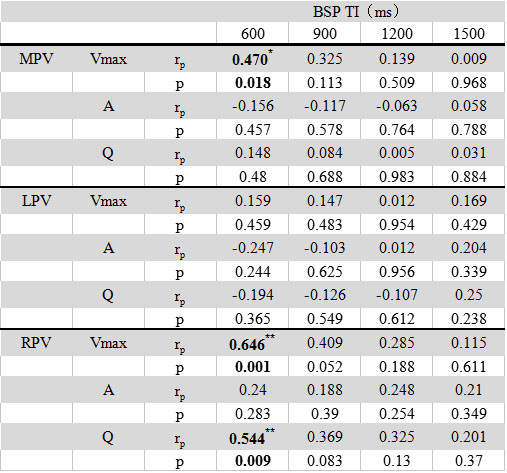
Spearman rank correlation analysis of portal vein system branching grade and CDUS hemodynamics revealed that for RPV, both Vmax and Q were of significant correlation with branching grade scores at BSP TI settings of 600ms, 900ms, 1200ms and 1500ms. For MPV, only Vmax was in concordance with Ssum and Smax at BSP TI settings of 600ms and 900ms. For LPV, Vmax was correlated with Ssum only at BSP TI settings of 600ms and 1200ms, while correlated with both Ssum and Smax at a BSP TI of 1500ms.[Table1] Pearson correlation analysis of vessles-to-liver signal intensity contrast ratio and hemodynamic parameters revealed statistically significantly correlation only for Vmax of LPV and RPV, as well as Q of RPV with Cv/l at a BSP TI setting of 600ms.[Table2]Discussion
For lesions like PH, hemodynamic changes precede morphological changes. Our study demonstrated that measurements of branching grade visualization in IFIR-MRA of portal vein system could be a prompt of hemodynamic changes, especially for RPV, which has been recognized to be more susceptible to liver lesions.[Figure2] Contrast ratio of vessels to liver parenchyma at a relatively low BSP TI setting may have the potential for velocity information prompting, which remains to be further studied. IFIR-MRA could be peformed as a ‘‘one-stop-shop’’ approach for both morphological depiction and functional evaluation. A major limitation of our study is that in order to keep all the in-flow signal of portal vein, we gave up a lower-abdomen-placed inversion pulse which can avoid signal interference of inferior vena cava and simultaneousely suppress part of blood flow signal of superior mesenteric vein so that our images are inevitably with signal interference of inferior vena cava.Acknowledgements
No acknowledgement found.References
Figures
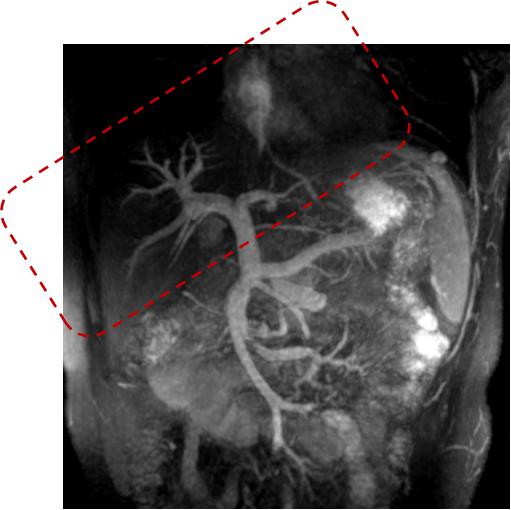
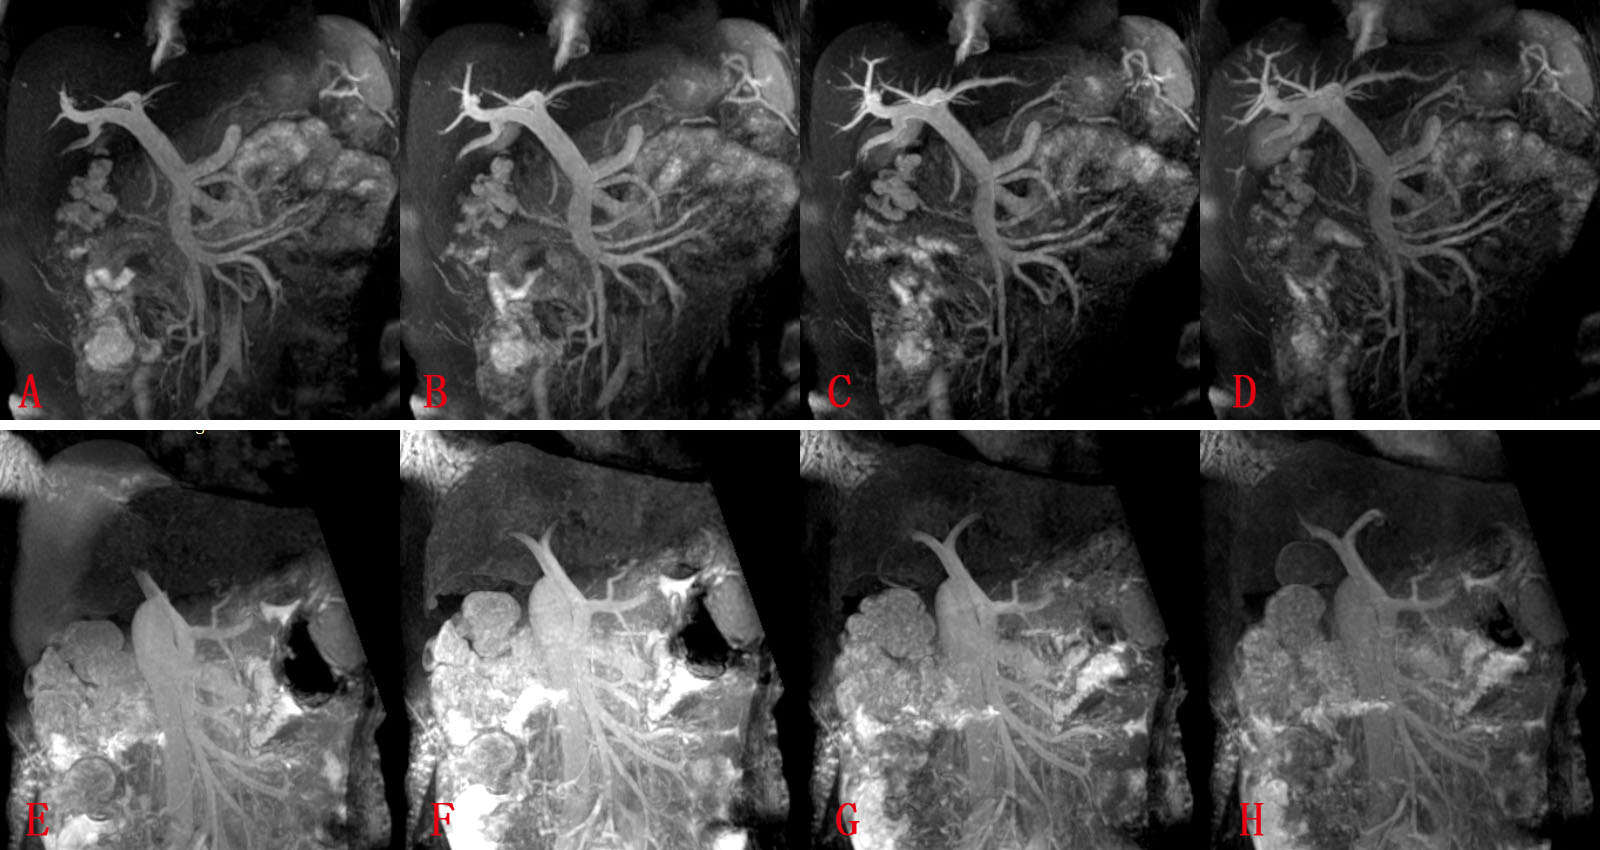
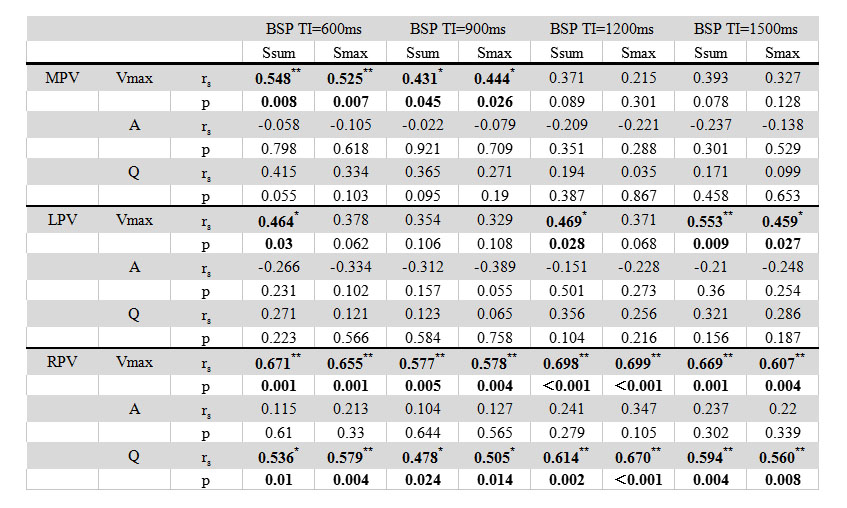
Table1: Spearman rank correlation analysis of portal vein system visible branching grade and CDUS hemodynamics.
* Significantly correlated at 0.05 level (both sides).
** Significantly correlated at 0.01 level (both sides).