3560
Assessment of Hepatic Iron Content by an Automatic Vessel Exclusion Technique in Patients with Iron Overload1Diagnostic Imaging, St. Jude Children's Research Hospital, Memphis, TN, United States, 2Hematology, St. Jude Children's Research Hospital, Memphis, TN, United States
Synopsis
Extraction of liver parenchyma is an important step in the evaluation of R2*-based hepatic iron content. Traditionally this is performed by radiologists via thresholding, an iterative, time consuming process susceptible to interrater variability. Here, a new method based on Frangi vesselness filtering is presented that automatically removes hepatic vessels from liver tissue, thereby reducing potential bias and improving workflow. The method was evaluated in digital liver phantoms and 42 iron overloaded patients. Excellent agreement between manual and automated liver parenchyma segmentation was found which demonstrates accuracy and robustness of the proposed method.
Introduction
Quantification of hepatic iron content (HIC) using R2*-MRI is an alternative to liver biopsy. R2* is quantified by modeling the liver signal decay in multi gradient echo (mGRE) images and R2*-based HIC is estimated using R2*-biopsy calibration curves.1-3 R2*-based HIC estimation involves a two step segmentation process: (1) trace the liver border within the designated slice to maximize ROI area and thereby minimize inter-reviewer variability associated with ROI placement,2 and (2) manually exclude blood vessels via T2*(=1/R2*) thresholding.4,5 Thresholding relies on higher T2* values in blood compared to liver tissue; it is an iterative, time consuming process susceptible to interrater variability. To eliminate this subjectivity that may impact R2*/HIC accuracy and to optimize workflow, we implemented an automatic parenchyma extraction technique based on the Frangi vesselness filter6 and evaluated the method in digital liver phantoms and 42 iron overloaded patients.Materials & Methods
Digital phantoms were created to determine optimal Frangi filter parameters and evaluate efficiency of parenchyma extraction over a range of R2* values and SNRs. A digital liver mask was created by segmenting the parenchyma and vessels from a representative patient. Reference R2* maps were generated by assigning R2* values from 50 to 1000s-1 (in 50s-1 increments) to liver parenchyma, and 33s-1 to vessels. Magnitude images were then created at 20 echo times (TE1/ΔTE=1.07/0.86ms) applying equation S(TE) =S0e-R2*xTE. Partial volume effects (PVE) were added by convolving images with a 3x3 Gaussian kernel. Finally, images were simulated under different SNR conditions by adding complex Gaussian noise. In-vivo data were collected retrospectively with IRB approval, from 42 patients (mean age, 24±11 years) who underwent 1.5T MRI scans using breath-hold 2D mGRE (TR/TE1/ΔTE=200/1.07/0.86ms, 20 echoes, 35°, FOV 280-400mm, matrix 128x104, SL 10mm) for clinical monitoring of HIC.
Quantitative T2*/R2* maps were calculated for phantom and patient data, using non-linear least-squares fitting in MATLAB.7, 8 A Frangi vesselness filter was applied to three different image inputs: composite image, T2* map, and R2* map. The composite image was the average of the three consecutive images with highest contrast between vessel and parenchyma.9 For different ranges of R2* values, the first 3 echo times that produced the highest contrast in phantoms were recorded and used in the patient study. The filter has a boolean parameter to detect either bright vessels on dark background (image-based, T2*-based), or vice-versa (R2*-based). The filter result is a probability map of the pixels being vessels; vessel and parenchyma masks were extracted by applying a probability threshold of 0.05 of maximum vesselness response. The optimal filter parameters (σ, spatial scale; β and c to suppress blob-like structures and background noise, respectively) were determined from the simulations by comparing segmented masks and ground truth using dice similarity coefficient (DSC).9 In addition, the relative error in R2* between filter output and ground truth was calculated. In our patient cohort, segmentation and R2* results obtained using the automated Frangi-filter technique were compared to reference values recorded by a radiologist via T2* thresholding.2
Results & Discussion
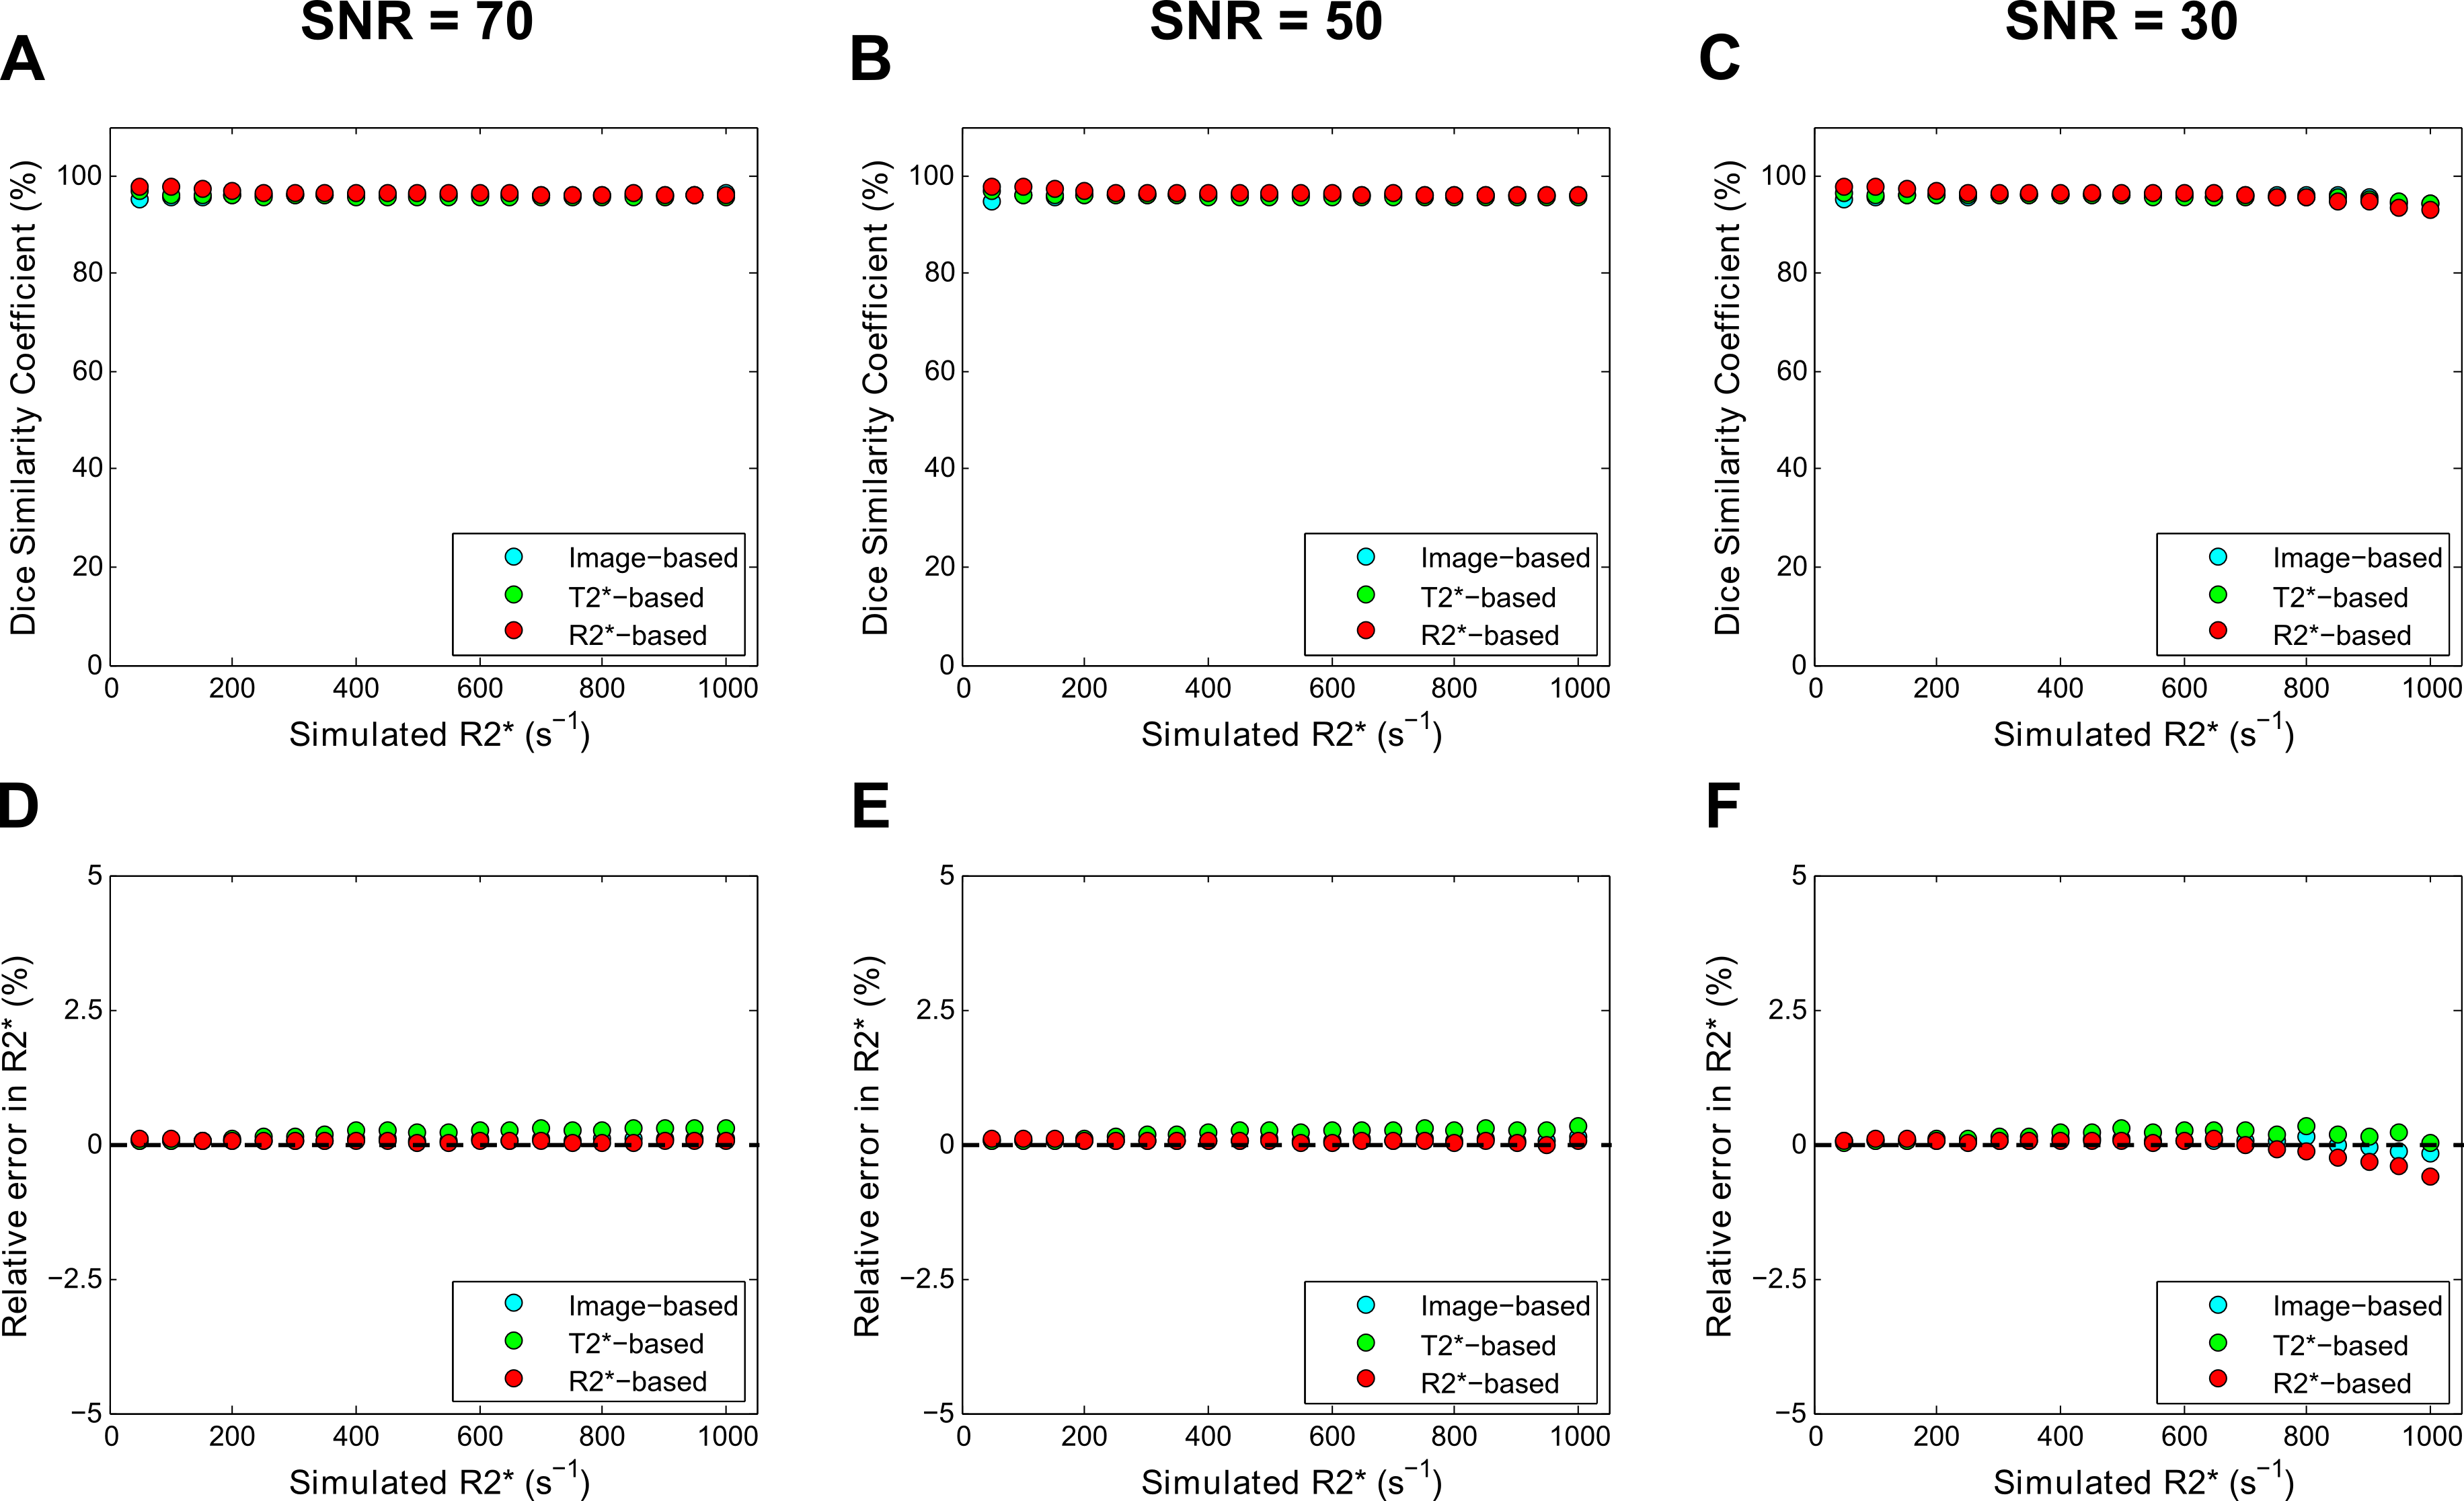
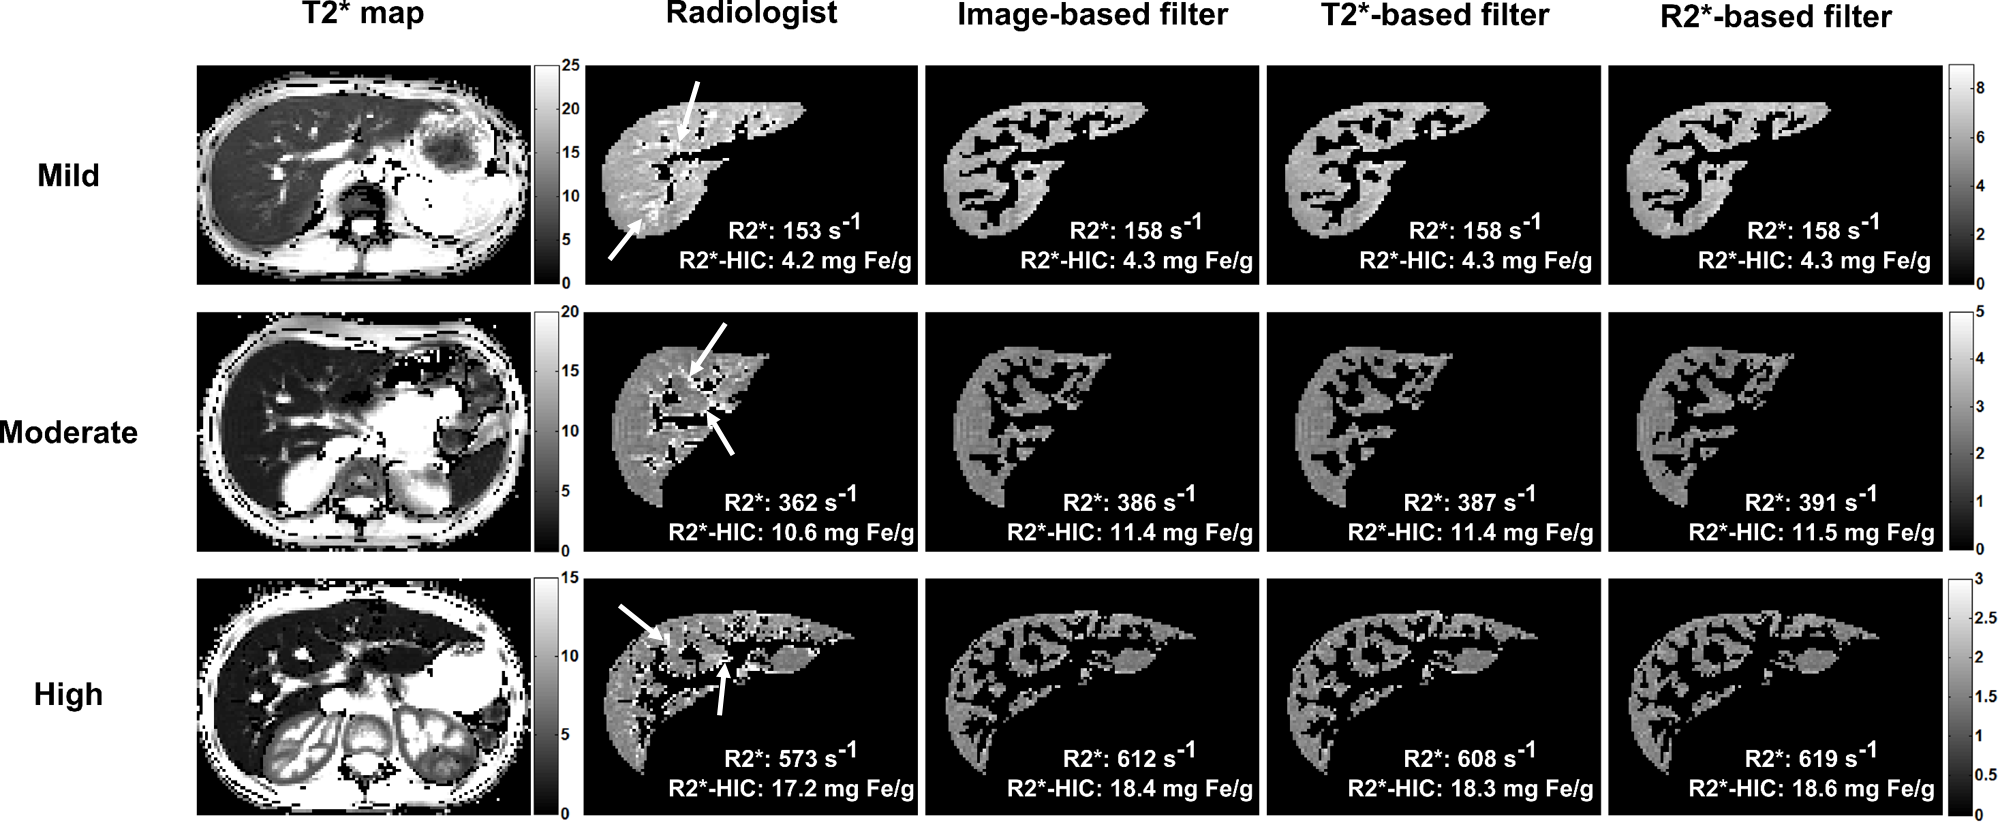
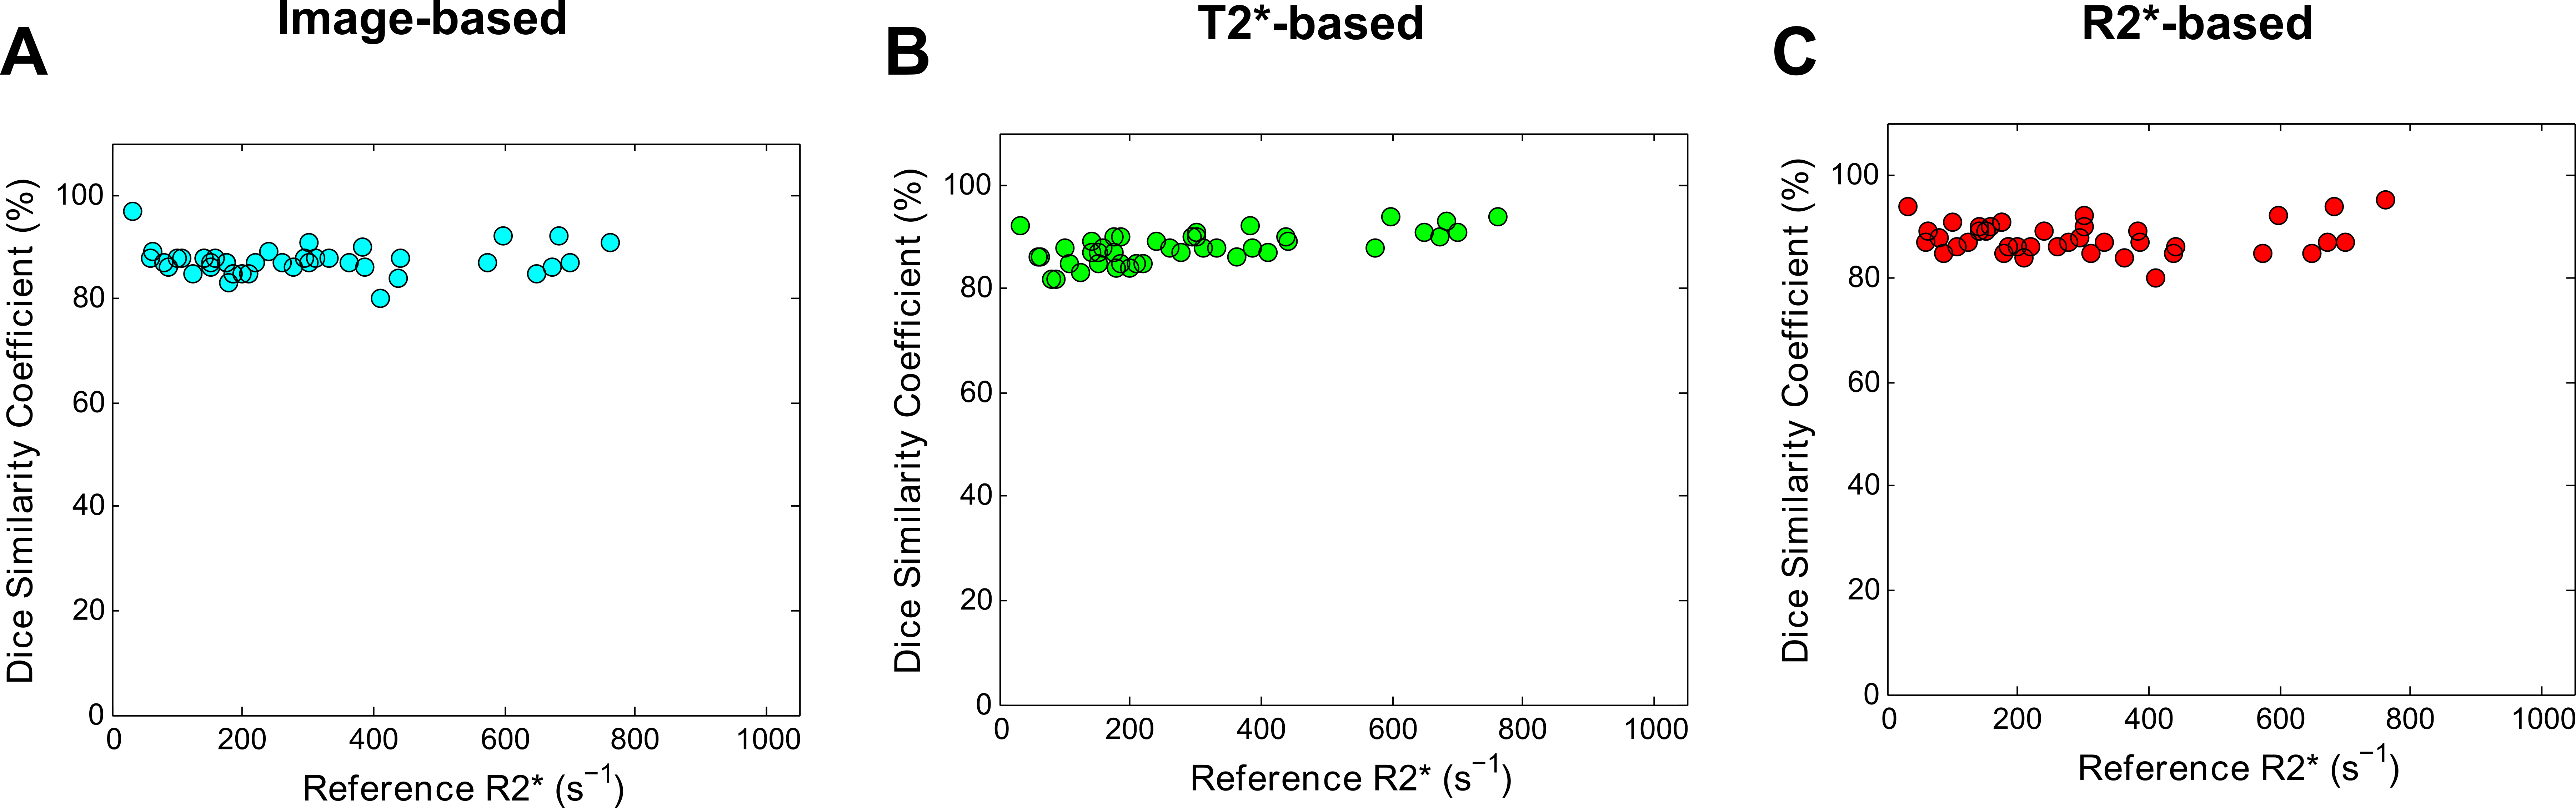
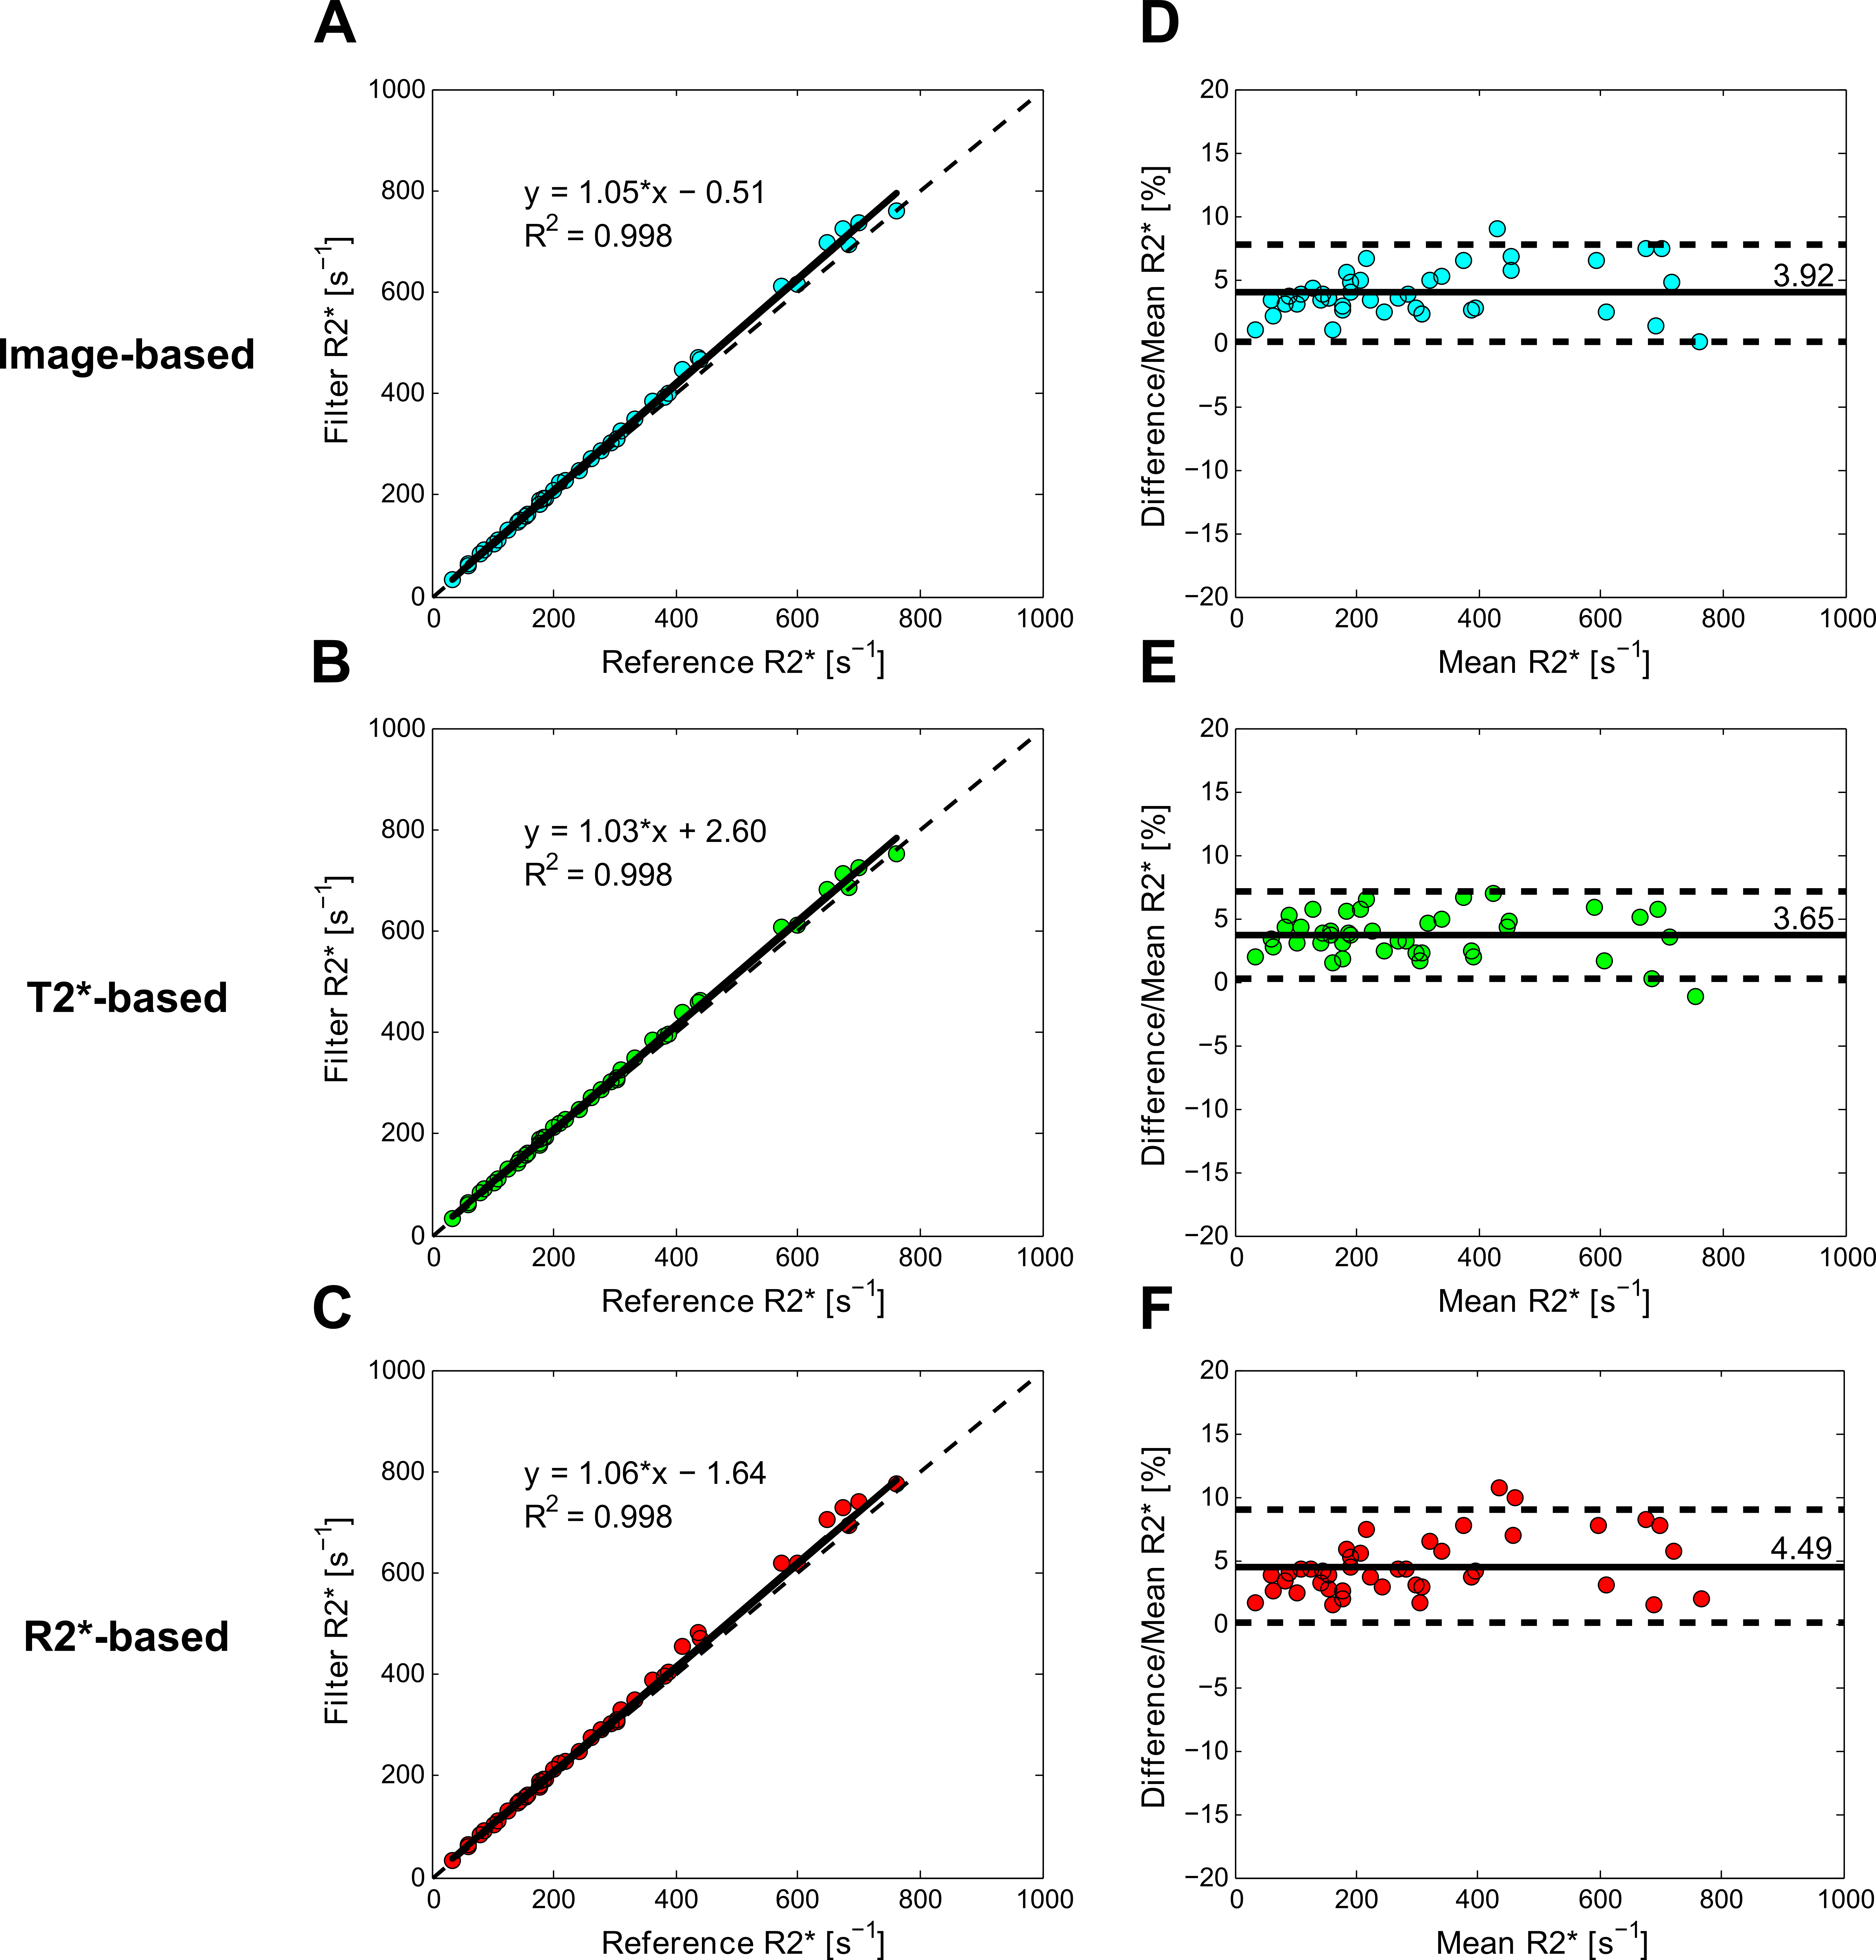
The digital phantom study demonstrated the following optimal filter parameters: σ=1–2.5 mm, β=0.5, c=15% (image-based, T2*-based) or 10% (R2*-based) of median signal. An excellent DSC for segmentation results and relative-errors <1% in R2* measurements was found in phantoms across R2* values and SNR levels (fig. 1). Figure 2 shows manual and Frangi-based automated parenchyma segmentation in patients with mild, moderate, and high HIC, respectively. Manual and automated parenchymal areas overlaped on average ~88% among all patients (fig. 3). The small deviation is likely because the radiologist unintentionally included small vessels and pixels affected by PVE (fig. 2, white arrows). Mean liver R2* values estimated from all three filter-based methods showed excellent agreement with the manual reference method (slope 1.03-1.06, figs. 4A-C) with a small positive bias (<4.5%) on Bland-Altman plots (figs.4D-F), likely because more small vessels were excluded. Our results demonstrate that all filter-based methods performed equally good irrespective of the input data types used for parenchyma extraction.Conclusion
The excellent agreement between manual and automated liver parenchyma segmentation demonstrates accuracy and robustness of the proposed method. This approach can improve radiologist workflow while reducing bias and inter-rater variability in the assessment of hepatic iron content, an important clinical parameter guiding iron removal therapy.Acknowledgements
No acknowledgement found.References
1. Anderson LJ, Holden S, Davis B, et al. Cardiovascular T2-star (T2*) magnetic resonance for the early diagnosis of myocardial iron overload. European heart journal. 2001; 22: 2171-9.
2. Wood JC, Enriquez C, Ghugre N, et al. MRI R2 and R2* mapping accurately estimates hepatic iron concentration in transfusion-dependent thalassemia and sickle cell disease patients. Blood. 2005; 106: 1460-5.
3. Hankins JS, McCarville MB, Loeffler RB, et al. R2* magnetic resonance imaging of the liver in patients with iron overload. Blood. 2009; 113: 4853-5.
4. McCarville MB, Hillenbrand CM, Loeffler RB, et al. Comparison of whole liver and small region-of-interest measurements of MRI liver R2* in children with iron overload. Pediatric radiology. 2010; 40: 1360-7.
5. Deng J, Rigsby CK, Schoeneman S and Boylan E. A semiautomatic postprocessing of liver R2* measurement for assessment of liver iron overload. Magnetic resonance imaging. 2012; 30: 799-806.
6. Frangi AF, Niessen WJ, Vincken KL and Viergever MA. Multiscale vessel enhancement filtering. Medical Image Computing and Computer-Assisted Intervention. 1998; 1496: 130-7.
7. Gudbjartsson H and Patz S. The Rician distribution of noisy MRI data. Magn Reson Med. 1995; 34: 910-4.
8. Krafft AJ, Loeffler RB, Song R, et al. Does fat suppression via chemically selective saturation affect R2*-MRI for transfusional iron overload assessment? A clinical evaluation at 1.5T and 3T. Magnetic resonance in medicine. 2015.
9. Triadyaksa P, Handayani A, Dijkstra H, et al. Contrast-optimized composite image derived from multigradient echo cardiac magnetic resonance imaging improves reproducibility of myocardial contours and T2* measurement. Magma. 2016; 29: 17-27.
Figures